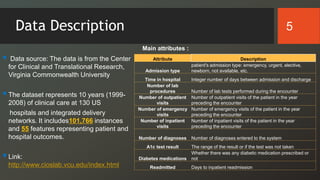
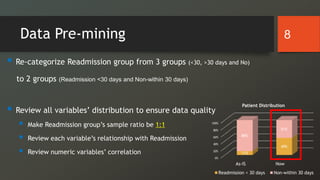
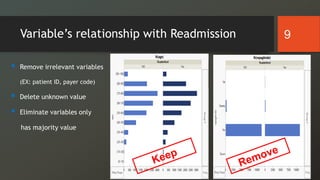
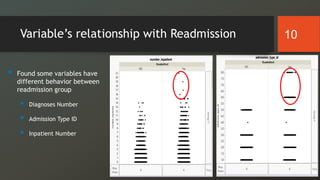
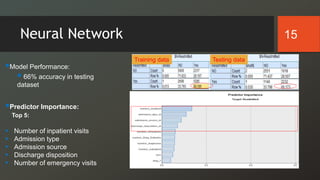
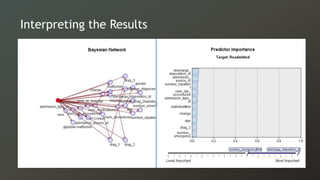
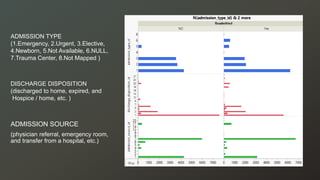
Data Mining for
Diabetes Readmission Prediction
Team Evolution
Yi Chun Chien, Xiayu Zeng, Hong Zhang, Yixi Zhang
Agenda
 Abstract
 Introduction
 Data Description
 Problem Statement
 Methodology
 Discussions and Results
 Conclusions
2
Abstract
Background: Alarmingly high risk of readmissions in the US
Goal: discover factors contributing to hospitals readmissions
Methods: C5.0 Decision Tree, Quest, Neural Network and Bayesian Network
Results: readmissions rely on a combined effect of multiple variables
Conclusions: effective prediction on readmissions enables hospitals to
identify and target patients at the highest risk for readmissions
3
Introduction
 Topic: Diabetes Readmission Prediction
 What Is Readmission Rate
 A hospitalization that occurs within 30 days after a discharge
 Why Is Readmission Important
 Reduce cost of care and medical disputes
 Improve patients’ safety and health
4
Data Description
 Data source: The data is from the Center
for Clinical and Translational Research,
Virginia Commonwealth University
The dataset represents 10 years (1999-
2008) of clinical care at 130 US
hospitals and integrated delivery
networks. It includes101,766 instances
and 55 features representing patient and
hospital outcomes.
Link:
http://www.cioslab.vcu.edu/index.html
Attribute Description
Admission type
patient's admission type: emergency, urgent, elective,
newborn, not available, etc.
Time in hospital Integer number of days between admission and discharge
Number of lab
procedures Number of lab tests performed during the encounter
Number of outpatient
visits
Number of outpatient visits of the patient in the year
preceding the encounter
Number of emergency
visits
Number of emergency visits of the patient in the year
preceding the encounter
Number of inpatient
visits
Number of inpatient visits of the patient in the year
preceding the encounter
Number of diagnoses Number of diagnoses entered to the system
A1c test result The range of the result or if the test was not taken
Diabetes medications
Whether there was any diabetic medication prescribed or
not
Readmitted Days to inpatient readmission
Main attributes :
5
Methodology
 Business Outlook
 Data
Processing
 Variable
Selection
 Accuracy
Comparison
 Conclusion
 Model Building
Problem
Statement
Data
Pre-mining
Perform
AnalysisEvaluation
6
Problem Statement
 Identify the major factors that contribute to hospital readmissions
 Measure the influence of every attribute
 Compare accuracy of each model
7
0%
20%
40%
60%
80%
100%
As-IS Now
11%
49%
89%
51%
Patient Distribution
Readmission < 30 days Non-within 30 days
Data Pre-mining
 Re-categorize Readmission group from 3 groups (<30, >30 days and No)
to 2 groups (Readmission <30 days and Non-within 30 days)
 Review all variables’ distribution to ensure data quality
 Make Readmission group’s sample ratio be 1:1
 Review each variable’s relationship with Readmission
 Review numeric variables’ correlation
8
Variable’s relationship with Readmission
 Remove irrelevant variables
(EX: patient ID, payer code)
 Delete unknown value
 Eliminate variables only
has majority value
9
Variable’s relationship with Readmission
 Found some variables have
different behavior between
readmission group
 Diagnoses Number
 Admission Type ID
 Inpatient Number
10
Review numeric variables’ correlation
 No correlation between
numeric variables’
correlation
 Numeric variables are
independent
11
Perform Analysis
 Input variables: 35; Output variable: Readmission group
 Total sample size: 23,154
 Partition: 70% on Training; 30% on Testing
 Build models from (1) Decision Tree Analysis: C5.0 & QUEST
(2) Apply Neural Network Methodology
(3) Perform Bayes’ Analysis
12
13Model Stream
Hidden Layer=5 Hidden Layer=8
Neural Network - Comparison 14
Hidden layer = 5 Hidden layer = 8
13
Neural Network 15
Training data Testing data
Model Performance:
 66% accuracy in testing
dataset
Predictor Importance:
Top 5:
 Number of inpatient visits
 Admission type
 Admission source
 Discharge disposition
 Number of emergency visits
Why Use Bayesian Network
• Well suited for categorical variables
• Have probability for reference
• Allow variables’ dependency
16
Interpreting the Results
• Overall Model:
Training accuracy: 70.67%
Testing accuracy: 69.51%
• Model on “Yes” results:
Training accuracy: 71.35%
Testing accuracy: 69.54%
19Decision Tree: C5.0
Decision tree (part)
20Decision Tree: C5.0
Model Performance:
 65% accuracy in testing
dataset
Predictor Importance:
Top 5:
 Admission type
 Admission source
 Discharge disposition
 Number of inpatient visits
 Number of lab procedures
Decision Tree: QUEST
 What’s QUEST: Quick, Unbiased and Efficient Statistical Tree
 Advantage:
 Easily handle categorical predictor variables with many categories
 Use imputation to deal with missing values
 It provides linear splits using Fisher's LDA method
 How to improve accuracy
 Boosting: Randomly re-sample N dataset -> create
N trees -> optimal by weighted average
 Bagging: optimal by aggregated average
21
Decision Tree: QUEST
 Adopt Boosting method in QUEST
 Model Performance:
 72% accuracy in testing dataset
 Variable Importance:
 Top 5: Admission Type,
Admission Source,
Number of inpatient visits
Discharge Deposition,
Number of diagnoses
22
Training data Testing data
Model Evaluation 23
QUEST C5.0 Neural Net Bayesian
Admission Type Admission Type Inpatient # Discharge Disposition
Admission Source Admission Source Admission Type Admission Source
Inpatient # Discharge Disposition Admission Source Inpatient #
Discharge Disposition Inpatient # Discharge Disposition Lab Procedures #
Diagonose # Lab Procedures # Emergency # Admission Type
Top Important Variables:
 QUEST has the best accuracy
• Top 4 variables: Admission Type, Admission
Source, number of inpatient visits and
Discharge disposition.
NUMBER OF INPATIENT VISITS
(Number of inpatient visits of the patient in the year
preceding the encounter)
From the graph, it’s shown that number of inpatient visits
potentially increases the risk of readmission. For patients
who stayed in a hospital over 15 times in a year, they
would be 100% readmitted to the hospital within 30 days.
Inpatient treatment facilities should better provide
additional and more specialized medical care to reduce
their readmission rate.
Evaluation of top 4 important attributes
25ADMISSION TYPE
(1.Emergency, 2.Urgent, 3.Elective,
4.Newborn, 5.Not Available, 6.NULL,
7.Trauma Center, 8.Not Mapped )
ADMISSION SOURCE
(physician referral, emergency room,
and transfer from a hospital, etc.)
DISCHARGE DISPOSITION
(discharged to home, expired, and
Hospice / home, etc. )
Decision Tree by JMP
Decision tree(part)
27
27Conclusion
• Data pre-mining is of upmost importance in improving the model accuracy
(1%72%);
• The readmission groups are related to admission source,admission type,
discharge disposition and number of inpatient visits;
• The readmission groups do not solely depend on any single variable, but
interactions of related variables;
• Instead of tracking all 55 attributes, hospitals are suggested to focus on number
of patient’s inpatient visits, admission source, admission type, discharge
disposition;
• Hospitals are advised to concern not only inpatient treatment but also continuing
care after discharge.

Data mining for diabetes readmission final

  • 1.
    Data Mining for DiabetesReadmission Prediction Team Evolution Yi Chun Chien, Xiayu Zeng, Hong Zhang, Yixi Zhang
  • 2.
    Agenda  Abstract  Introduction Data Description  Problem Statement  Methodology  Discussions and Results  Conclusions 2
  • 3.
    Abstract Background: Alarmingly highrisk of readmissions in the US Goal: discover factors contributing to hospitals readmissions Methods: C5.0 Decision Tree, Quest, Neural Network and Bayesian Network Results: readmissions rely on a combined effect of multiple variables Conclusions: effective prediction on readmissions enables hospitals to identify and target patients at the highest risk for readmissions 3
  • 4.
    Introduction  Topic: DiabetesReadmission Prediction  What Is Readmission Rate  A hospitalization that occurs within 30 days after a discharge  Why Is Readmission Important  Reduce cost of care and medical disputes  Improve patients’ safety and health 4
  • 5.
    Data Description  Datasource: The data is from the Center for Clinical and Translational Research, Virginia Commonwealth University The dataset represents 10 years (1999- 2008) of clinical care at 130 US hospitals and integrated delivery networks. It includes101,766 instances and 55 features representing patient and hospital outcomes. Link: http://www.cioslab.vcu.edu/index.html Attribute Description Admission type patient's admission type: emergency, urgent, elective, newborn, not available, etc. Time in hospital Integer number of days between admission and discharge Number of lab procedures Number of lab tests performed during the encounter Number of outpatient visits Number of outpatient visits of the patient in the year preceding the encounter Number of emergency visits Number of emergency visits of the patient in the year preceding the encounter Number of inpatient visits Number of inpatient visits of the patient in the year preceding the encounter Number of diagnoses Number of diagnoses entered to the system A1c test result The range of the result or if the test was not taken Diabetes medications Whether there was any diabetic medication prescribed or not Readmitted Days to inpatient readmission Main attributes : 5
  • 6.
    Methodology  Business Outlook Data Processing  Variable Selection  Accuracy Comparison  Conclusion  Model Building Problem Statement Data Pre-mining Perform AnalysisEvaluation 6
  • 7.
    Problem Statement  Identifythe major factors that contribute to hospital readmissions  Measure the influence of every attribute  Compare accuracy of each model 7
  • 8.
    0% 20% 40% 60% 80% 100% As-IS Now 11% 49% 89% 51% Patient Distribution Readmission< 30 days Non-within 30 days Data Pre-mining  Re-categorize Readmission group from 3 groups (<30, >30 days and No) to 2 groups (Readmission <30 days and Non-within 30 days)  Review all variables’ distribution to ensure data quality  Make Readmission group’s sample ratio be 1:1  Review each variable’s relationship with Readmission  Review numeric variables’ correlation 8
  • 9.
    Variable’s relationship withReadmission  Remove irrelevant variables (EX: patient ID, payer code)  Delete unknown value  Eliminate variables only has majority value 9
  • 10.
    Variable’s relationship withReadmission  Found some variables have different behavior between readmission group  Diagnoses Number  Admission Type ID  Inpatient Number 10
  • 11.
    Review numeric variables’correlation  No correlation between numeric variables’ correlation  Numeric variables are independent 11
  • 12.
    Perform Analysis  Inputvariables: 35; Output variable: Readmission group  Total sample size: 23,154  Partition: 70% on Training; 30% on Testing  Build models from (1) Decision Tree Analysis: C5.0 & QUEST (2) Apply Neural Network Methodology (3) Perform Bayes’ Analysis 12
  • 13.
  • 14.
    Hidden Layer=5 HiddenLayer=8 Neural Network - Comparison 14 Hidden layer = 5 Hidden layer = 8
  • 15.
    13 Neural Network 15 Trainingdata Testing data Model Performance:  66% accuracy in testing dataset Predictor Importance: Top 5:  Number of inpatient visits  Admission type  Admission source  Discharge disposition  Number of emergency visits
  • 16.
    Why Use BayesianNetwork • Well suited for categorical variables • Have probability for reference • Allow variables’ dependency 16
  • 17.
  • 18.
    • Overall Model: Trainingaccuracy: 70.67% Testing accuracy: 69.51% • Model on “Yes” results: Training accuracy: 71.35% Testing accuracy: 69.54%
  • 19.
  • 20.
    20Decision Tree: C5.0 ModelPerformance:  65% accuracy in testing dataset Predictor Importance: Top 5:  Admission type  Admission source  Discharge disposition  Number of inpatient visits  Number of lab procedures
  • 21.
    Decision Tree: QUEST What’s QUEST: Quick, Unbiased and Efficient Statistical Tree  Advantage:  Easily handle categorical predictor variables with many categories  Use imputation to deal with missing values  It provides linear splits using Fisher's LDA method  How to improve accuracy  Boosting: Randomly re-sample N dataset -> create N trees -> optimal by weighted average  Bagging: optimal by aggregated average 21
  • 22.
    Decision Tree: QUEST Adopt Boosting method in QUEST  Model Performance:  72% accuracy in testing dataset  Variable Importance:  Top 5: Admission Type, Admission Source, Number of inpatient visits Discharge Deposition, Number of diagnoses 22 Training data Testing data
  • 23.
    Model Evaluation 23 QUESTC5.0 Neural Net Bayesian Admission Type Admission Type Inpatient # Discharge Disposition Admission Source Admission Source Admission Type Admission Source Inpatient # Discharge Disposition Admission Source Inpatient # Discharge Disposition Inpatient # Discharge Disposition Lab Procedures # Diagonose # Lab Procedures # Emergency # Admission Type Top Important Variables:  QUEST has the best accuracy • Top 4 variables: Admission Type, Admission Source, number of inpatient visits and Discharge disposition.
  • 24.
    NUMBER OF INPATIENTVISITS (Number of inpatient visits of the patient in the year preceding the encounter) From the graph, it’s shown that number of inpatient visits potentially increases the risk of readmission. For patients who stayed in a hospital over 15 times in a year, they would be 100% readmitted to the hospital within 30 days. Inpatient treatment facilities should better provide additional and more specialized medical care to reduce their readmission rate. Evaluation of top 4 important attributes
  • 25.
    25ADMISSION TYPE (1.Emergency, 2.Urgent,3.Elective, 4.Newborn, 5.Not Available, 6.NULL, 7.Trauma Center, 8.Not Mapped ) ADMISSION SOURCE (physician referral, emergency room, and transfer from a hospital, etc.) DISCHARGE DISPOSITION (discharged to home, expired, and Hospice / home, etc. )
  • 26.
    Decision Tree byJMP Decision tree(part)
  • 27.
    27 27Conclusion • Data pre-miningis of upmost importance in improving the model accuracy (1%72%); • The readmission groups are related to admission source,admission type, discharge disposition and number of inpatient visits; • The readmission groups do not solely depend on any single variable, but interactions of related variables; • Instead of tracking all 55 attributes, hospitals are suggested to focus on number of patient’s inpatient visits, admission source, admission type, discharge disposition; • Hospitals are advised to concern not only inpatient treatment but also continuing care after discharge.

Editor's Notes

  • #25 From the perspective of number_inpatient, we can see that when number_inpatient is less than 3, the readimission rate is relatively low. By contrast, when it is higher or equal to three, the readmission rate becomes very high. And it even goes to 100 percent when it is larger than or equals to 14.So, the hospitals should aimed at increasing the number of inpatient visits of the patient in the year preceding the encounter to increase the readmission rate of the patients, thus realizing their business goal.