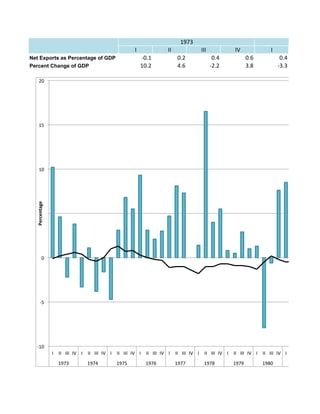
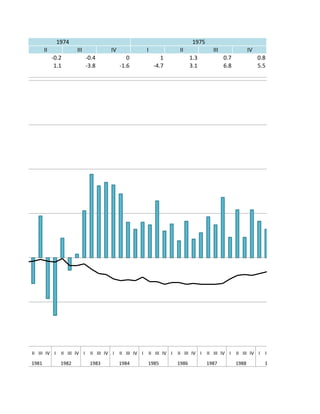
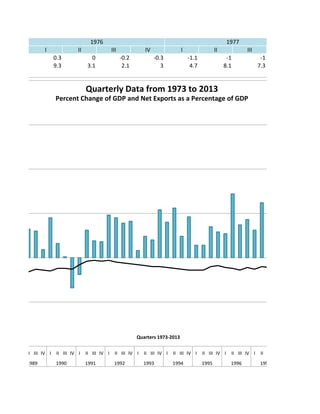
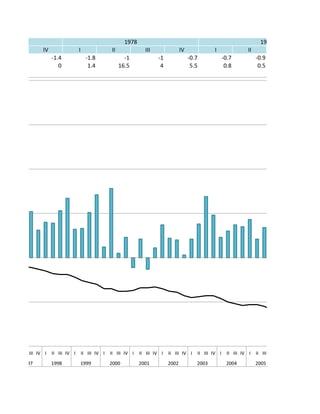
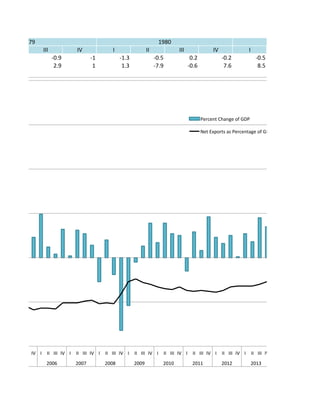
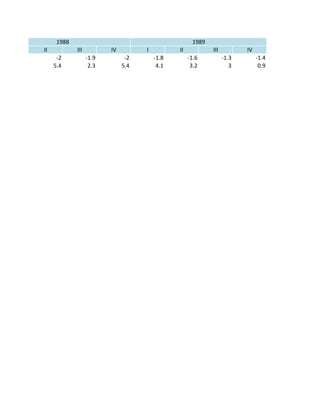
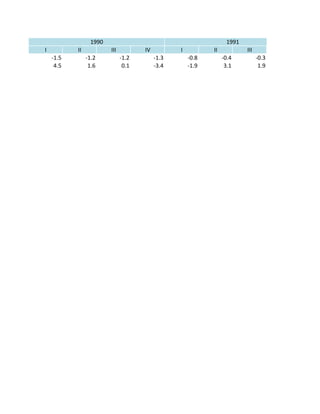
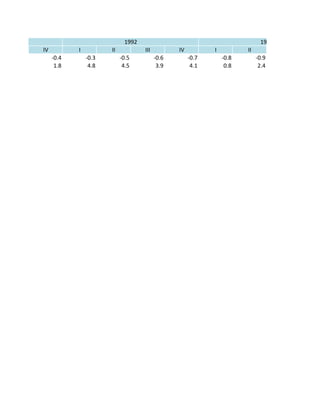
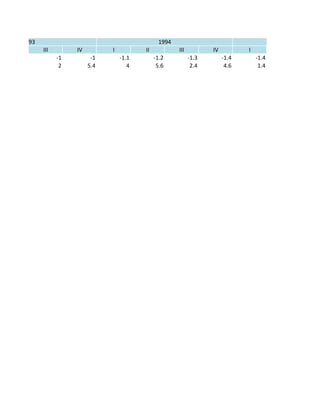
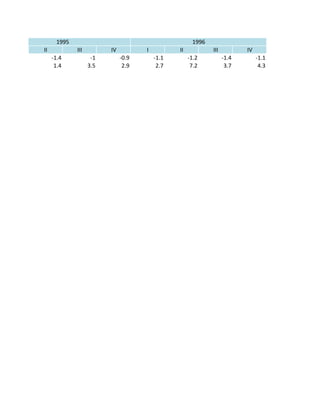
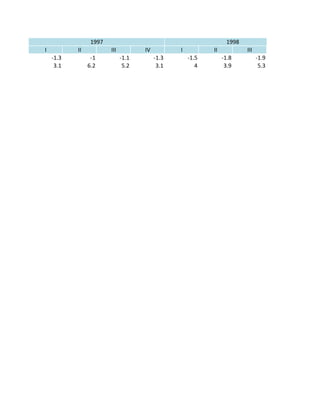
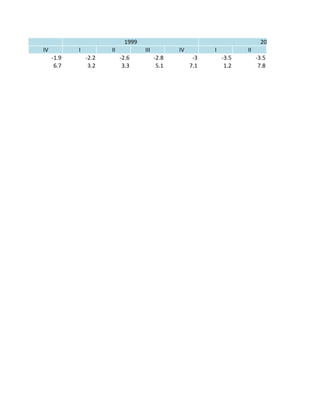
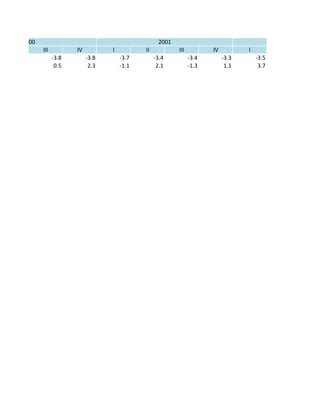
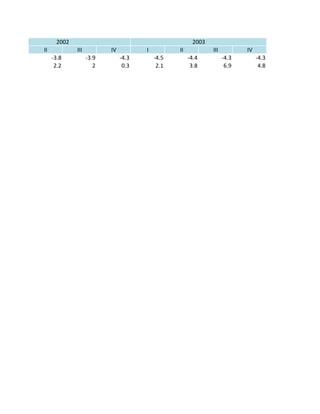
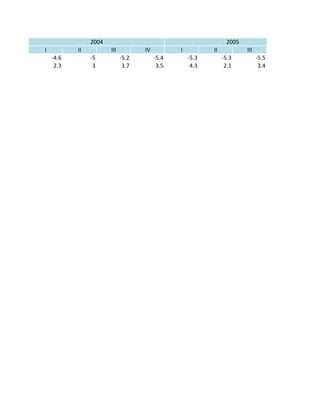
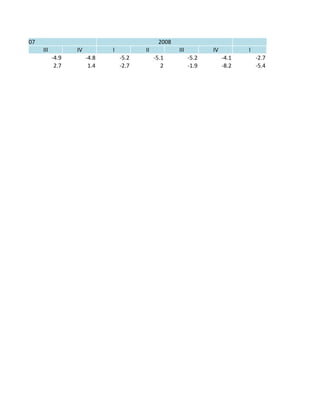
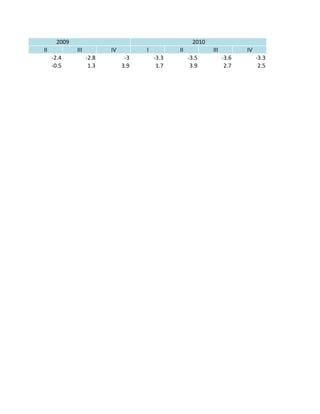
The document presents quarterly data on the percentage change of GDP and net exports as a percentage of GDP in the United States from 1973 to 2013. It shows that GDP growth fluctuated between growth of over 10% and contractions of over 7% at different points during this period. Net exports as a percentage of GDP varied between positive 0.6% and negative 5.9% across quarters.
In this 1 hour webinar hosted by CharityNet USA, we discuss branding and how it is essential to the success of your nonprofit organization. For more information on nonprofit marketing, please visit: http://www.charitynetusa.com/nonprofit_marketing.php
Jaidah Automotive providing the Chevrolet business choices and fleet solutions to all SME, Key Account, Corporate, Governmental companies and looking to be a partner by offering the peace of mind to serve our clients in a professional manner.
WE ARE READY FOR BUSINESS.
FattoreMamma (Facteur Maman)est une agence en Italie spécialisée dans la communication et le marketing AVEC les mamans. FattoreMamma depuis 2008 travaille in particulier avec les mamans blogueuses pour mettre en relation de manière positive les entreprises et les mamans.
With India focussing on nuclear energy to meet the rising demands, it aims to produce 25 per cent of its electricity through nuclear power by 2050. The country has entered into numerous nuclear deals with African countries, owing to their high growth prospects that present significant business opportunities for corporates and investors to contribute towards the development of this continent which has over a billion in population. Transport, including roads and highways, ports and airports and railways, present immense opportunities in the region’s infrastructure space, according to the KPMG-CII background paper titled – ‘India and Africa – collaboration for growth’.
The G7 labour market dashboard gives a quick overview of key labour market developments in G7 countries. It compares unemployment, employment, labour force, GDP growth, wages and unit labour costs across all seven countries.
Annual Growth Rates of Real GDP Per Capita(in percents)Ending .pdfshalini518936
Annual Growth Rates of Real GDP Per Capita
(in percents)
Ending
Year
1929
1933
-8.2
1939
0.2
1940
0.9
1945
3.7
10.3
1950
2.4
4.1
-1.8
1955
2.4
3.6
0.4
2.7
1960
2.2
2.9
0.6
1.7
0.8
1965
2.4
3.0
1.3
2.3
2.1
3.5
1970
2.3
2.9
1.5
2.3
2.2
2.9
2.3
1975
2.3
2.7
1.5
2.2
2.0
2.4
2.0
1.6
1980
2.3
2.7
1.7
2.2
2.1
2.5
2.2
2.1
2.6
1985
2.3
2.6
1.7
2.2
2.2
2.4
2.2
2.1
2.4
2.2
1990
2.3
2.6
1.8
2.2
2.2
2.4
2.2
2.2
2.4
2.2
2.3
1995
2.2
2.5
1.7
2.1
2.1
2.3
2.1
2.0
2.1
1.9
1.8
1.3
2001
2.3
2.5
1.9
2.2
2.2
2.3
2.2
2.2
2.3
2.2
2.2
2.1
2.8
1929
1940
1945
1950
1955
1960
1965
1970
1975
1980
1985
1990
1995
Starting Year
Source: Economic Report of the President, various years.
This table keeps changes in real GDP from being overstated by adjusting for
Select one:
a. productivity.
b. inflation.
c. standard of living.
d. population growth.
Question 2
Not yet answered
Marked out of 1.00
Flag question
Question text
Per Capita GDP
$33,609
$33,586
$27,126
$23,311
$23,230
Economists use numbers such as those in the table as a measure of
Select one:
a. net exports.
b. total dollar value of all final goods and services.
c. national income.
d. standard of living.
Question 3
Not yet answered
Marked out of 1.00
Flag question
Question text
Per Capita GDP
$33,609
$33,586
$27,126
$23,311
$23,230
The numbers in this table were calculated by
Select one:
a. multiplying GDP by total population.
b. dividing GDP by total population.
c. adding the dollar value of all final goods and services produced in the nation.
d. subtracting net exports from GDP.
Question 4
Not yet answered
Marked out of 1.00
Flag question
Question text
Source: “Leading Indicators Decline,” USAToday.com, October 22, 2001.
The passage discusses a business fluctuation influenced by
Select one:
a. external shock.
b. monetary factors.
c. innovation.
d. capital expenditures.
Question 5
Not yet answered
Marked out of 1.00
Flag question
Question text
Source: The New York Times, July 14, 1999.
The passage describes rising inflation as a possible result of
Select one:
a. a booming economy.
b. rising unemployment.
c. tax cuts.
d. a prolonged period of stable prices.
Annual Growth Rates of Real GDP Per Capita
(in percents)
Ending
Year
1929
1933
-8.2
1939
0.2
1940
0.9
1945
3.7
10.3
1950
2.4
4.1
-1.8
1955
2.4
3.6
0.4
2.7
1960
2.2
2.9
0.6
1.7
0.8
1965
2.4
3.0
1.3
2.3
2.1
3.5
1970
2.3
2.9
1.5
2.3
2.2
2.9
2.3
1975
2.3
2.7
1.5
2.2
2.0
2.4
2.0
1.6
1980
2.3
2.7
1.7
2.2
2.1
2.5
2.2
2.1
2.6
1985
2.3
2.6
1.7
2.2
2.2
2.4
2.2
2.1
2.4
2.2
1990
2.3
2.6
1.8
2.2
2.2
2.4
2.2
2.2
2.4
2.2
2.3
1995
2.2
2.5
1.7
2.1
2.1
2.3
2.1
2.0
2.1
1.9
1.8
1.3
2001
2.3
2.5
1.9
2.2
2.2
2.3
2.2
2.2
2.3
2.2
2.2
2.1
2.8
1929
1940
1945
1950
1955
1960
1965
1970
1975
1980
1985
1990
1995
Starting Year
Solution
Hi,
The correct answers are as follows:
1. Inflation
Eplanation: Real Gross Domestic Product (real GDP) is a macroeconomic measure of the value
of economic output adjusted for price changes (i.e., inflation or deflation)
---------
2. standard of living
Eplanation: P.
1. I II III IV I
Net Exports as Percentage of GDP -‐0.1 0.2 0.4 0.6 0.4
Percent Change of GDP 10.2 4.6 -‐2.2 3.8 -‐3.3
1973 19
-‐10
-‐5
0
5
10
15
20
I
II
III
IV
I
II
III
IV
I
II
III
IV
I
II
III
IV
I
II
III
IV
I
II
III
IV
I
II
III
IV
I
II
III
IV
I
1973
1974
1975
1976
1977
1978
1979
1980
Percentage
2. II III IV I II III IV
-‐0.2 -‐0.4 0 1 1.3 0.7 0.8
1.1 -‐3.8 -‐1.6 -‐4.7 3.1 6.8 5.5
1974 1975
II
III
IV
I
II
III
IV
I
II
III
IV
I
II
III
IV
I
II
III
IV
I
II
III
IV
I
II
III
IV
I
II
III
IV
I
II
1981
1982
1983
1984
1985
1986
1987
1988
1989
3. I II III IV I II III
0.3 0 -‐0.2 -‐0.3 -‐1.1 -‐1 -‐1
9.3 3.1 2.1 3 4.7 8.1 7.3
1976 1977
II
III
IV
I
II
III
IV
I
II
III
IV
I
II
III
IV
I
II
III
IV
I
II
III
IV
I
II
III
IV
I
II
III
IV
I
II
III
1989
1990
1991
1992
1993
1994
1995
1996
1997
Quarters
1973-‐2013
Quarterly
Data
from
1973
to
2013
Percent
Change
of
GDP
and
Net
Exports
as
a
Percentage
of
GDP
4. IV I II III IV I II
-‐1.4 -‐1.8 -‐1 -‐1 -‐0.7 -‐0.7 -‐0.9
0 1.4 16.5 4 5.5 0.8 0.5
7 1978 1979
III
IV
I
II
III
IV
I
II
III
IV
I
II
III
IV
I
II
III
IV
I
II
III
IV
I
II
III
IV
I
II
III
IV
I
II
III
1997
1998
1999
2000
2001
2002
2003
2004
2005
5. III IV I II III IV I
-‐0.9 -‐1 -‐1.3 -‐0.5 0.2 -‐0.2 -‐0.5
2.9 1 1.3 -‐7.9 -‐0.6 7.6 8.5
1979 1980 1981
III
IV
I
II
III
IV
I
II
III
IV
I
II
III
IV
I
II
III
IV
I
II
III
IV
I
II
III
IV
I
II
III
IV
I
II
III
IV
2005
2006
2007
2008
2009
2010
2011
2012
2013
Percent
Change
of
GDP
Net
Exports
as
Percentage
of
GDP
6. II III IV I II III IV
-‐0.4 -‐0.2 -‐0.4 -‐0.5 -‐0.1 -‐0.9 -‐0.9
-‐2.9 4.7 -‐4.6 -‐6.5 2.2 -‐1.4 0.4
19821981
-‐10
-‐5
0
5
10
15
20
IV
Percent
Change
rcentage
of
GDP
7. I II III IV I II III
-‐0.7 -‐1.3 -‐1.8 -‐1.9 -‐2.4 -‐2.6 -‐2.5
5.3 9.4 8.1 8.5 8.2 7.2 4
1983 1984
8. IV I II III IV I II
-‐2.6 -‐2.2 -‐2.7 -‐2.7 -‐3 -‐2.8 -‐2.8
3.2 4 3.7 6.4 3 3.8 1.9
4 1985 1986
9. III IV I II III IV I
-‐3 -‐2.9 -‐3 -‐3 -‐3 -‐2.9 -‐2.4
4.1 2.1 2.8 4.6 3.7 6.8 2.3
1986 1987 1988
10. II III IV I II III IV
-‐2 -‐1.9 -‐2 -‐1.8 -‐1.6 -‐1.3 -‐1.4
5.4 2.3 5.4 4.1 3.2 3 0.9
1988 1989
11. I II III IV I II III
-‐1.5 -‐1.2 -‐1.2 -‐1.3 -‐0.8 -‐0.4 -‐0.3
4.5 1.6 0.1 -‐3.4 -‐1.9 3.1 1.9
1990 1991
12. IV I II III IV I II
-‐0.4 -‐0.3 -‐0.5 -‐0.6 -‐0.7 -‐0.8 -‐0.9
1.8 4.8 4.5 3.9 4.1 0.8 2.4
1 1992 1993
13. III IV I II III IV I
-‐1 -‐1 -‐1.1 -‐1.2 -‐1.3 -‐1.4 -‐1.4
2 5.4 4 5.6 2.4 4.6 1.4
19941993 1995
14. II III IV I II III IV
-‐1.4 -‐1 -‐0.9 -‐1.1 -‐1.2 -‐1.4 -‐1.1
1.4 3.5 2.9 2.7 7.2 3.7 4.3
1995 1996
15. I II III IV I II III
-‐1.3 -‐1 -‐1.1 -‐1.3 -‐1.5 -‐1.8 -‐1.9
3.1 6.2 5.2 3.1 4 3.9 5.3
1997 1998
16. IV I II III IV I II
-‐1.9 -‐2.2 -‐2.6 -‐2.8 -‐3 -‐3.5 -‐3.5
6.7 3.2 3.3 5.1 7.1 1.2 7.8
8 1999 2000
17. III IV I II III IV I
-‐3.8 -‐3.8 -‐3.7 -‐3.4 -‐3.4 -‐3.3 -‐3.5
0.5 2.3 -‐1.1 2.1 -‐1.3 1.1 3.7
2000 2001 2002
18. II III IV I II III IV
-‐3.8 -‐3.9 -‐4.3 -‐4.5 -‐4.4 -‐4.3 -‐4.3
2.2 2 0.3 2.1 3.8 6.9 4.8
2002 2003
19. I II III IV I II III
-‐4.6 -‐5 -‐5.2 -‐5.4 -‐5.3 -‐5.3 -‐5.5
2.3 3 3.7 3.5 4.3 2.1 3.4
2004 2005
20. IV I II III IV I II
-‐5.9 -‐5.7 -‐5.7 -‐5.8 -‐5.1 -‐5.1 -‐5.1
2.3 4.9 1.2 0.4 3.2 0.2 3.1
20065 2007
21. III IV I II III IV I
-‐4.9 -‐4.8 -‐5.2 -‐5.1 -‐5.2 -‐4.1 -‐2.7
2.7 1.4 -‐2.7 2 -‐1.9 -‐8.2 -‐5.4
2007 2008 2009
22. II III IV I II III IV
-‐2.4 -‐2.8 -‐3 -‐3.3 -‐3.5 -‐3.6 -‐3.3
-‐0.5 1.3 3.9 1.7 3.9 2.7 2.5
2009 2010
23. I II III IV I II III
-‐3.7 -‐3.8 -‐3.7 -‐3.8 -‐3.9 -‐3.7 -‐3.3
-‐1.5 2.9 0.8 4.6 2.3 1.6 2.5
2011 2012
24. IV I II III IV
-‐3.2 -‐3.2 -‐3.2 -‐3 -‐2.7
0.1 2.7 1.8 4.5 3.5
20132