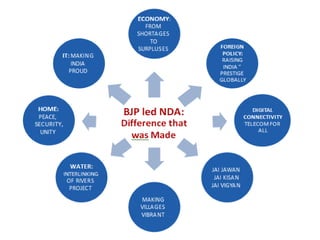
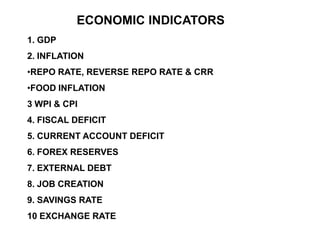
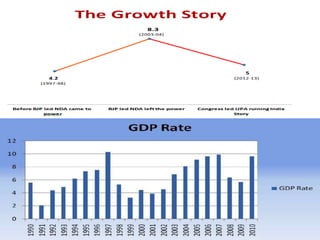
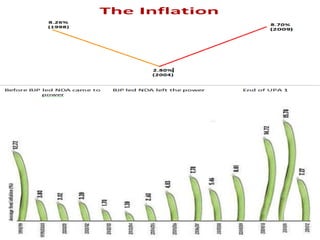
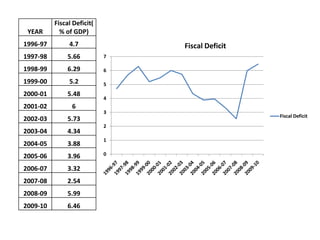
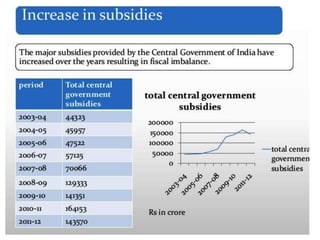
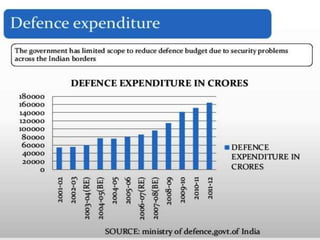
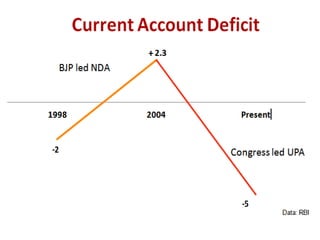
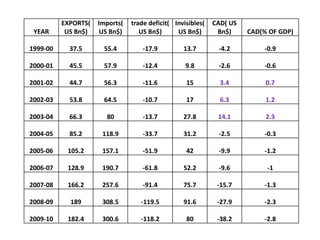
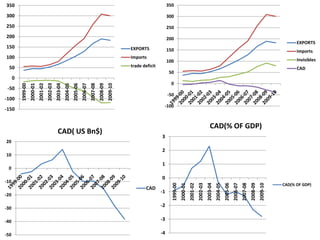
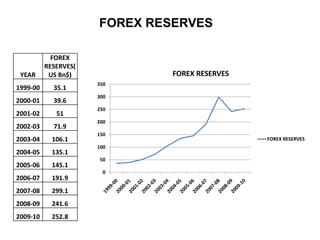
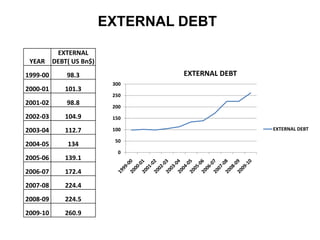
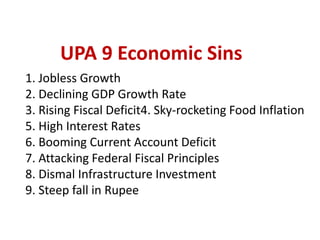
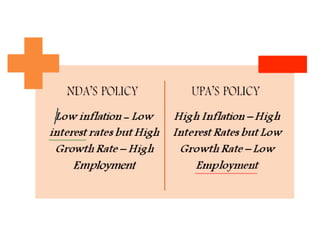
BY :- SUNIL GUPTA
Economic Policies by BJP Led NDA
Government
•Expanded the process of economic liberalisation
•His government initiated the privatisation of most state
corporations, including the Videsh Sanchar Nigam Ltd.
•His government also began the establishment of special export
processing zones, Information Technology and Industrial Parks
across the country to bolster industrial production and exports.
•His government launched the National Highway Development
Project
•In 2003, the government launched the Pravasi Bharatiya
Samman (Honouring of Non-Resident Indians) and initiated plans to
establish an Overseas citizenship of India.
•His government also expanded efforts to encourage foreign investment,
especially from Europe and the United States.
•The Vajpayee government improved India's ties with the People's
Republic of China, boosting trade and seeking the resolution of territorial
disputes through dialogue
BJP STRATEGY
•Accelerated reforms in the agricultural sector - food economy and rural
development programmes targeted.
•Intensification of infrastructure investment, continued reforms in the financial
sector and capital markets, deepening of structural reforms - dismantling
controls constraining economic activity.
•Human development through better educational opportunities and social
security.
•Reduction in non-productive expenditure and rationalisation of subsidies.
•Acceleration of the privatisation process and restructuring of public
enterprises.
•Widening of the tax base and toning up the tax administration.
•Provide social security to the poor.
•Deepen structural reforms and regenerate industrial growth.
ECONOMIC INDICATORS
1. GDP
2. INFLATION
•REPO RATE, REVERSE REPO RATE & CRR
•FOOD INFLATION
3 WPI & CPI
4. FISCAL DEFICIT
5. CURRENT ACCOUNT DEFICIT
6. FOREX RESERVES
7. EXTERNAL DEBT
8. JOB CREATION
9. SAVINGS RATE
10 EXCHANGE RATE
0
1
2
3
4
5
6
7
8
9
10
REPO RATE
REPO RATE
0
1
2
3
4
5
6
7
8
Reverse Repo Rate
Reverse Repo Rate
0
2
4
6
8
10
12
6/12/1997
17/01/1998
28/03/1998
11/4/1998
29/08/1998
13/03/1999
8/5/1999
6/11/1999
20/11/1999
8/4/2000
22/04/2000
29/07/2000
12/8/2000
24/02/2001
10/3/2001
19/05/2001
3/11/2001
29/12/2001
1/6/2002
16/11/2002
14/06/2003
18/09/2004
2/10/2004
8/12/2006
17/02/2007
3/3/2007
14/04/2007
28/04/2007
4/8/2007
10/11/2007
26/04/2008
10/5/2008
24/05/2008
5/7/2008
19/07/2008
30/08/2008
11/10/2008
15/10/2008
1/11/2008
8/11/2008
17/01/2009
Cash Reserve Ratio
Cash Reserve Ratio
0
1
2
3
4
5
6
7
8
9
WPI
WPI
0
1
2
3
4
5
6
7
8
9
10
CPI
CPI
YEAR WPI
1997-98 4.4
1998-99 5.9
1999-00 3.3
2000-01 7.1
2001-02 3.6
2002-03 3.4
2003-04 5.5
2004-05 6.5
2005-06 4.4
2006-07 6.5
2007-08 4.8
2008-09 8
YEAR CPI
1999-00 3.4
2000-01 3.7
2001-02 4.3
2002-03 4.1
2003-04 3.8
2004-05 3.9
2005-06 4.2
2006-07 6.8
2007-08 6.2
2008-09 9.1
Year Petrol Diesel LPG
1996 21.13 9.04 119.95
1997 22.84 10.34 136
1998 23.94 9.87 136
1999 23.8 9.94 146
2000 28.7 16.55 232
2001 28.7 17.06 222.25
2002 28.91 18.06 241.2
2003 32.7 20.73 241.6
2004 37.84 26.28 281.6
2005 43.49 30.45 281.6
2006 44.85 31.25 281.6
2007 43.52 30.48 281.6
2008 45.62 32.86 346.3
2009 44.72 32.92 281.2
2010 51.43 40.1 345.35
0
1
2
3
4
5
6
7
Fiscal Deficit
Fiscal Deficit
YEAR
Fiscal Deficit(
% of GDP)
1996-97 4.7
1997-98 5.66
1998-99 6.29
1999-00 5.2
2000-01 5.48
2001-02 6
2002-03 5.73
2003-04 4.34
2004-05 3.88
2005-06 3.96
2006-07 3.32
2007-08 2.54
2008-09 5.99
2009-10 6.46
YEAR
EXPORTS(
US Bn$)
Imports(
US Bn$)
trade deficit(
US Bn$)
Invisibles(
US Bn$)
CAD( US
Bn$) CAD(% OF GDP)
1999-00 37.5 55.4 -17.9 13.7 -4.2 -0.9
2000-01 45.5 57.9 -12.4 9.8 -2.6 -0.6
2001-02 44.7 56.3 -11.6 15 3.4 0.7
2002-03 53.8 64.5 -10.7 17 6.3 1.2
2003-04 66.3 80 -13.7 27.8 14.1 2.3
2004-05 85.2 118.9 -33.7 31.2 -2.5 -0.3
2005-06 105.2 157.1 -51.9 42 -9.9 -1.2
2006-07 128.9 190.7 -61.8 52.2 -9.6 -1
2007-08 166.2 257.6 -91.4 75.7 -15.7 -1.3
2008-09 189 308.5 -119.5 91.6 -27.9 -2.3
2009-10 182.4 300.6 -118.2 80 -38.2 -2.8
-4
-3
-2
-1
0
1
2
3
1999-00
2000-01
2001-02
2002-03
2003-04
2004-05
2005-06
2006-07
2007-08
2008-09
2009-10
CAD(% OF GDP)
CAD(% OF GDP)
-50
-40
-30
-20
-10
0
10
20
CAD( US Bn$)
CAD
-100
-50
0
50
100
150
200
250
300
350
EXPORTS
Imports
Invisibles
CAD
-150
-100
-50
0
50
100
150
200
250
300
350
1999-00
2000-01
2001-02
2002-03
2003-04
2004-05
2005-06
2006-07
2007-08
2008-09
2009-10
EXPORTS
Imports
trade deficit
0
50
100
150
200
250
300
350
FOREX RESERVES
FOREX RESERVES
YEAR
FOREX
RESERVES(
US Bn$)
1999-00 35.1
2000-01 39.6
2001-02 51
2002-03 71.9
2003-04 106.1
2004-05 135.1
2005-06 145.1
2006-07 191.9
2007-08 299.1
2008-09 241.6
2009-10 252.8
FOREX RESERVES
0
50
100
150
200
250
300
EXTERNAL DEBT
EXTERNAL DEBT
YEAR
EXTERNAL
DEBT( US Bn$)
1999-00 98.3
2000-01 101.3
2001-02 98.8
2002-03 104.9
2003-04 112.7
2004-05 134
2005-06 139.1
2006-07 172.4
2007-08 224.4
2008-09 224.5
2009-10 260.9
EXTERNAL DEBT
0
2
4
6
8
10
12
14
1997 1998 1999 2000 2001 2002 2003 2004 2005 2006 2007 2008 2009 2010
Unemployment %
Unemployment %
-4
-3
-2
-1
0
1
2
3
4
1997-98
1998-99
1999-00
2000-01
2001-02
2002-03
2003-04
2004-05
2005-06
2006-07
2007-08
2008-09
2009-10
SAVINGS-INVESTMENT GAP
SAVINGS-
INVESTMENT
GAP
YEAR GDS GCF
SAVINGS-INVESTMENT
GAP
1997-98 24.15 24.51 -0.36
1998-99 23.19 23.51 -0.32
1999-00 25.69 26.97 -1.28
2000-01 23.77 24.21 -0.44
2001-02 24.93 25.65 -0.72
2002-03 25.93 25.02 0.91
2003-04 29.03 26.17 2.86
2004-05 32.41 32.45 -0.04
2005-06 33.44 34.28 -0.84
2006-07 34.6 35.87 -1.27
2007-08 36.82 38.03 -1.21
2008-09 32.02 35.53 -3.51
2009-10 33.69 36.3 -2.61
GDS GROSS DOMESTIC SAVINGS(% OF GDP)
GCF
GROSS CAPITAL FORMATION(% OF
GDP)
BJP Ruled States: Performing Better
• GSDP (Gross State Domestic Product) growing at double pace than
that of National GDP which is at 5%.
• Fiscal Deficits (FD) of all BJP/NDA states below 3% while CENTRES FD
close to 6%
• Average per capita power consumptions of BJP/NDA States – 763
Units. (National Average – 631 Units)
• Average Expenditure on Education of BJP/NDA States is around
5.3% of GNP while National Average is 4.9%
• Higher Gross Primary School Enrolment Ratio and Less Drop-out.
Sum Total of
UPA Regime
UPA The Deficit Government
1. Ethical Deficit
2. Trust Deficit
3. Leadership Deficit
4. Decision Deficit
5. Governance Deficit
6. Trade Deficit
7. Fiscal Deficit
8. Revenue Deficit
9. Current Account Deficit
UPA Navratna
1. A Raja – 2G Spectrum Scam
2. Suresh Kalmadi – CWG Scam
3. Kanimozi – 2G Spectrum Scam
4. Ashok Chavan – Adarsh Building Scam
5. Pawan Kumar Bansal – Railway Bribery
6. Ashwini Kumar – Coalgate
7. Subodh Kant Sahay – Coalgate
8. Veerbhadra Singh
9. Navin Jindal
UPA 9 Economic Sins
1. Jobless Growth
2. Declining GDP Growth Rate
3. Rising Fiscal Deficit4. Sky-rocketing Food Inflation
5. High Interest Rates
6. Booming Current Account Deficit
7. Attacking Federal Fiscal Principles
8. Dismal Infrastructure Investment
9. Steep fall in Rupee
NDA rule vs UPA rule.

NDA rule vs UPA rule.

  • 1.
  • 3.
    Economic Policies byBJP Led NDA Government •Expanded the process of economic liberalisation •His government initiated the privatisation of most state corporations, including the Videsh Sanchar Nigam Ltd. •His government also began the establishment of special export processing zones, Information Technology and Industrial Parks across the country to bolster industrial production and exports. •His government launched the National Highway Development Project
  • 4.
    •In 2003, thegovernment launched the Pravasi Bharatiya Samman (Honouring of Non-Resident Indians) and initiated plans to establish an Overseas citizenship of India. •His government also expanded efforts to encourage foreign investment, especially from Europe and the United States. •The Vajpayee government improved India's ties with the People's Republic of China, boosting trade and seeking the resolution of territorial disputes through dialogue
  • 5.
    BJP STRATEGY •Accelerated reformsin the agricultural sector - food economy and rural development programmes targeted. •Intensification of infrastructure investment, continued reforms in the financial sector and capital markets, deepening of structural reforms - dismantling controls constraining economic activity. •Human development through better educational opportunities and social security. •Reduction in non-productive expenditure and rationalisation of subsidies. •Acceleration of the privatisation process and restructuring of public enterprises. •Widening of the tax base and toning up the tax administration. •Provide social security to the poor. •Deepen structural reforms and regenerate industrial growth.
  • 7.
    ECONOMIC INDICATORS 1. GDP 2.INFLATION •REPO RATE, REVERSE REPO RATE & CRR •FOOD INFLATION 3 WPI & CPI 4. FISCAL DEFICIT 5. CURRENT ACCOUNT DEFICIT 6. FOREX RESERVES 7. EXTERNAL DEBT 8. JOB CREATION 9. SAVINGS RATE 10 EXCHANGE RATE
  • 10.
  • 11.
    0 1 2 3 4 5 6 7 8 Reverse Repo Rate ReverseRepo Rate 0 2 4 6 8 10 12 6/12/1997 17/01/1998 28/03/1998 11/4/1998 29/08/1998 13/03/1999 8/5/1999 6/11/1999 20/11/1999 8/4/2000 22/04/2000 29/07/2000 12/8/2000 24/02/2001 10/3/2001 19/05/2001 3/11/2001 29/12/2001 1/6/2002 16/11/2002 14/06/2003 18/09/2004 2/10/2004 8/12/2006 17/02/2007 3/3/2007 14/04/2007 28/04/2007 4/8/2007 10/11/2007 26/04/2008 10/5/2008 24/05/2008 5/7/2008 19/07/2008 30/08/2008 11/10/2008 15/10/2008 1/11/2008 8/11/2008 17/01/2009 Cash Reserve Ratio Cash Reserve Ratio
  • 14.
    0 1 2 3 4 5 6 7 8 9 WPI WPI 0 1 2 3 4 5 6 7 8 9 10 CPI CPI YEAR WPI 1997-98 4.4 1998-995.9 1999-00 3.3 2000-01 7.1 2001-02 3.6 2002-03 3.4 2003-04 5.5 2004-05 6.5 2005-06 4.4 2006-07 6.5 2007-08 4.8 2008-09 8 YEAR CPI 1999-00 3.4 2000-01 3.7 2001-02 4.3 2002-03 4.1 2003-04 3.8 2004-05 3.9 2005-06 4.2 2006-07 6.8 2007-08 6.2 2008-09 9.1
  • 15.
    Year Petrol DieselLPG 1996 21.13 9.04 119.95 1997 22.84 10.34 136 1998 23.94 9.87 136 1999 23.8 9.94 146 2000 28.7 16.55 232 2001 28.7 17.06 222.25 2002 28.91 18.06 241.2 2003 32.7 20.73 241.6 2004 37.84 26.28 281.6 2005 43.49 30.45 281.6 2006 44.85 31.25 281.6 2007 43.52 30.48 281.6 2008 45.62 32.86 346.3 2009 44.72 32.92 281.2 2010 51.43 40.1 345.35
  • 18.
    0 1 2 3 4 5 6 7 Fiscal Deficit Fiscal Deficit YEAR FiscalDeficit( % of GDP) 1996-97 4.7 1997-98 5.66 1998-99 6.29 1999-00 5.2 2000-01 5.48 2001-02 6 2002-03 5.73 2003-04 4.34 2004-05 3.88 2005-06 3.96 2006-07 3.32 2007-08 2.54 2008-09 5.99 2009-10 6.46
  • 22.
    YEAR EXPORTS( US Bn$) Imports( US Bn$) tradedeficit( US Bn$) Invisibles( US Bn$) CAD( US Bn$) CAD(% OF GDP) 1999-00 37.5 55.4 -17.9 13.7 -4.2 -0.9 2000-01 45.5 57.9 -12.4 9.8 -2.6 -0.6 2001-02 44.7 56.3 -11.6 15 3.4 0.7 2002-03 53.8 64.5 -10.7 17 6.3 1.2 2003-04 66.3 80 -13.7 27.8 14.1 2.3 2004-05 85.2 118.9 -33.7 31.2 -2.5 -0.3 2005-06 105.2 157.1 -51.9 42 -9.9 -1.2 2006-07 128.9 190.7 -61.8 52.2 -9.6 -1 2007-08 166.2 257.6 -91.4 75.7 -15.7 -1.3 2008-09 189 308.5 -119.5 91.6 -27.9 -2.3 2009-10 182.4 300.6 -118.2 80 -38.2 -2.8
  • 23.
    -4 -3 -2 -1 0 1 2 3 1999-00 2000-01 2001-02 2002-03 2003-04 2004-05 2005-06 2006-07 2007-08 2008-09 2009-10 CAD(% OF GDP) CAD(%OF GDP) -50 -40 -30 -20 -10 0 10 20 CAD( US Bn$) CAD -100 -50 0 50 100 150 200 250 300 350 EXPORTS Imports Invisibles CAD -150 -100 -50 0 50 100 150 200 250 300 350 1999-00 2000-01 2001-02 2002-03 2003-04 2004-05 2005-06 2006-07 2007-08 2008-09 2009-10 EXPORTS Imports trade deficit
  • 24.
    0 50 100 150 200 250 300 350 FOREX RESERVES FOREX RESERVES YEAR FOREX RESERVES( USBn$) 1999-00 35.1 2000-01 39.6 2001-02 51 2002-03 71.9 2003-04 106.1 2004-05 135.1 2005-06 145.1 2006-07 191.9 2007-08 299.1 2008-09 241.6 2009-10 252.8 FOREX RESERVES
  • 25.
    0 50 100 150 200 250 300 EXTERNAL DEBT EXTERNAL DEBT YEAR EXTERNAL DEBT(US Bn$) 1999-00 98.3 2000-01 101.3 2001-02 98.8 2002-03 104.9 2003-04 112.7 2004-05 134 2005-06 139.1 2006-07 172.4 2007-08 224.4 2008-09 224.5 2009-10 260.9 EXTERNAL DEBT
  • 26.
    0 2 4 6 8 10 12 14 1997 1998 19992000 2001 2002 2003 2004 2005 2006 2007 2008 2009 2010 Unemployment % Unemployment %
  • 28.
    -4 -3 -2 -1 0 1 2 3 4 1997-98 1998-99 1999-00 2000-01 2001-02 2002-03 2003-04 2004-05 2005-06 2006-07 2007-08 2008-09 2009-10 SAVINGS-INVESTMENT GAP SAVINGS- INVESTMENT GAP YEAR GDSGCF SAVINGS-INVESTMENT GAP 1997-98 24.15 24.51 -0.36 1998-99 23.19 23.51 -0.32 1999-00 25.69 26.97 -1.28 2000-01 23.77 24.21 -0.44 2001-02 24.93 25.65 -0.72 2002-03 25.93 25.02 0.91 2003-04 29.03 26.17 2.86 2004-05 32.41 32.45 -0.04 2005-06 33.44 34.28 -0.84 2006-07 34.6 35.87 -1.27 2007-08 36.82 38.03 -1.21 2008-09 32.02 35.53 -3.51 2009-10 33.69 36.3 -2.61 GDS GROSS DOMESTIC SAVINGS(% OF GDP) GCF GROSS CAPITAL FORMATION(% OF GDP)
  • 30.
    BJP Ruled States:Performing Better • GSDP (Gross State Domestic Product) growing at double pace than that of National GDP which is at 5%. • Fiscal Deficits (FD) of all BJP/NDA states below 3% while CENTRES FD close to 6% • Average per capita power consumptions of BJP/NDA States – 763 Units. (National Average – 631 Units) • Average Expenditure on Education of BJP/NDA States is around 5.3% of GNP while National Average is 4.9% • Higher Gross Primary School Enrolment Ratio and Less Drop-out.
  • 33.
  • 34.
    UPA The DeficitGovernment 1. Ethical Deficit 2. Trust Deficit 3. Leadership Deficit 4. Decision Deficit 5. Governance Deficit 6. Trade Deficit 7. Fiscal Deficit 8. Revenue Deficit 9. Current Account Deficit
  • 35.
    UPA Navratna 1. ARaja – 2G Spectrum Scam 2. Suresh Kalmadi – CWG Scam 3. Kanimozi – 2G Spectrum Scam 4. Ashok Chavan – Adarsh Building Scam 5. Pawan Kumar Bansal – Railway Bribery 6. Ashwini Kumar – Coalgate 7. Subodh Kant Sahay – Coalgate 8. Veerbhadra Singh 9. Navin Jindal
  • 37.
    UPA 9 EconomicSins 1. Jobless Growth 2. Declining GDP Growth Rate 3. Rising Fiscal Deficit4. Sky-rocketing Food Inflation 5. High Interest Rates 6. Booming Current Account Deficit 7. Attacking Federal Fiscal Principles 8. Dismal Infrastructure Investment 9. Steep fall in Rupee