Download as PDF, PPTX


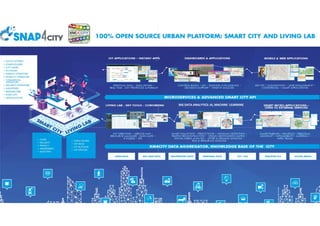
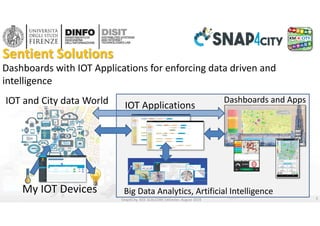

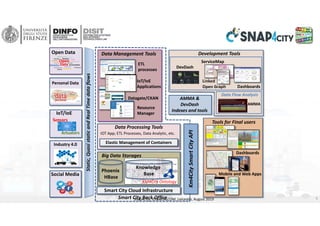
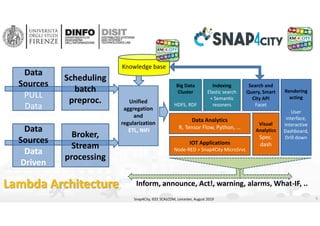
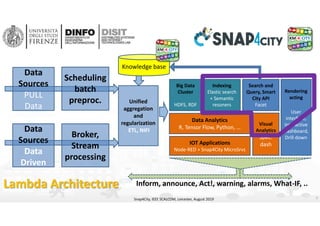
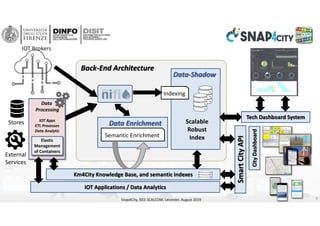
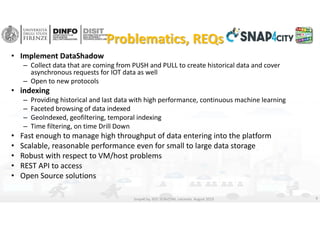
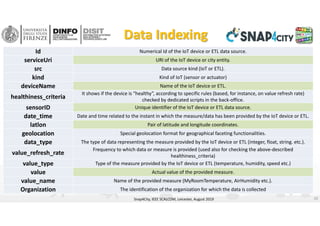
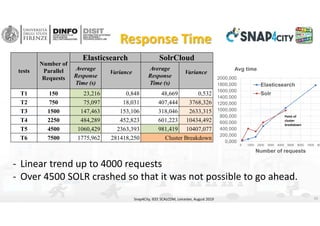
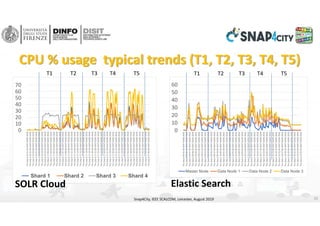
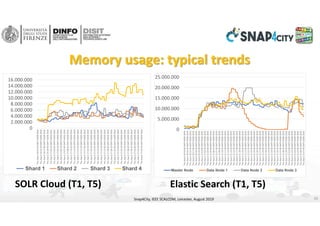
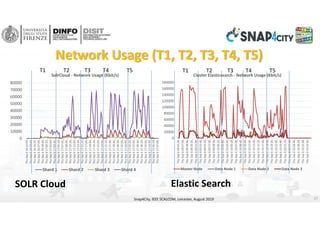
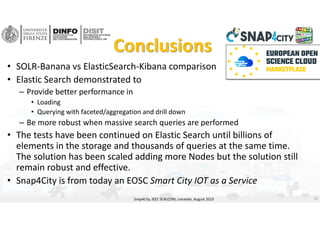

The document describes a data management and visualization platform for smart cities and IoT called Snap4City. It uses a lambda architecture to process streaming and batch data using tools like HDFS, Elasticsearch, Kibana and Node-RED. The platform was tested using SolrCloud and Elasticsearch to index 30 million documents totaling 7GB. Elasticsearch had better performance, scaling to 4500 parallel requests while SolrCloud broke down after 1500 requests. CPU usage increased linearly as requests grew.


