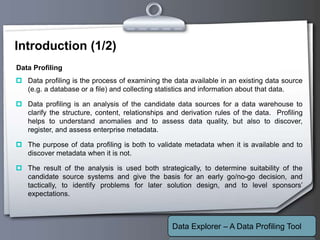
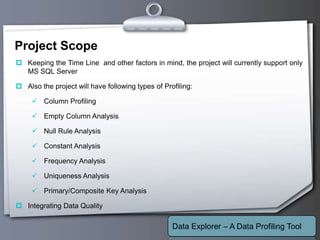
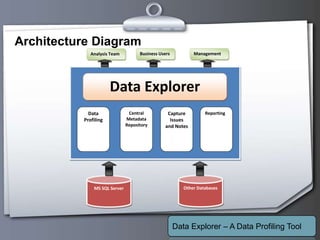
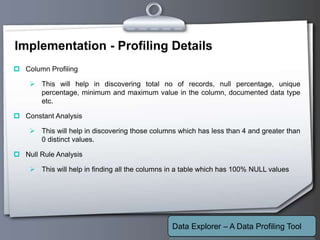
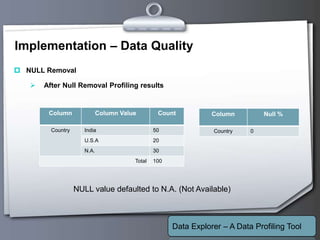
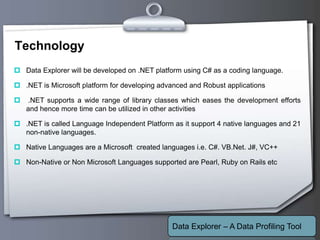
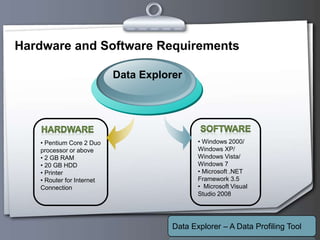
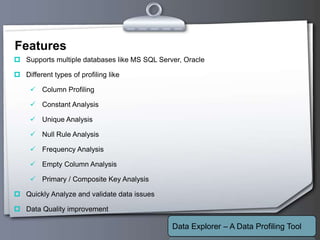
How to Build your Training Set for a Learning To Rank Project - HaystackSease
Presented by Alessandro Benedetti of Sease, Learning to Rank (LTR) is the application of machine learning techniques (typically supervised), in the formulation of ranking models for information retrieval systems.
With LTR becoming more and more popular, organizations struggle with the problem of how to collect and structure relevance signals necessary to train their ranking models.
This talk is a technical guide to explore and master various techniques to generate your training set(s) correctly and efficiently.
Expect to learn how to :
- model and collect the necessary feedback from the users (implicit or explicit)
- calculate for each training sample a relevance label that is meaningful and not ambiguous (Click Through Rate, Sales Rate ...)
- transform the raw data collected in an effective training set (in the numerical vector format most of the LTR training libraries expect)
Join us as we explore real-world scenarios and dos and don'ts from the e-commerce industry.
pega training tutorials for beginners,pega online training classes for all if professionals.interested Guys can contact and email to : ashockroy99@gmail.com
Managing FMCG sales is a complicated process. In fact, sales managers spend too much time making sense of the vast amounts of data at their disposal in MS Excel. This process inherently is inefficient, causes lags in decision making and is error-prone. JARVIS Business Intelligence now provides Dashboards for sales managers to monitor secondary sales.
Qiagram is a collaborative visual data exploration environment that enables investigator-initiated, hypothesis-driven data exploration, allowing business users as well as IT professionals to easily ask complex questions against complex data sets.
Need for System Analysis
Stages in System Analysis
Structured SAD and tools :
DFD
Context Diagram
Decision Table
Structured Diagram.
System Development Models:
Water Flow
Prototype
Spiral
RAD
Roles and responsibilities of
System Analyst,
Database Administrator
Database Designer
SQL Shot is a unique highly graphic oriented performance and tuning for Microsoft SQL Server, Sybase ASE and Oracle Database isolating any performance issue in seconds.
Intro of Key Features of SoftCAAT Pro softwarerafeq
This presentation provides an overview of key features of SoftCAAT Pro Software with use cases. SoftCAAT Pro is a independent Data Analytics designed specially for CA Firms and their teams to perform Data Analytics in assignments of Assurance, Compliance or Fraud Investigation.
Intro of Key Features of SoftCAAT BI SQL Softwarerafeq
This presentation provides a brief overview of SoftCAAT BI SQL with use cases. SoftCAAT BI SQL is a Data Analytics/BI software specially designed for performing Analytics/BI/MIS on large volume of data in SQL in the assignments of Assurance, Compliance and Fraud Investigations.
Big Data Testing : Automate theTesting of Hadoop, NoSQL & DWH without Writing...RTTS
Testing of Hadoop, NoSQL and Data Warehouses Visually
-----------------------------------------------------------------------------
We just made automated data testing really easy. Automate your Big Data testing visually, with no programming needed.
See how to automate Hadoop, No SQL and Data Warehouse testing visually, without writing any SQL or HQL. See how QuerySurge, the leading Big Data testing solution, provides novices and non-technical team members with a fast & easy way to be productive immediately while speeding up testing for team members skilled in SQL/HQL.
This webinar is geared towards:
- Big Data & Data Warehouse Architects, ETL Developers
- ETL Testers, Big Data Testers
- Data Analysts
- Operations teams
- Business Intelligence (BI) Architects
- Data Management Officers & Directors
You will learn how to:
• Improve your Data Quality
• Accelerate your data testing cycles
• Reduce your costs & risks
• Realize a huge ROI
How to Automate your Enterprise Application / ERP TestingRTTS
Your organization has a major system that is central to running its business.
-Maybe it’s an ERP system running SAP, Oracle, Lawson or maybe a CRM system running Salesforce or Microsoft Dynamics,
- or it’s a banking or trading system at a bank or other financial institution,
- or an HR system running payroll through PeopleSoft or Workday
Whatever the system is, it is constantly sending or receiving data feeds (generally in XML or flat file formats) to or from a customer, vendor, or another internal system.
These major data interfaces are present in companies across every industry — from Financials to Pharmaceuticals, and Retail to Utilities — and they are handling data that is crucial to each business. As systems become more complex, it becomes more difficult for you to catch bad records or major data defects effectively before they reach their target system.
Catch those "hard-to-find" data defects
Your systems could be sending/receiving hundreds of feeds from different applications or data sources and each with different owners. In these circumstances, you may have little to no control over the format or quality of the data. Now this data needs to be integrated, mapped, and transformed into your systems. Can your existing manual testing process handle this task?
The challenges you’re facing:
Business: You’re working under time and resource constraints, so you need to speed up testing yet still increase coverage of data tested
Technology: There is no easy way to natively test flat files, XML files, databases or Excel against any other data format
Resources: You do not have enough people to test all of the data from the data feeds all of the time
You know that this data needs to be consistently accurate and reliable — and catching any bad data or data defects seems almost impossible.
Solve your Data Interface testing challenges
QuerySurge is built to automate the testing for any movement of data, testing simple or complex transformations (ETL), as well as data movement without any transformation.
- Test across different platforms, whether Big Data, data warehouse, database(s), NoSQL document store, flat files, json, web services or xml.
- Automate the testing effort from the kickoff of tests to the data comparison to auto-emailing the results.
- Speed up data testing and validation by as much as 1,000 times.
- Schedule tests to run immediately, every Tuesday at 2:00am or after an event, such as an ETL job, triggers the tests.
- Utilize the Data Analytics Dashboard and Data Intelligence Reports to analyze your data testing.
- Get 100% coverage with a dramatic decrease in testing time
It will allow you to quickly compare file to file, file to XML, and XML/files to a database without having to import your files into a database first (it also compares database to database).
Query Wizards - data testing made easy - no programmingRTTS
Fast and easy. No Programming needed. The latest QuerySurge release introduces the new Query Wizards. The Wizards allow both novice and experienced team members to validate their organization's data quickly with no SQL programming required.
The Wizards provide an immediate ROI through their ease-of-use and ensure that minimal time and effort are required for developing tests and obtaining results. Even novice testers are productive as soon as they start using the Wizards!
According to a recent survey of Data Architects and other data experts on LinkedIn, approximately 80% of columns in a data warehouse have no transformations, meaning the Wizards can test all of these columns quickly & easily, (The columns with transformations can be tested using the QuerySurge Design library using custom SQL coding.)
There are 3 Types of automated Data Comparisons:
- Column-Level Comparison
- Table-Level Comparison
- Row Count Comparison
There are also automated features for filtering (‘Where’ clause) and sorting (‘Order By’ clause).
The Wizards provide both novices and non-technical team members with a fast & easy way to be productive immediately and speed up testing for team members skilled in SQL.
Trial our software either as a download or in the cloud at www.QuerySurge.com. The trial comes with a built-in tutorial and sample data.
Solving Data Discovery Challenges at Lyft with Amundsen, an Open-source Metad...Databricks
Amundsen is the data discovery metadata platform that originated from Lyft which is recently donated to Linux Foundation AI. Since its open-sourced, Amundsen has been used and extended by many different companies within our community.
Database Performance monitoring tool for Microsoft SQL Server 2005 & 2008 (included in "SQL Server 2008 R2 Unleashed" best-selling book), Sybase ASE 11.5 to 15.5 and Oracle 8i to 11g.
Data Warehouse Testing in the Pharmaceutical IndustryRTTS
In the U.S., pharmaceutical firms and medical device manufacturers must meet electronic record-keeping regulations set by the Food and Drug Administration (FDA). The regulation is Title 21 CFR Part 11, commonly known as Part 11.
Part 11 requires regulated firms to implement controls for software and systems involved in processing many forms of data as part of business operations and product development.
Enterprise data warehouses are used by the pharmaceutical and medical device industries for storing data covered by Part 11 (for example, Safety Data and Clinical Study project data). QuerySurge, the only test tool designed specifically for automating the testing of data warehouses and the ETL process, has been effective in testing data warehouses used by Part 11-governed companies. The purpose of QuerySurge is to assure that your warehouse is not populated with bad data.
In industry surveys, bad data has been found in every database and data warehouse studied and is estimated to cost firms on average $8.2 million annually, according to analyst firm Gartner. Most firms test far less than 10% of their data, leaving at risk the rest of the data they are using for critical audits and compliance reporting. QuerySurge can test up to 100% of your data and help assure your organization that this critical information is accurate.
QuerySurge not only helps in eliminating bad data, but is also designed to support Part 11 compliance.
Learn more at www.QuerySurge.com
Introduction to QuerySurge Webinar
Wednesday, April 29th 2020 @11am ET
Eric Smyth, Director of Alliances
Bill Hayduk, CEO
Matt Moss, Product Manager
This is the slide deck for our webinar. Learn how QuerySurge automates the data validation and testing of Big Data, Data Warehouses, Business Intelligence Reports and Enterprise Applications with full DevOps functionality for continuous testing.
---------------------------------------------------------------------------------
Objective
During this webinar, we demonstrate how QuerySurge solves the following challenges:
- Your need for data quality at speed
- How to automate your ETL testing process
- Your ability to test across your different data platforms
- How to integrate ETL testing into your DataOps pipeline
- How to analyze your data and pinpoint anomalies quickly
-------------------------------------------------------------------------------------
Who should view this?
- ETL Developers /Testers
- Data Architects / Analysts
- DBAs
- BI Developers / Analysts
- IT Architects
- Managers of Data, BI & Analytics groups: CTOs, Directors, Vice Presidents, Project Leads
And anyone else with an interest in the Data & Analytics space who is interested in an automation solution for data validation & testing while improving data quality.
2. Your Logo
Agenda
Introduction
Existing System
Limitations of Existing System
Proposed Solution
Project Scope
Block Diagram
Implementation
Technology
Hardware and Software Requirements
Features and Benefits
Future Enhancement
Data Explorer – A Data Profiling Tool
3. Your Logo
Introduction (1/2)
Data profiling is the process of examining the data available in an existing data source
(e.g. a database or a file) and collecting statistics and information about that data.
Data profiling is an analysis of the candidate data sources for a data warehouse to
clarify the structure, content, relationships and derivation rules of the data. Profiling
helps to understand anomalies and to assess data quality, but also to discover,
register, and assess enterprise metadata.
The purpose of data profiling is both to validate metadata when it is available and to
discover metadata when it is not.
The result of the analysis is used both strategically, to determine suitability of the
candidate source systems and give the basis for an early go/no-go decision, and
tactically, to identify problems for later solution design, and to level sponsors’
expectations.
Data Profiling
Data Explorer – A Data Profiling Tool
4. Your Logo
Introduction (2/2)
Find out whether existing data can easily be used for other purposes
Improve the ability to search the data by tagging it with keywords, descriptions, or
assigning it to a category
Give metrics on data quality, including whether the data conforms to particular
standards or patterns
Assess the risk involved in integrating data for new applications, including the
challenges of joins
Assess whether metadata accurately describes the actual values in the source
database
Understanding data challenges early in any data intensive project, so that late project
surprises are avoided. Finding data problems late in the project can lead to delays and
cost overruns.
Pourpose of Data Profiling
Data Explorer – A Data Profiling Tool
5. Your Logo
Existing System
Initially the data Profiling activities used to be done by writing complicated SQL queries
This would be comfortable for analyst or user who knows to write SQL queries
Many of us do not know the proper syntax and format for writing SQL queries
To overcome this, Data Profiling tools were introduced
Data Profiling Tools, to a some extent overcome the limitations for writing complex
queries
All types of profiling activities were not supported by the tools
User has to understand and learn how to use the tool
Data Explorer – A Data Profiling Tool
6. Your Logo
Limitations of Existing System
Development time is more.
Need to understand the functionality
for developing the queries.
Results needs to be exported to excel
or notepad for anlysis
Traditional Approach
Complex User Interface
Limited Functionality.
Setup and Installation.
License Cost.
Minimum Server Requirements
SQL Queries Existing Tools
Data Explorer – A Data Profiling Tool
7. Your Logo
Proposed Solution
Developing an Application performing all the types of profiling
Easy to use interface
Minimum system requirements
Feature to export the profiling results data to excel
Additional feature to indicate the Data Quality i.e. Data Quality Indicator
Supporting multiple Databases like Oracle 10g, Oracle 11g, MS SQL Server 2005, MS
SQL Server 2008, My SQL etc
Integrating Data Quality to correct erroneous, inconsistent and inaccurate data
Data Explorer – A Data Profiling Tool
8. Your Logo
Project Scope
Keeping the Time Line and other factors in mind, the project will currently support only
MS SQL Server
Also the project will have following types of Profiling:
Column Profiling
Empty Column Analysis
Null Rule Analysis
Constant Analysis
Frequency Analysis
Uniqueness Analysis
Primary/Composite Key Analysis
Integrating Data Quality
Data Explorer – A Data Profiling Tool
9. Your Logo
Architecture Diagram
Data Explorer – A Data Profiling Tool
Analysis Team ManagementBusiness Users
Data Explorer
Data
Profiling
Central
Metadata
Repository
Capture
Issues
and Notes
MS SQL Server Other Databases
Reporting
10. Your Logo
Implementation
The project will be implemented module wise.
Project will be having different modules. Each module will be developed individually
and Unit Tested
After completion of all the modules and unit testing, all the modules will be integrated
and System Integration Testing will be performed
There will be separate modules for Databases retrieval from server, Tables retrieval
after selecting a database, Columns retrieval after selecting a Table
There will be separate module for each type of profiling discussed.
Data Explorer – A Data Profiling Tool
11. Your Logo
Implementation - Profiling Details
Column Profiling
This will help in discovering total no of records, null percentage, unique
percentage, minimum and maximum value in the column, documented data type
etc.
Constant Analysis
This will help in discovering those columns which has less than 4 and greater than
0 distinct values.
Null Rule Analysis
This will help in finding all the columns in a table which has 100% NULL values
Data Explorer – A Data Profiling Tool
12. Your Logo
Implementation - Profiling Details
Unique Analysis
This will help in finding all the columns in table which has 100% uniqueness.
Primary Key / Composite Key Analysis
It will help us to find out the possible primary or composite key columns which can
be have unique combination.
Frequency Analysis
This will help in finding the no. of distinct values in the columns and the no. of time
the value is repeated in a column.
Data Explorer – A Data Profiling Tool
13. Your Logo
Implementation – Data Quality
Data Unification
Before Data Unification Profiling results
Data Explorer – A Data Profiling Tool
Column Column Value Count
Gender Male 50
M 10
His 5
male 60
Total 125
Column Column Value Count
Country USA 10
U.S.A 60
United States of America 2
US 20
Total 92
14. Your Logo
Implementation – Data Quality
Data Unification
After Data Unification Profiling results
Data Explorer – A Data Profiling Tool
Column Column Value Count
Gender Male 125
Column Column Value Count
Country U.S.A 92
15. Your Logo
Implementation – Data Quality
NULL Removal
Before Null Removal profiling results
Data Explorer – A Data Profiling Tool
Column Null %
Country 30
Column Column Value Count
Country India 50
U.S.A 20
NULL 30
Total 100
16. Your Logo
Implementation – Data Quality
NULL Removal
After Null Removal Profiling results
Data Explorer – A Data Profiling Tool
Column Null %
Country 0
Column Column Value Count
Country India 50
U.S.A 20
N.A. 30
Total 100
NULL value defaulted to N.A. (Not Available)
17. Your Logo
Technology
Data Explorer will be developed on .NET platform using C# as a coding language.
.NET is Microsoft platform for developing advanced and Robust applications
.NET supports a wide range of library classes which eases the development efforts
and hence more time can be utilized in other activities
.NET is called Language Independent Platform as it support 4 native languages and 21
non-native languages.
Native Languages are a Microsoft created languages i.e. C#. VB.Net. J#, VC++
Non-Native or Non Microsoft Languages supported are Pearl, Ruby on Rails etc
Data Explorer – A Data Profiling Tool
18. Your Logo
Hardware and Software Requirements
Data Explorer – A Data Profiling Tool
Data Explorer
• Pentium Core 2 Duo
processor or above
• 2 GB RAM
• 20 GB HDD
• Printer
• Router for Internet
Connection
• Windows 2000/
Windows XP/
Windows Vista/
Windows 7
• Microsoft .NET
Framework 3.5
• Microsoft Visual
Studio 2008
19. Your Logo
Features
Supports multiple databases like MS SQL Server, Oracle
Different types of profiling like
Column Profiling
Constant Analysis
Unique Analysis
Null Rule Analysis
Frequency Analysis
Empty Column Analysis
Primary / Composite Key Analysis
Quickly Analyze and validate data issues
Data Quality improvement
Data Explorer – A Data Profiling Tool
20. Your Logo
Benefits
Quick discovery of data issues
No more writing of queries to profile data
Time efficient
Shorten the implementation cycle of major projects
Improve understanding of data for the users
Discovering business knowledge
Improves data accuracy in corporate databases
Data Explorer – A Data Profiling Tool
21. Your Logo
Future Enhancement
Data Explorer can be further extended to support unstructured or semi-structured data
like flat files, .csv files
It can also be extended to support other relation data bases like MS Access, MySQL,
Sybase etc Time efficient
It can also be enhanced by including Data Quality reports on top of Data Quality
Results
There can be mechanism to store the profiling results so that it can be used or referred
later at any point of time
Data Explorer – A Data Profiling Tool