Download as PDF, PPTX

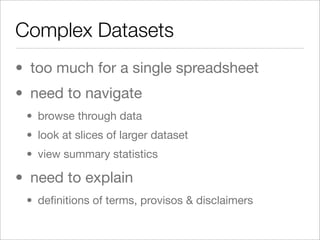


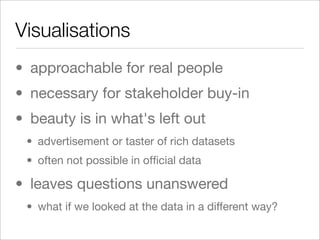
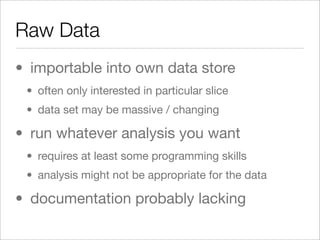


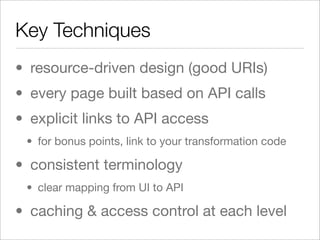


The document discusses the challenges and benefits of complex open data publishing, highlighting the need for a layered approach to accommodate various users with differing capabilities and goals. It emphasizes the importance of visualizations for engagement and the necessity of bridging gaps between raw data access and user-friendly representations. Key techniques include resource-driven design and providing clear links between user interfaces and APIs to enhance usability and understanding.


![[DSC Europe 23] Milos Solujic - Data Lakehouse Revolutionizing Data Managemen...](https://cdn.slidesharecdn.com/ss_thumbnails/xihnewjtu6mlbi5hbkoq-milos-solujic-data-lakehouse-revolutionizing-data-management-231129142742-90fb161d-thumbnail.jpg?width=640&height=640&fit=bounds)


