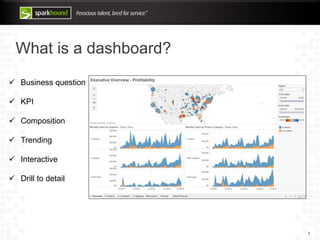
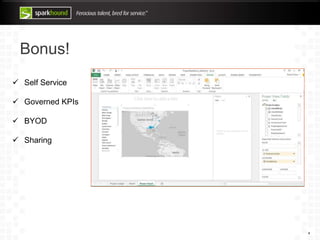
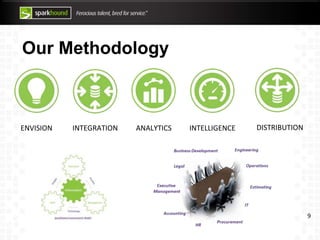
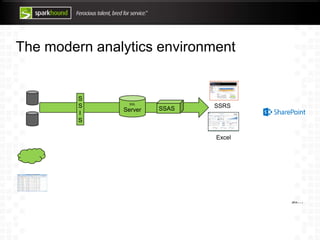
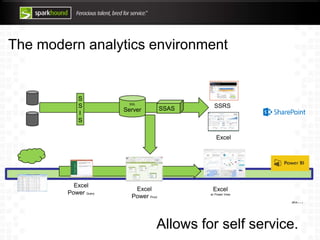
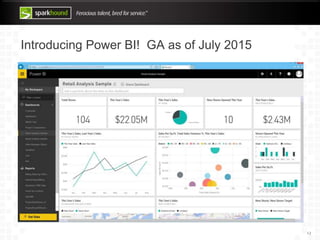
DASHBOARDS FOR EVERYONE
using Excel and Power BI
Rusty Frioux
Our Goals Today
1. What is a dashboard?
2. Why do they matter to our business?
3. How do we build them?
4. I CAN DO THIS NOW with Excel and Power BI!
2
What is a dashboard?
3
 Business question
 KPI
 Composition
 Trending
 Interactive
 Drill to detail
Bonus!
4
 Self Service
 Governed KPIs
 BYOD
 Sharing
Type: Departmental
5
 Business question
 KPI
 Composition
 Trending
 Interactive
 Drill to detail
Type: Corporate
6
 Business question
 KPI
 Composition
 Trending
 Interactive
 Drill to detail
Type: Tactical
7
 Business question
 KPI
 Composition
 Trending
 Interactive
 Drill to detail
Patrick’s Rules for Scorecards
8
 Rule 1: Is it simple?
 Rule 2: Can I see it easily?
 Rule 3: Does it show lead and lag measures?
 Rule 4: Can I tell if I am winning or losing?
 Rule 5: Is there a player and coaches scorecard?
Our Methodology
9
ENVISION INTEGRATION ANALYTICS INTELLIGENCE DISTRIBUTION
The modern analytics environment
SSAS
SQL
Server
S
S
I
S
SSRS
Excel
plus…
The modern analytics environment
SSAS
SQL
Server
S
S
I
S
SSRS
Excel
Excel
Power Pivot
Excel
Power Query
Excel
w/ Power View
plus…
Allows for self service.
Introducing Power BI! GA as of July 2015
12
DEMO TIME
(enough talking … .let’s build something)
13
14

Dashboards for Everyone with Microsoft Power BI & Excel

Editor's Notes

  • #10 Early Wins, Small Bites Strategy first - Business goals + metrics + burning business questions. Data second - Are we tracking the things? Finance, Workforce, Sales, Ops Technology third - Start with high ROI, small bite projects. Bring together the *right* data. Seek guidance from the right algorithms. Tell your story with the right visualization. Distribute to the right people. Take action. 4. Next project