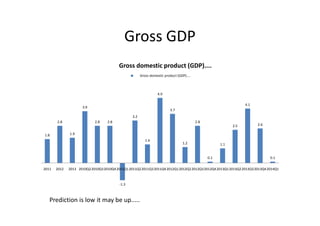
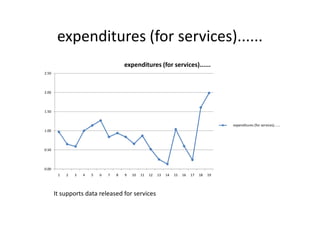
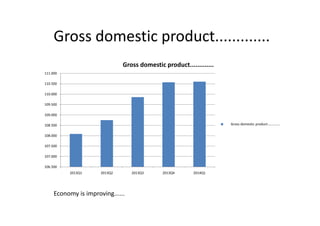
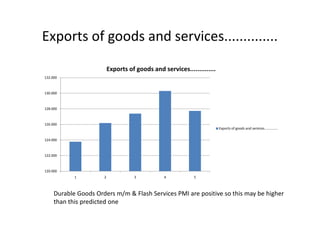
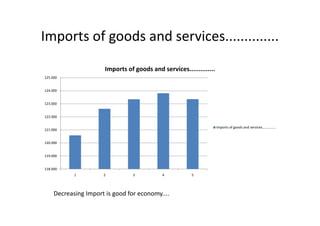
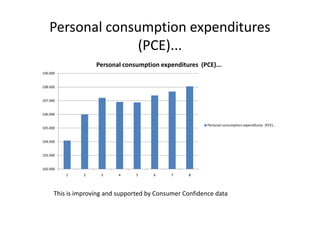
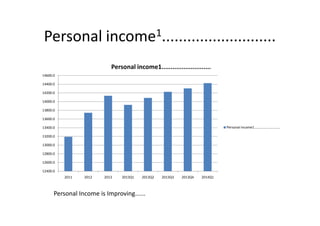
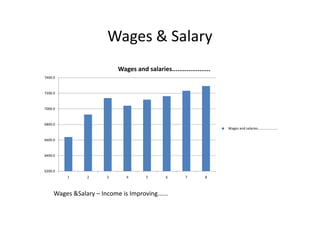
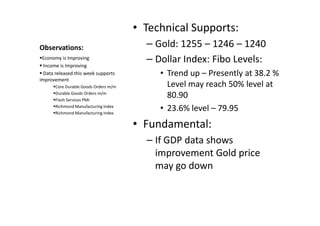
US Economy – Prelim GDP q/q
Source : National Income and Product Accounts
Gross Domestic Product: First Quarter 2014 (advance
estimate)
By Bharat Pandya
bharat@brichmoney.com
Cell: 91 9624044866
Gross GDP
3.9
4.9
3.7
4.1
Gross domestic product (GDP)....
1.8
2.8
1.9
2.8 2.8
-1.3
3.2
1.4
1.2
2.8
0.1
1.1
2.5 2.6
0.1
2011 2012 2013 2010Q22010Q32010Q42011Q12011Q22011Q32011Q42012Q12012Q22012Q32012Q42013Q12013Q22013Q32013Q42014Q1
Prediction is low it may be up.....
Net exports of goods and services......
10.0
15.0
20.0
25.0
30.0
AxisTitle
Exports..............................
Goods..............................
Services...........................
-15.0
-10.0
-5.0
0.0
5.0
1 2 3 4 5 6 7 8 9 10 11 12 13 14 15 16 17 18 19
AxisTitle
Axis Title
Imports..............................
Goods..............................
Services...........................
Goods & Service data released are better than this prediction
Government consumption
expenditures
-5.0
0.0
5.0
10.0
15.0
1 2 3 4 5 6 7 8 9 10 11 12 13 14 15 16 17 18 19 Federal..............................
National defense...................
-25.0
-20.0
-15.0
-10.0
-5.0 National defense...................
Nondefense.........................
Final sales of domestic product....
Gross domestic purchases...........
4.0
5.0
6.0
7.0
0.0
1.0
2.0
3.0
1 2 3 4 5 6 7 8 9 10 11 12 13 14 15 16 17 18 19
Final sales of domestic product....
Gross domestic purchases...........
CB Consumer Confidence data released is flat so this should not be so negative
see column 19
expenditures (for services)......
1.50
2.00
2.50
expenditures (for services)......
0.00
0.50
1.00
1.50
1 2 3 4 5 6 7 8 9 10 11 12 13 14 15 16 17 18 19
expenditures (for services)......
It supports data released for services
Gross domestic product.............
109.000
109.500
110.000
110.500
111.000
Gross domestic product.............
106.500
107.000
107.500
108.000
108.500
109.000
2013Q1 2013Q2 2013Q3 2013Q4 2014Q1
Gross domestic product.............
Economy is improving......
Exports of goods and services..............
128.000
130.000
132.000
Exports of goods and services..............
Durable Goods Orders m/m & Flash Services PMI are positive so this may be higher
than this predicted one
120.000
122.000
124.000
126.000
1 2 3 4 5
Exports of goods and services..............
Imports of goods and services..............
123.000
124.000
125.000
Imports of goods and services..............
Decreasing Import is good for economy....
118.000
119.000
120.000
121.000
122.000
1 2 3 4 5
Imports of goods and services..............
Personal consumption expenditures
(PCE)...
106.000
107.000
108.000
109.000
Personal consumption expenditures (PCE)...
This is improving and supported by Consumer Confidence data
102.000
103.000
104.000
105.000
106.000
1 2 3 4 5 6 7 8
Personal consumption expenditures (PCE)...
Personal income1...........................
13800.0
14000.0
14200.0
14400.0
14600.0
Personal income1...........................
Personal Income is Improving......
12400.0
12600.0
12800.0
13000.0
13200.0
13400.0
13600.0
2011 2012 2013 2013Q1 2013Q2 2013Q3 2013Q4 2014Q1
Personal income1...........................
Wages & Salary
7000.0
7200.0
7400.0
Wages and salaries.....................
6200.0
6400.0
6600.0
6800.0
1 2 3 4 5 6 7 8
Wages and salaries.....................
Wages &Salary – Income is Improving......
Observations:
• Technical Supports:
– Gold: 1255 – 1246 – 1240
– Dollar Index: Fibo Levels:
• Trend up – Presently at 38.2 %
Level may reach 50% level at
80.90
• 23.6% level – 79.95
Economy is Improving
Income is Improving
Data released this week supports
improvement
Core Durable Goods Orders m/m
Durable Goods Orders m/m
Flash Services PMI
Richmond Manufacturing Index
23.6% level – 79.95
• Fundamental:
– If GDP data shows
improvement Gold price
may go down
Richmond Manufacturing Index

Us economy

  • 1.
    US Economy –Prelim GDP q/q Source : National Income and Product Accounts Gross Domestic Product: First Quarter 2014 (advance estimate) By Bharat Pandya bharat@brichmoney.com Cell: 91 9624044866
  • 2.
    Gross GDP 3.9 4.9 3.7 4.1 Gross domesticproduct (GDP).... Gross domestic product (GDP).... 1.8 2.8 1.9 2.8 2.8 -1.3 3.2 1.4 1.2 2.8 0.1 1.1 2.5 2.6 0.1 2011 2012 2013 2010Q22010Q32010Q42011Q12011Q22011Q32011Q42012Q12012Q22012Q32012Q42013Q12013Q22013Q32013Q42014Q1 Prediction is low it may be up.....
  • 3.
    Net exports ofgoods and services...... 10.0 15.0 20.0 25.0 30.0 AxisTitle Exports.............................. Goods.............................. Services........................... -15.0 -10.0 -5.0 0.0 5.0 1 2 3 4 5 6 7 8 9 10 11 12 13 14 15 16 17 18 19 AxisTitle Axis Title Imports.............................. Goods.............................. Services........................... Goods & Service data released are better than this prediction
  • 4.
    Government consumption expenditures -5.0 0.0 5.0 10.0 15.0 1 23 4 5 6 7 8 9 10 11 12 13 14 15 16 17 18 19 Federal.............................. National defense................... -25.0 -20.0 -15.0 -10.0 -5.0 National defense................... Nondefense.........................
  • 5.
    Final sales ofdomestic product.... Gross domestic purchases........... 4.0 5.0 6.0 7.0 0.0 1.0 2.0 3.0 1 2 3 4 5 6 7 8 9 10 11 12 13 14 15 16 17 18 19 Final sales of domestic product.... Gross domestic purchases........... CB Consumer Confidence data released is flat so this should not be so negative see column 19
  • 6.
    expenditures (for services)...... 1.50 2.00 2.50 expenditures(for services)...... 0.00 0.50 1.00 1.50 1 2 3 4 5 6 7 8 9 10 11 12 13 14 15 16 17 18 19 expenditures (for services)...... It supports data released for services
  • 7.
    Gross domestic product............. 109.000 109.500 110.000 110.500 111.000 Grossdomestic product............. 106.500 107.000 107.500 108.000 108.500 109.000 2013Q1 2013Q2 2013Q3 2013Q4 2014Q1 Gross domestic product............. Economy is improving......
  • 8.
    Exports of goodsand services.............. 128.000 130.000 132.000 Exports of goods and services.............. Durable Goods Orders m/m & Flash Services PMI are positive so this may be higher than this predicted one 120.000 122.000 124.000 126.000 1 2 3 4 5 Exports of goods and services..............
  • 9.
    Imports of goodsand services.............. 123.000 124.000 125.000 Imports of goods and services.............. Decreasing Import is good for economy.... 118.000 119.000 120.000 121.000 122.000 1 2 3 4 5 Imports of goods and services..............
  • 10.
    Personal consumption expenditures (PCE)... 106.000 107.000 108.000 109.000 Personalconsumption expenditures (PCE)... This is improving and supported by Consumer Confidence data 102.000 103.000 104.000 105.000 106.000 1 2 3 4 5 6 7 8 Personal consumption expenditures (PCE)...
  • 11.
    Personal income1........................... 13800.0 14000.0 14200.0 14400.0 14600.0 Personal income1........................... PersonalIncome is Improving...... 12400.0 12600.0 12800.0 13000.0 13200.0 13400.0 13600.0 2011 2012 2013 2013Q1 2013Q2 2013Q3 2013Q4 2014Q1 Personal income1...........................
  • 12.
    Wages & Salary 7000.0 7200.0 7400.0 Wagesand salaries..................... 6200.0 6400.0 6600.0 6800.0 1 2 3 4 5 6 7 8 Wages and salaries..................... Wages &Salary – Income is Improving......
  • 13.
    Observations: • Technical Supports: –Gold: 1255 – 1246 – 1240 – Dollar Index: Fibo Levels: • Trend up – Presently at 38.2 % Level may reach 50% level at 80.90 • 23.6% level – 79.95 Economy is Improving Income is Improving Data released this week supports improvement Core Durable Goods Orders m/m Durable Goods Orders m/m Flash Services PMI Richmond Manufacturing Index Richmond Manufacturing Index 23.6% level – 79.95 • Fundamental: – If GDP data shows improvement Gold price may go down Richmond Manufacturing Index