Download to read offline
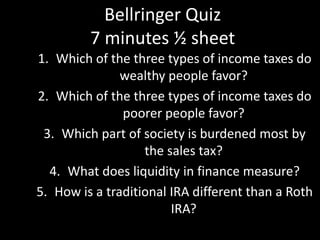
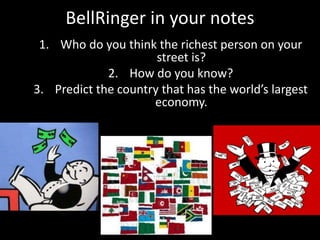
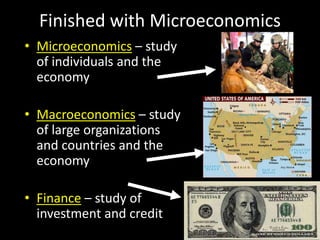
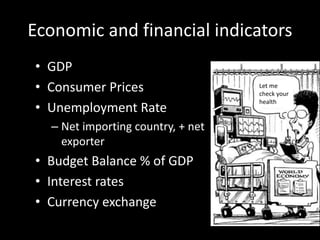
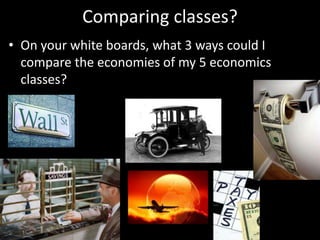
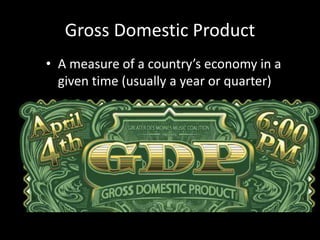
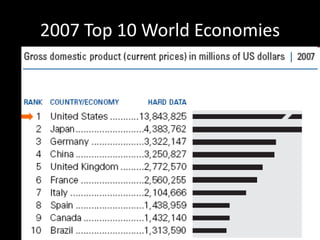
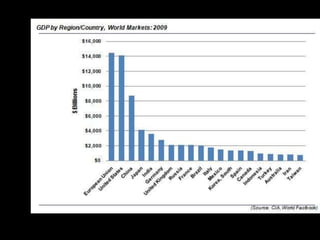
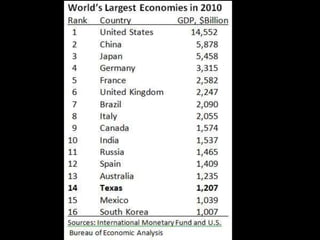
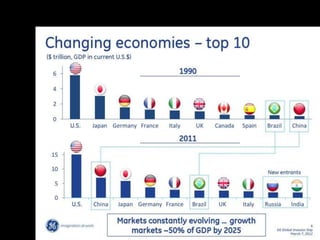
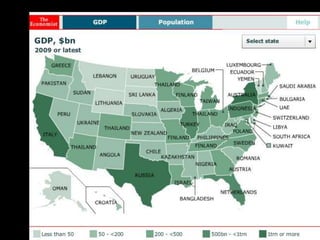
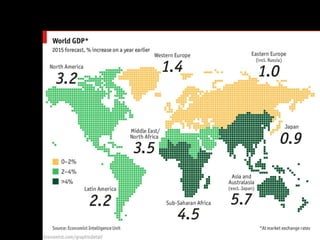
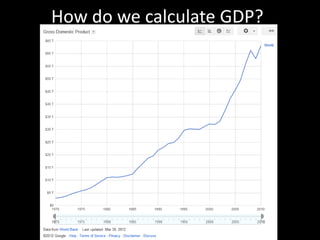
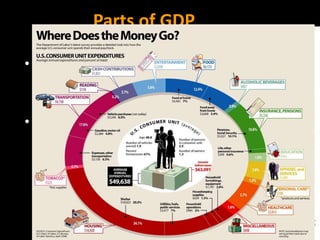
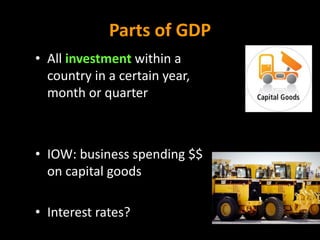


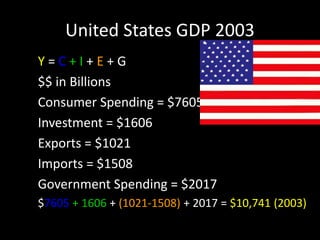


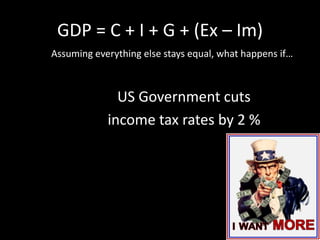

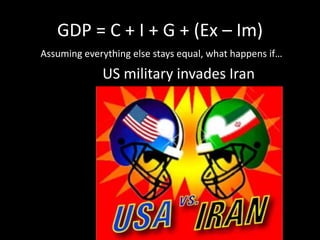
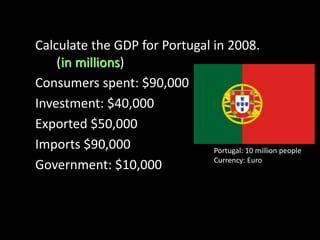
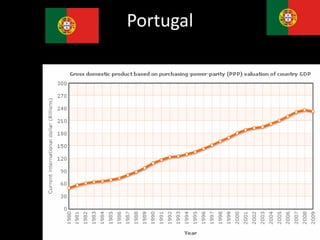
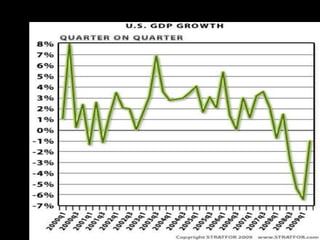
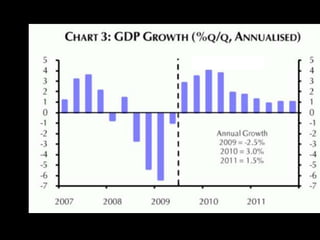
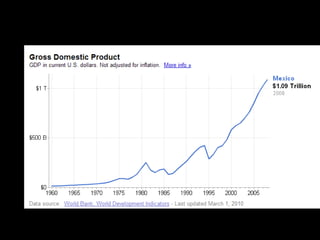
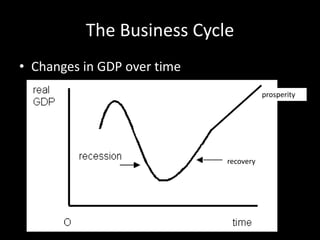
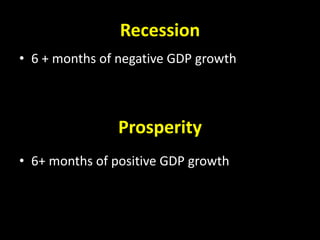
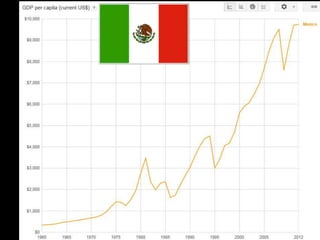
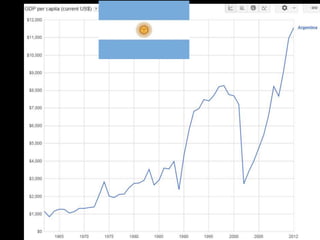
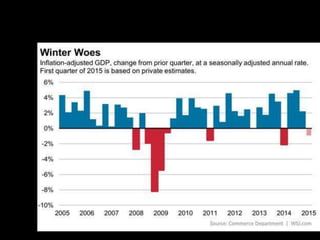
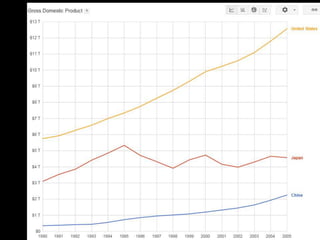
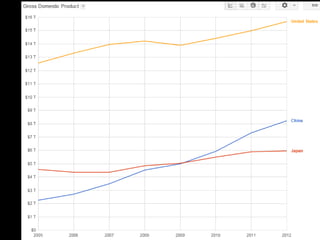
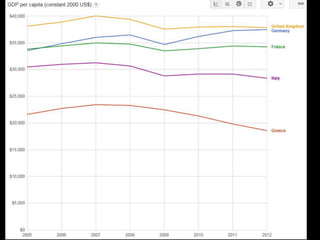
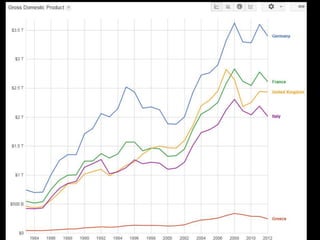
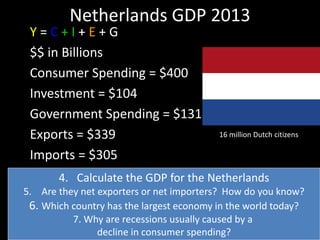
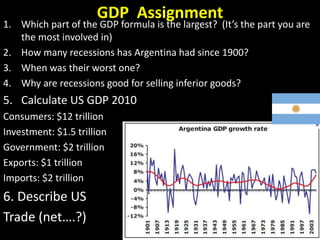
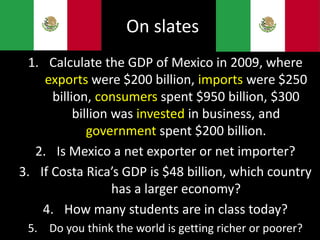
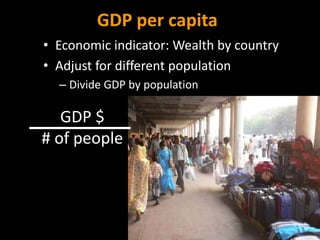
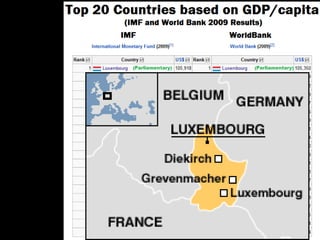
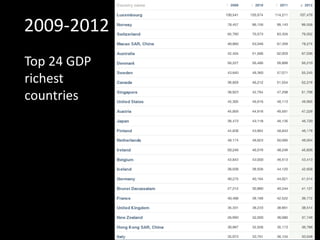
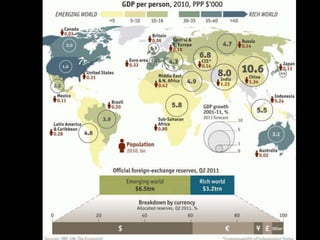
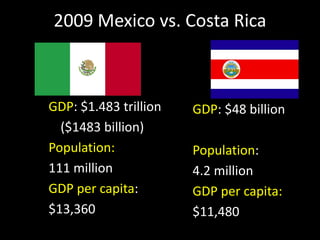
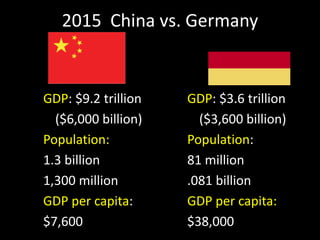


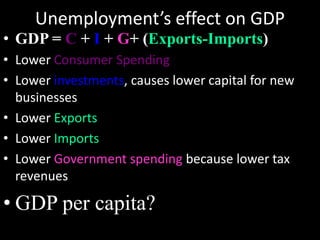


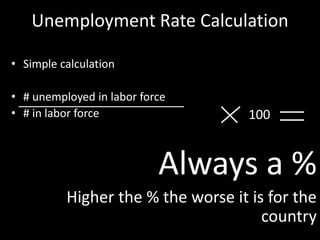


This document provides a bellringer quiz and lesson on economics topics such as GDP, types of taxes, unemployment rates, and economic indicators. It begins with a 7 minute bellringer quiz asking questions about income taxes, sales tax, liquidity, IRAs, richest person on the street, and predicting the largest economy. It then discusses microeconomics, macroeconomics, finance, and economic indicators like GDP, consumer prices, unemployment rate, budget balance, interest rates, and currency exchange. Several examples are provided to explain GDP calculation and components. The document concludes with assignments analyzing countries' GDP, GDP per capita, and The Economist economic indicators.