Downloaded 39 times

![Deloitte. PO Sox 96S
Marina
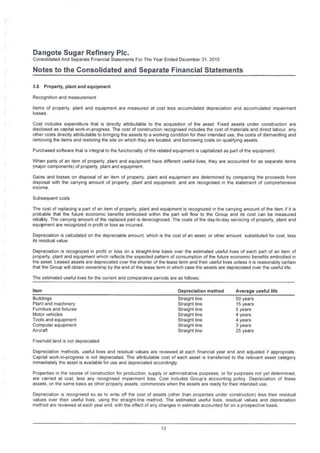
Lagos
Nigeria
Akintola Williams Deloitte
235 Ikorodu Road
llupe]u
Lagos
Nigeria
Tel; -234 (1) 271 7800
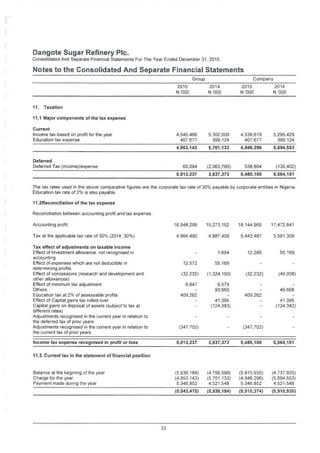
fax: -234 (1)271 7801
www.deloilte.com/ng
REPORT OF THE INDEPENDENT AUDITOR TO THE MEMBERS OF
DANGOTE SUGAR REFINERY PLC
We have audited the accompanying financial statements of Dangote Sugar Refinery Pic (“the Company”) and its subsidiary
(together referred to as the Group) which comprise the consolidated and separate statements of financial position as at 31
December 2015, the consolidated income statement, statement of changes in equity, statement of cash flows for the year then
ended 31 December 2015, a summary of significant accounting policies and other explanatory information.
Directors’ Responsibility for the Financial Statements
The Directors are responsible for the preparation and fair presentation of these financial statements in accordance with the
Companies and Allied Matters Act, CAP C20, LFN 2004, Financial Reporting Council of Nigeria Act 2011, the International
Financial Reeporting Standards and for such internal control as the Directors determine are necessary to enable the preparation
of financial statements that are free from material misstatements, whether due to fraud or error.
Auditors’ Responsibility
Our responsibility is to express an opinion on these financial statements based on our audit. We conducted our audit in accordance
with International Standards on Auditing. Those standards require that we comply with ethical requirements and plan and perform
the audit to obtain reasonable assurance about whether the financial statements are free from material misstatement.
An audit involves performing procedures to obtain audit evidence about the amounts and disclosures in the financial statements.
The procedures selected depend on the auditors’ judgement, including the assessment of the risks of material misstatement of
the financial statements, whether due to fraud or error. In making those risk assessments, the auditors consider internal control
relevant to the entity's preparation and fair presentation of the financial statements in order to design audit procedures that are
appropriate in the circumstances, but not for the purpose of expressing an opinion on the effectiveness of the entity's internal
control. An audit also includes evaluating the appropriateness of accounting policies used and the reasonableness of accounting
estimates made by the Directors, as well as evaluating the overall presentation of the financial statements.
We believe that the audit evidence we have obtained is sufficient and appropriate to provide a basis for our audit opinion.
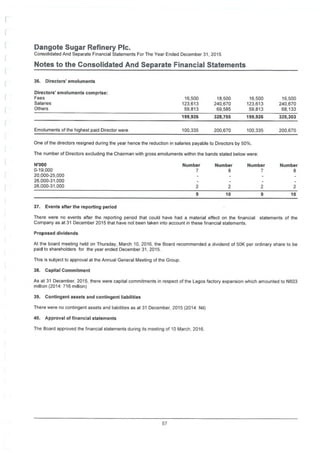
Opinion
In our opinion, the financial statements give a true and fair view of the financial position of Dangote Sugar Refinery Pic and its
subsidiaries as at 31 December 2015 and of its financial performance and cash flows for the year ended 31 December 2015 in
accordance with the Companies and Allied Matters Act CAP C20 LFN 2004 and the Financial Reporting Council of Nigeria Act,
2011 and the International Financial Reporting Standards.
Other reporting responsibilities
In accordance with the Sixth Schedule of Companies and Allied Matters Act CAP C20 LFN 2004, we expressly state that:
We have obtained all the information and explanation which to the best of our knowledge and believe were necessary for
the purpose of our audit.
i)
The Group has kept proper books of account, so far as appears from our examination of those books.ii)
iii) The Group’s financial position and its statement of profit or loss and other comprehensive income are in agreement with
the books of account.
Jelili Adebisi- FRC/2013/ICAN/000000004247
For: Akintola Williams Deloitte
Chartered Accountants
Lagos, Nigeria
/tt March 2016 St9«0
List of partners and partner equivalents available on the website
Associate of Deloitte Africa, a Member of Deloitte Touche Tohmatsu Limited](https://image.slidesharecdn.com/dangotesugarannualreport2015-170222135458/85/Dangote-sugar-annual-report-2015-5-320.jpg)
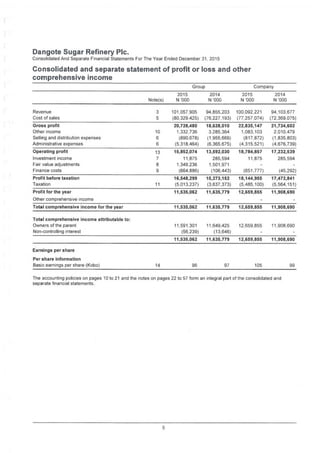
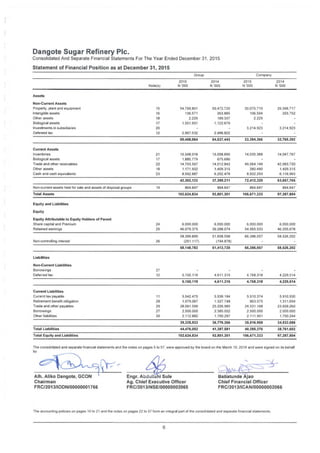
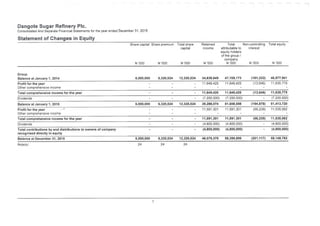
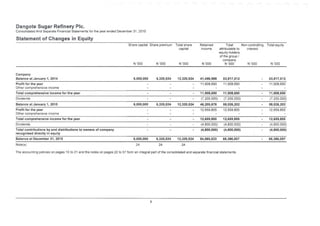
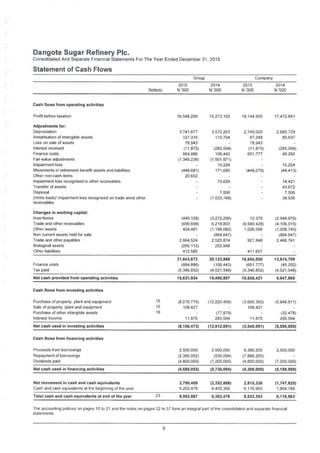
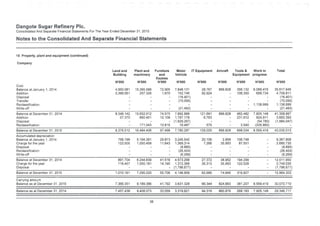
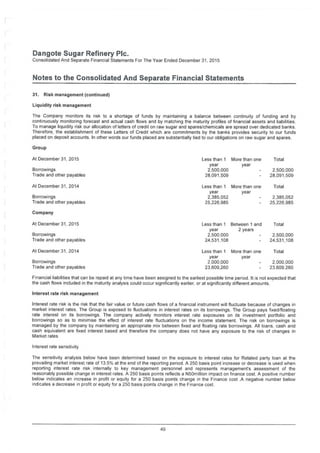
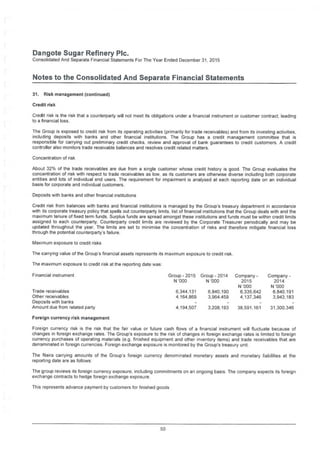
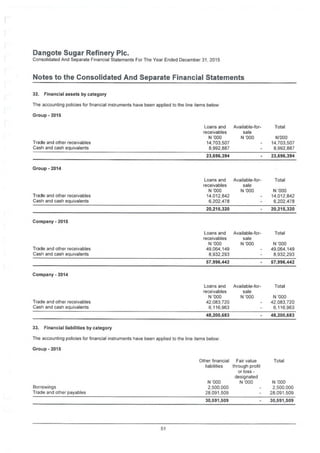
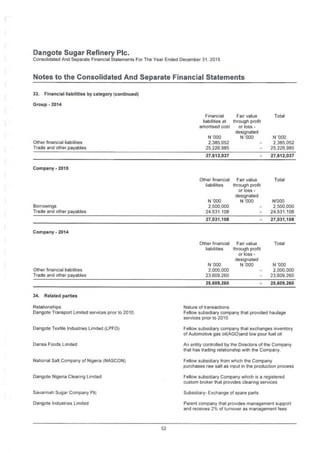
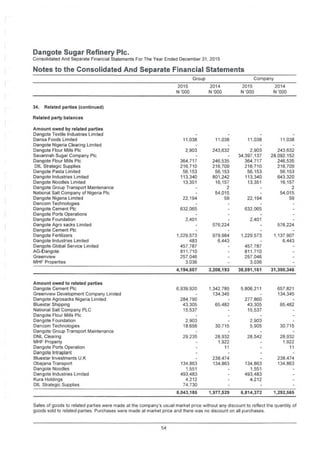
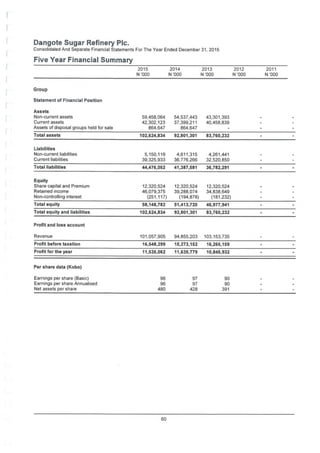
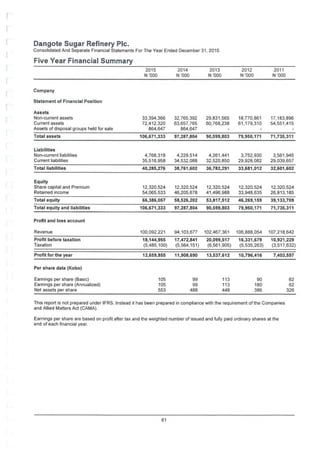

The document provides financial information for Dangote Sugar Refinery PLC for the year ended December 31, 2015. It includes the directors' responsibilities, independent auditor's report, consolidated and separate statements of profit or loss and other comprehensive income, financial position, changes in equity, and cash flows. The directors approved the financial statements on March 10, 2016. Key details include total revenue of N101 billion, profit for the year of N11.5 billion, total assets of N102.6 billion, and total equity of N58.1 billion.


![[ls머트리얼즈]LS Materials 417200 Algorithm Investment Report](https://cdn.slidesharecdn.com/ss_thumbnails/lsmaterials417200algorithminvestmentreport-260202182715-66072c7b-thumbnail.jpg?width=640&height=640&fit=bounds)


