Download to read offline
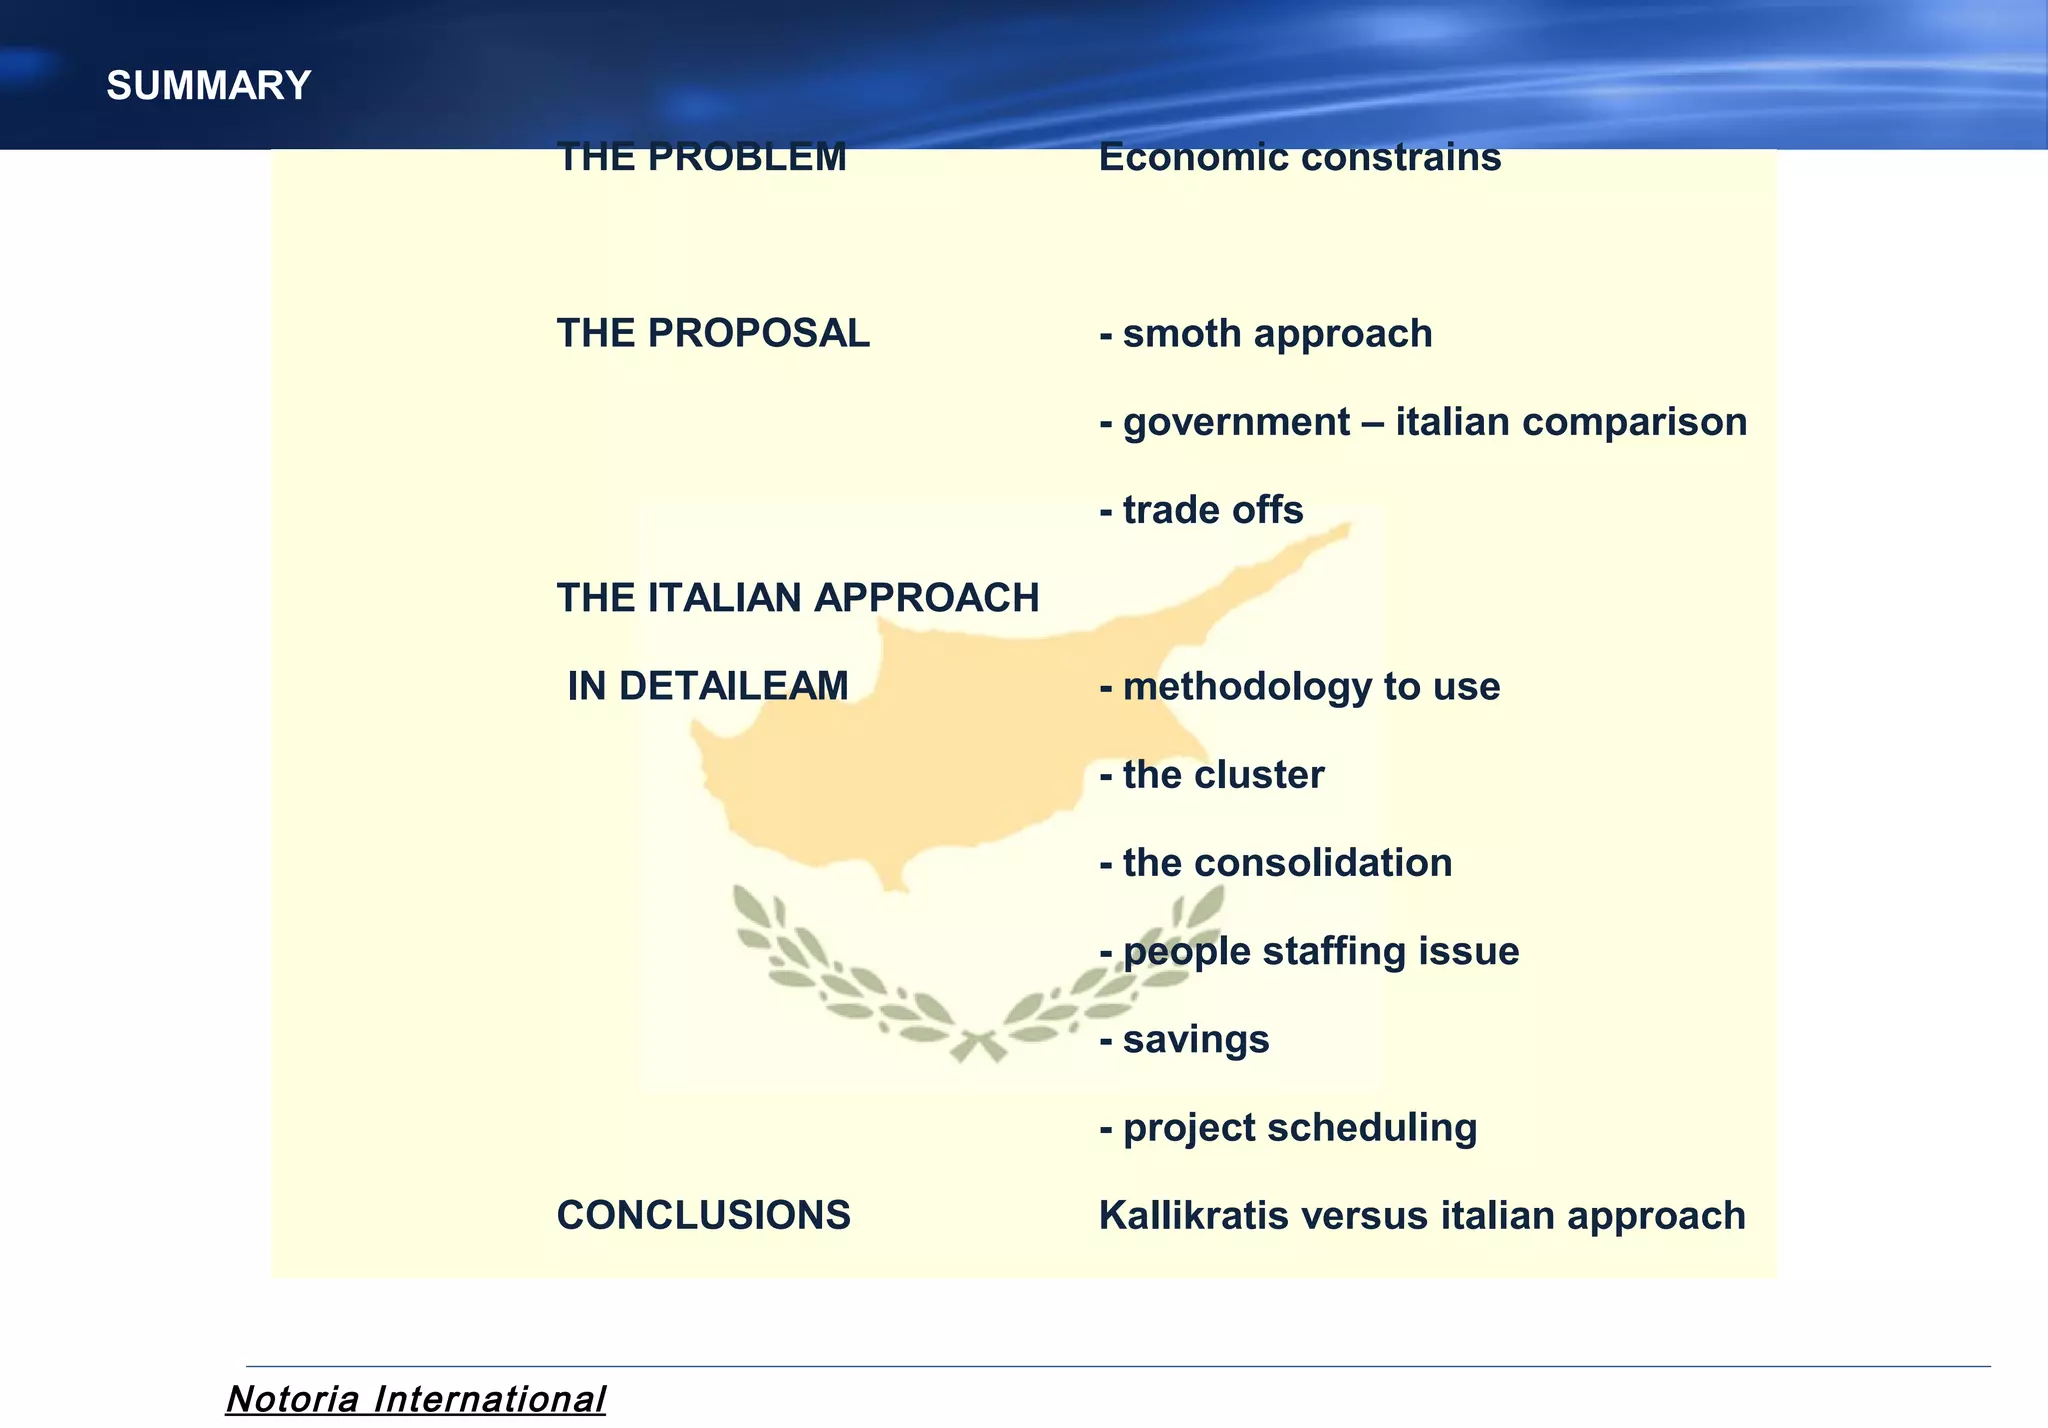
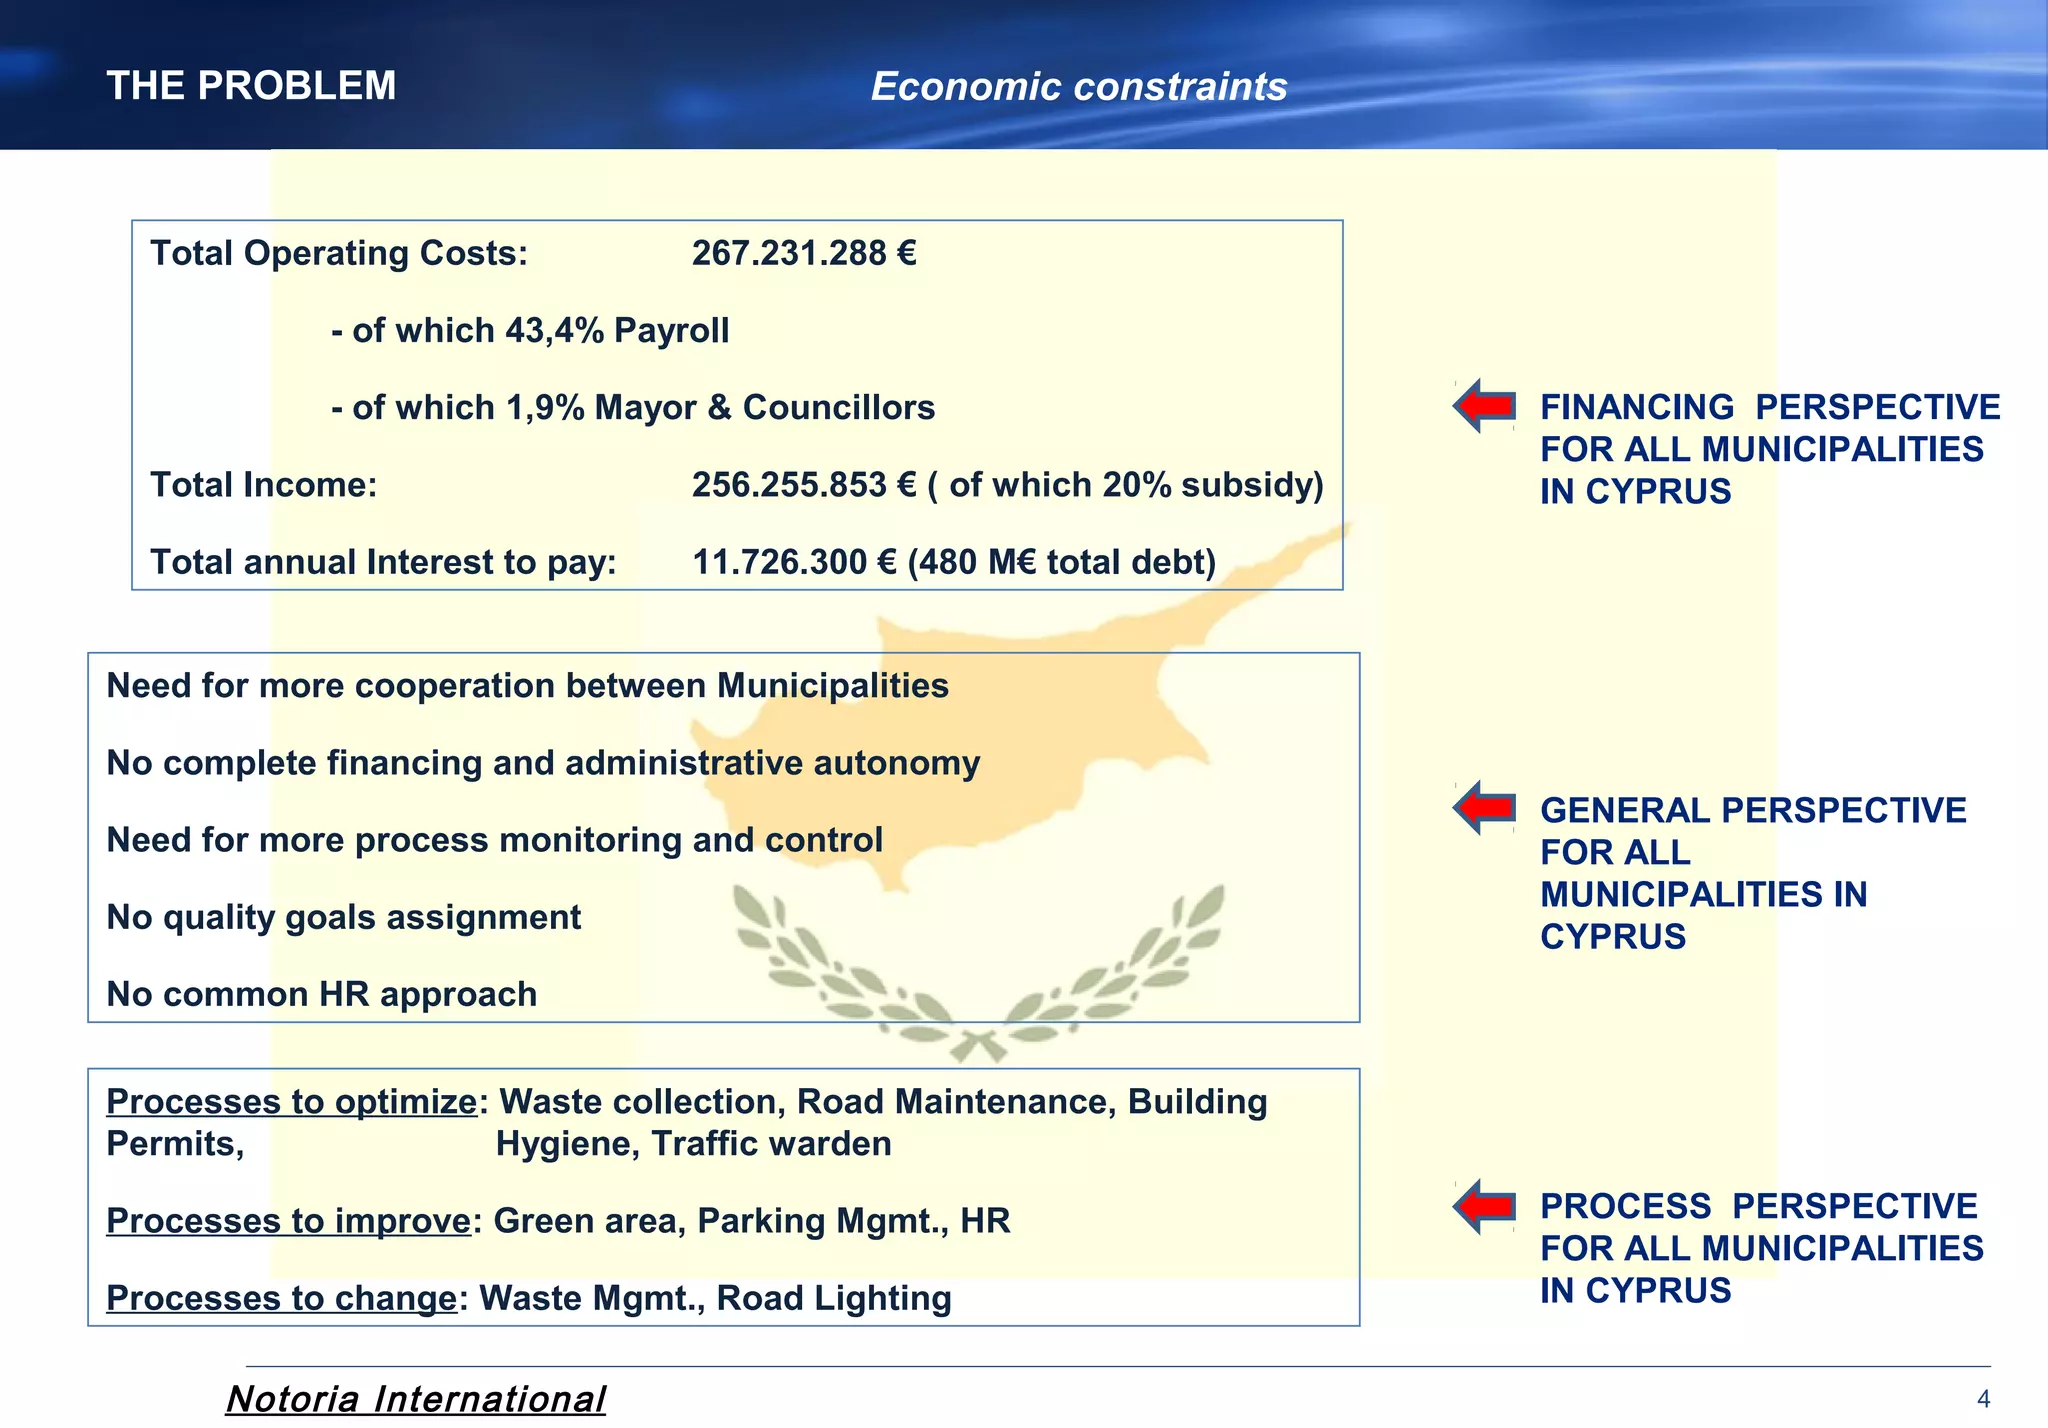

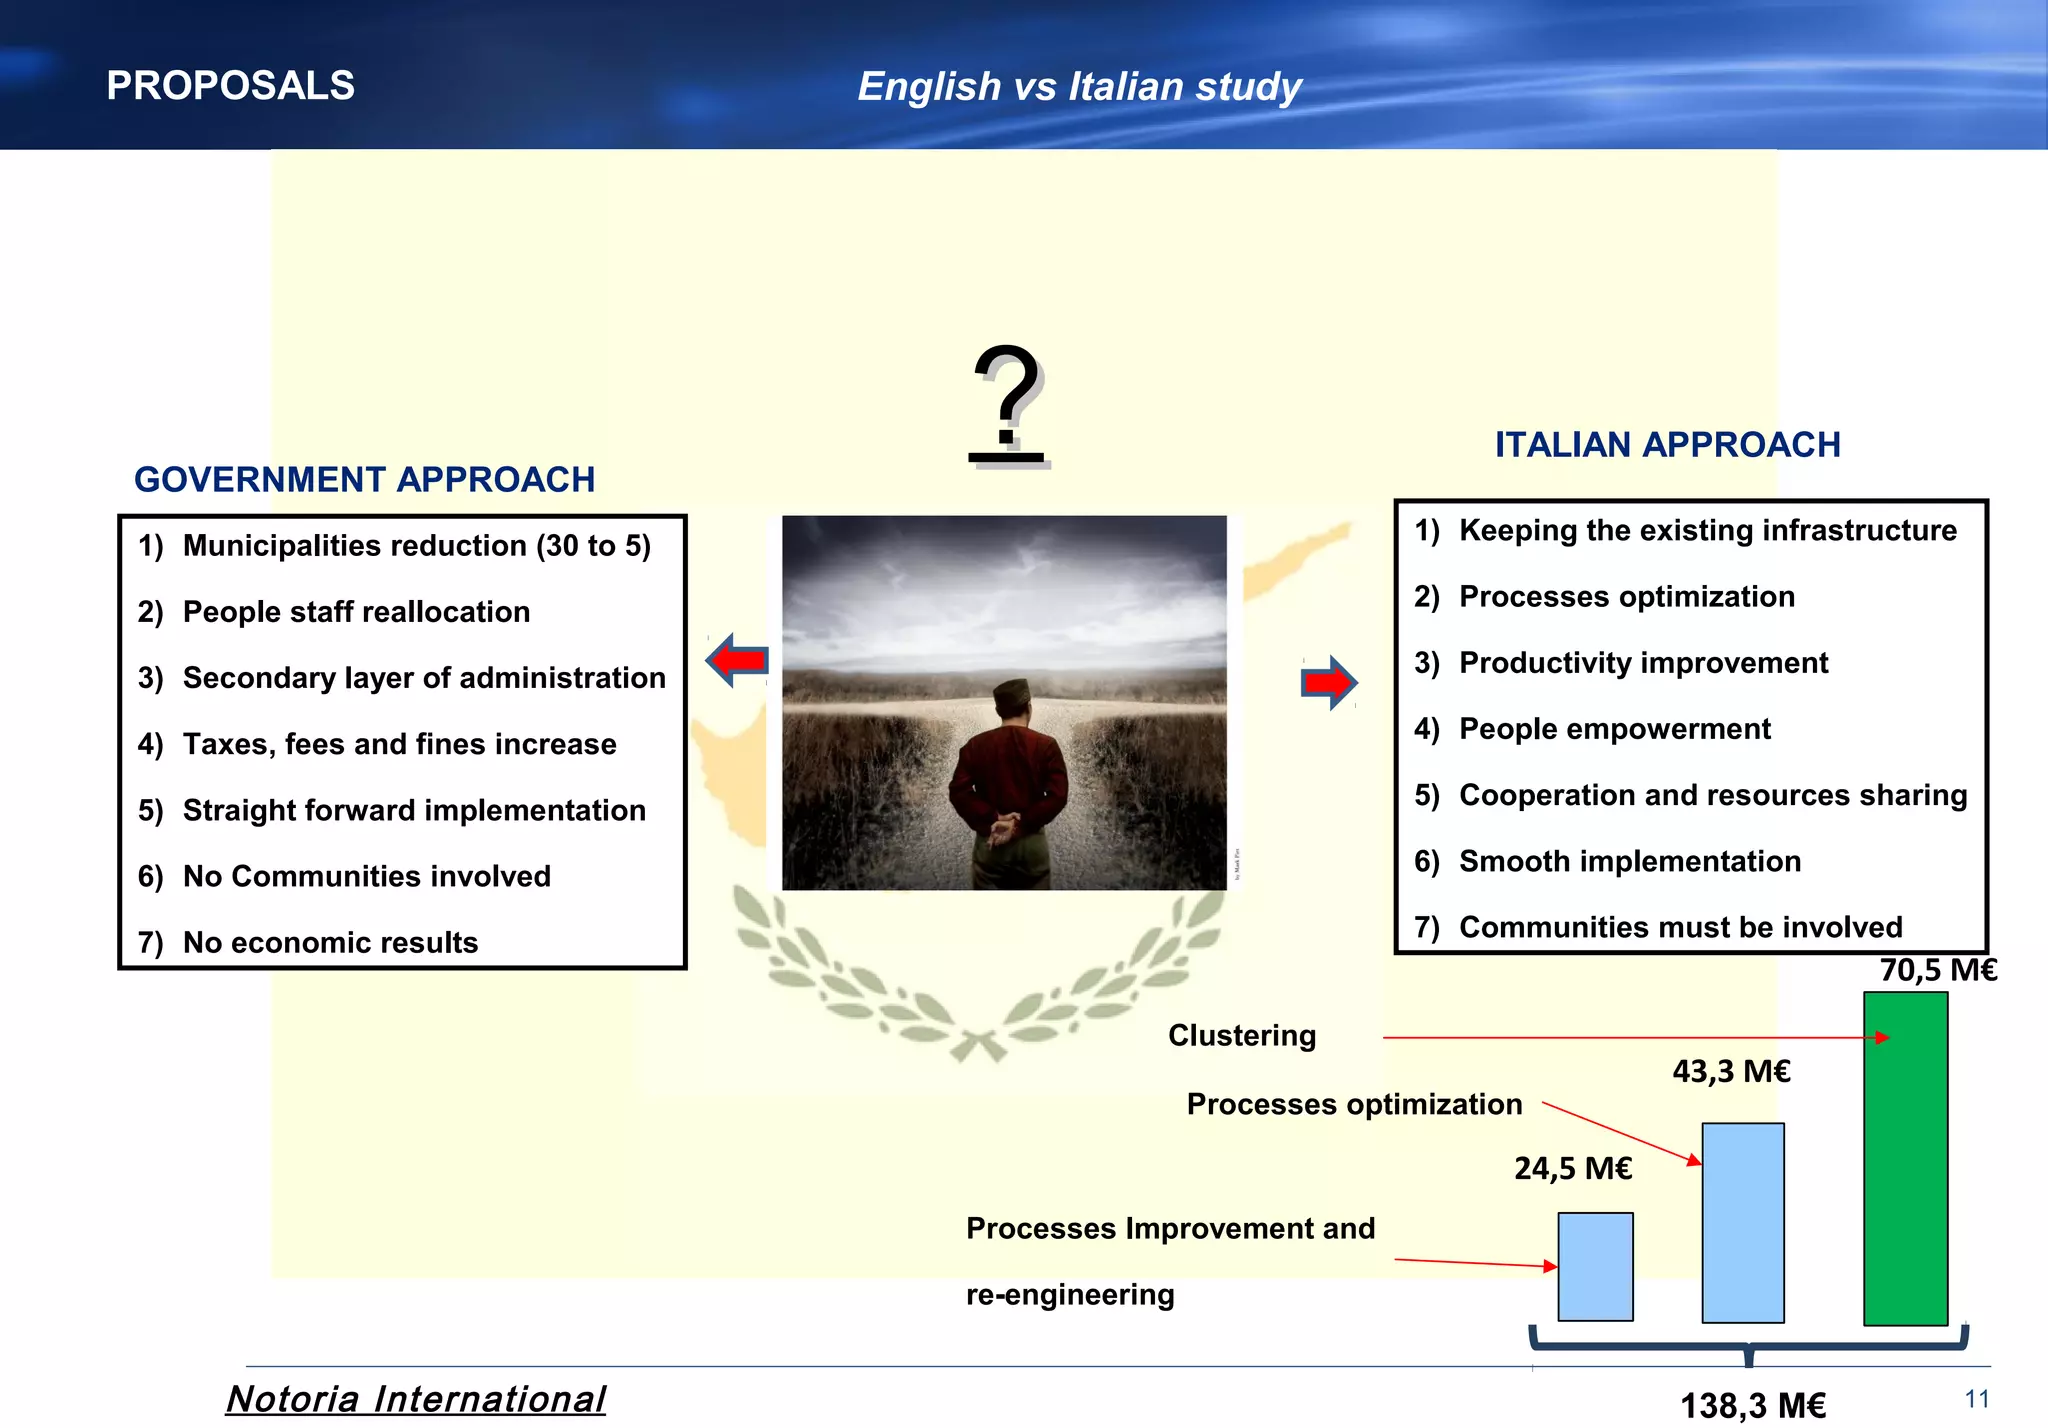
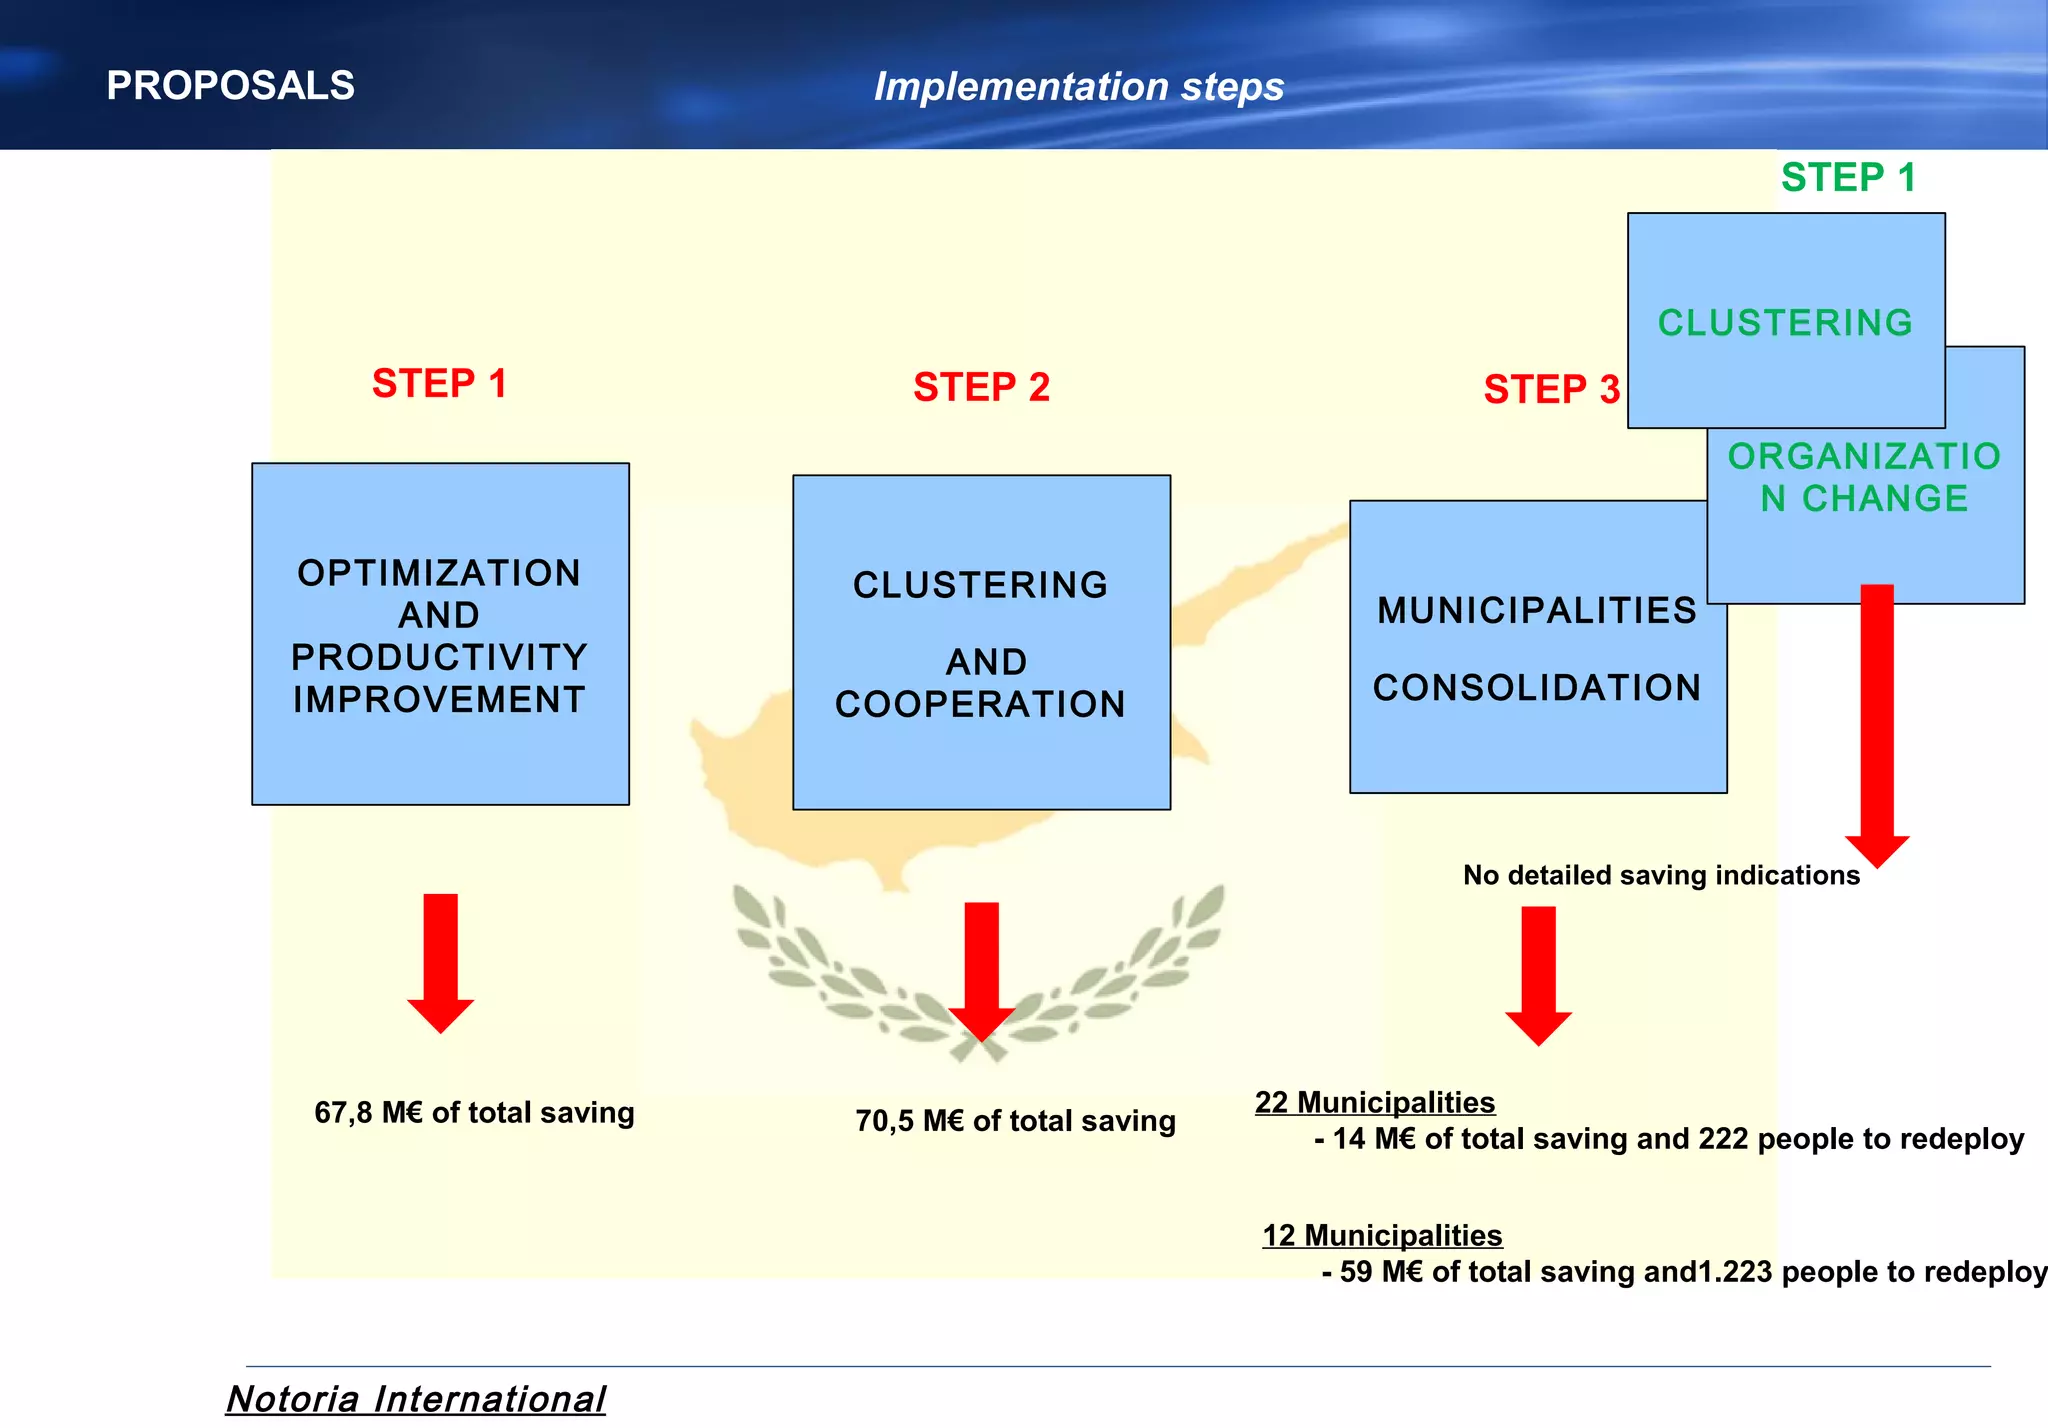
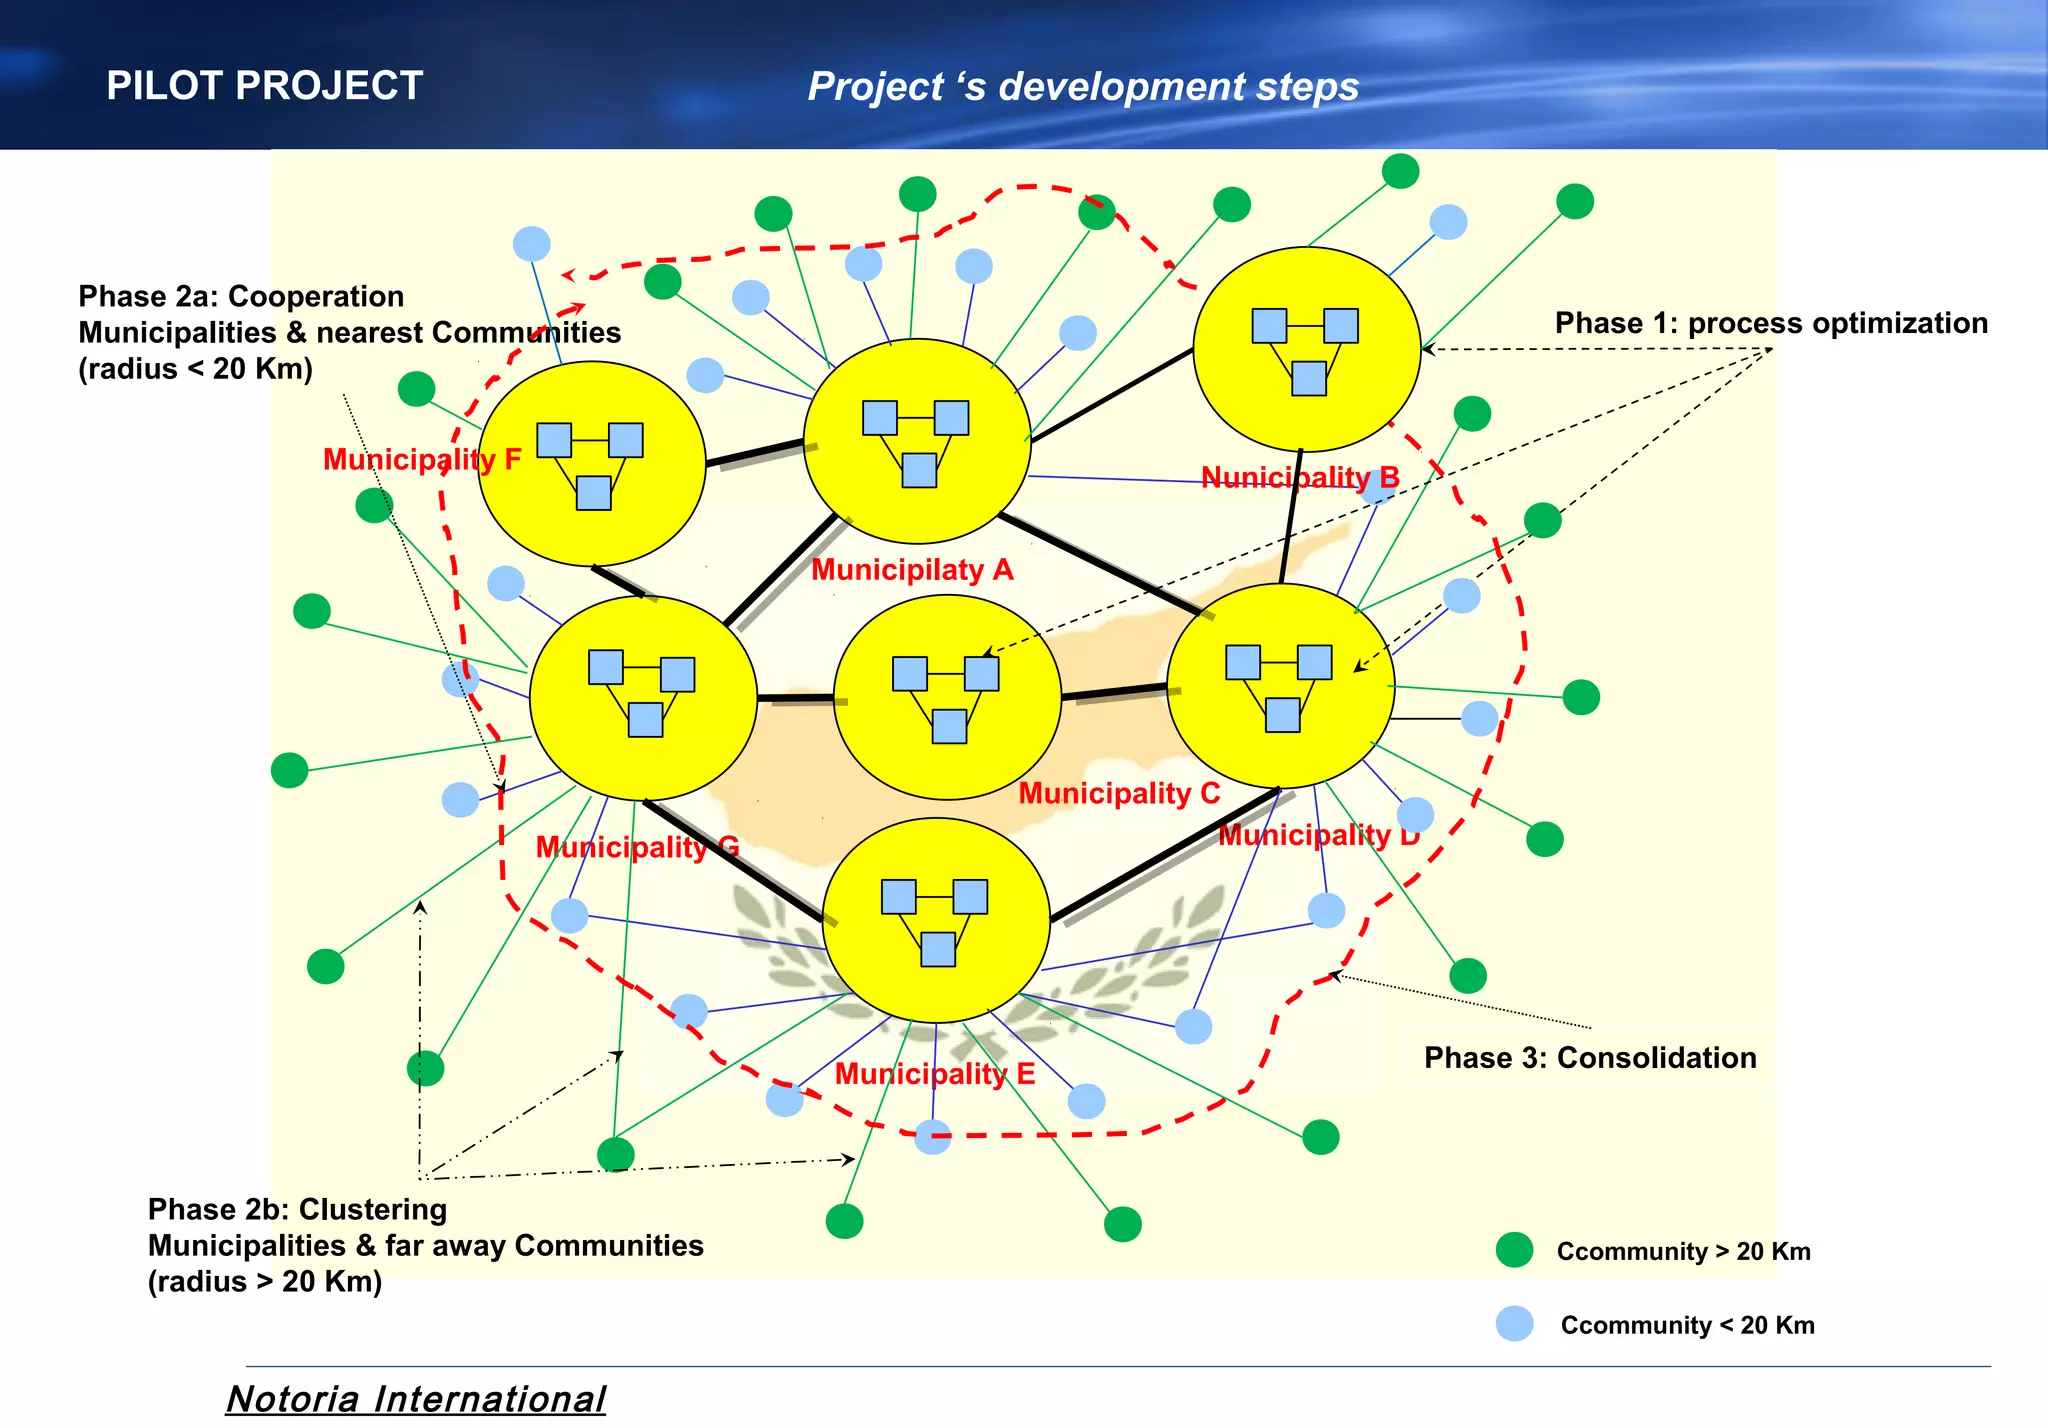
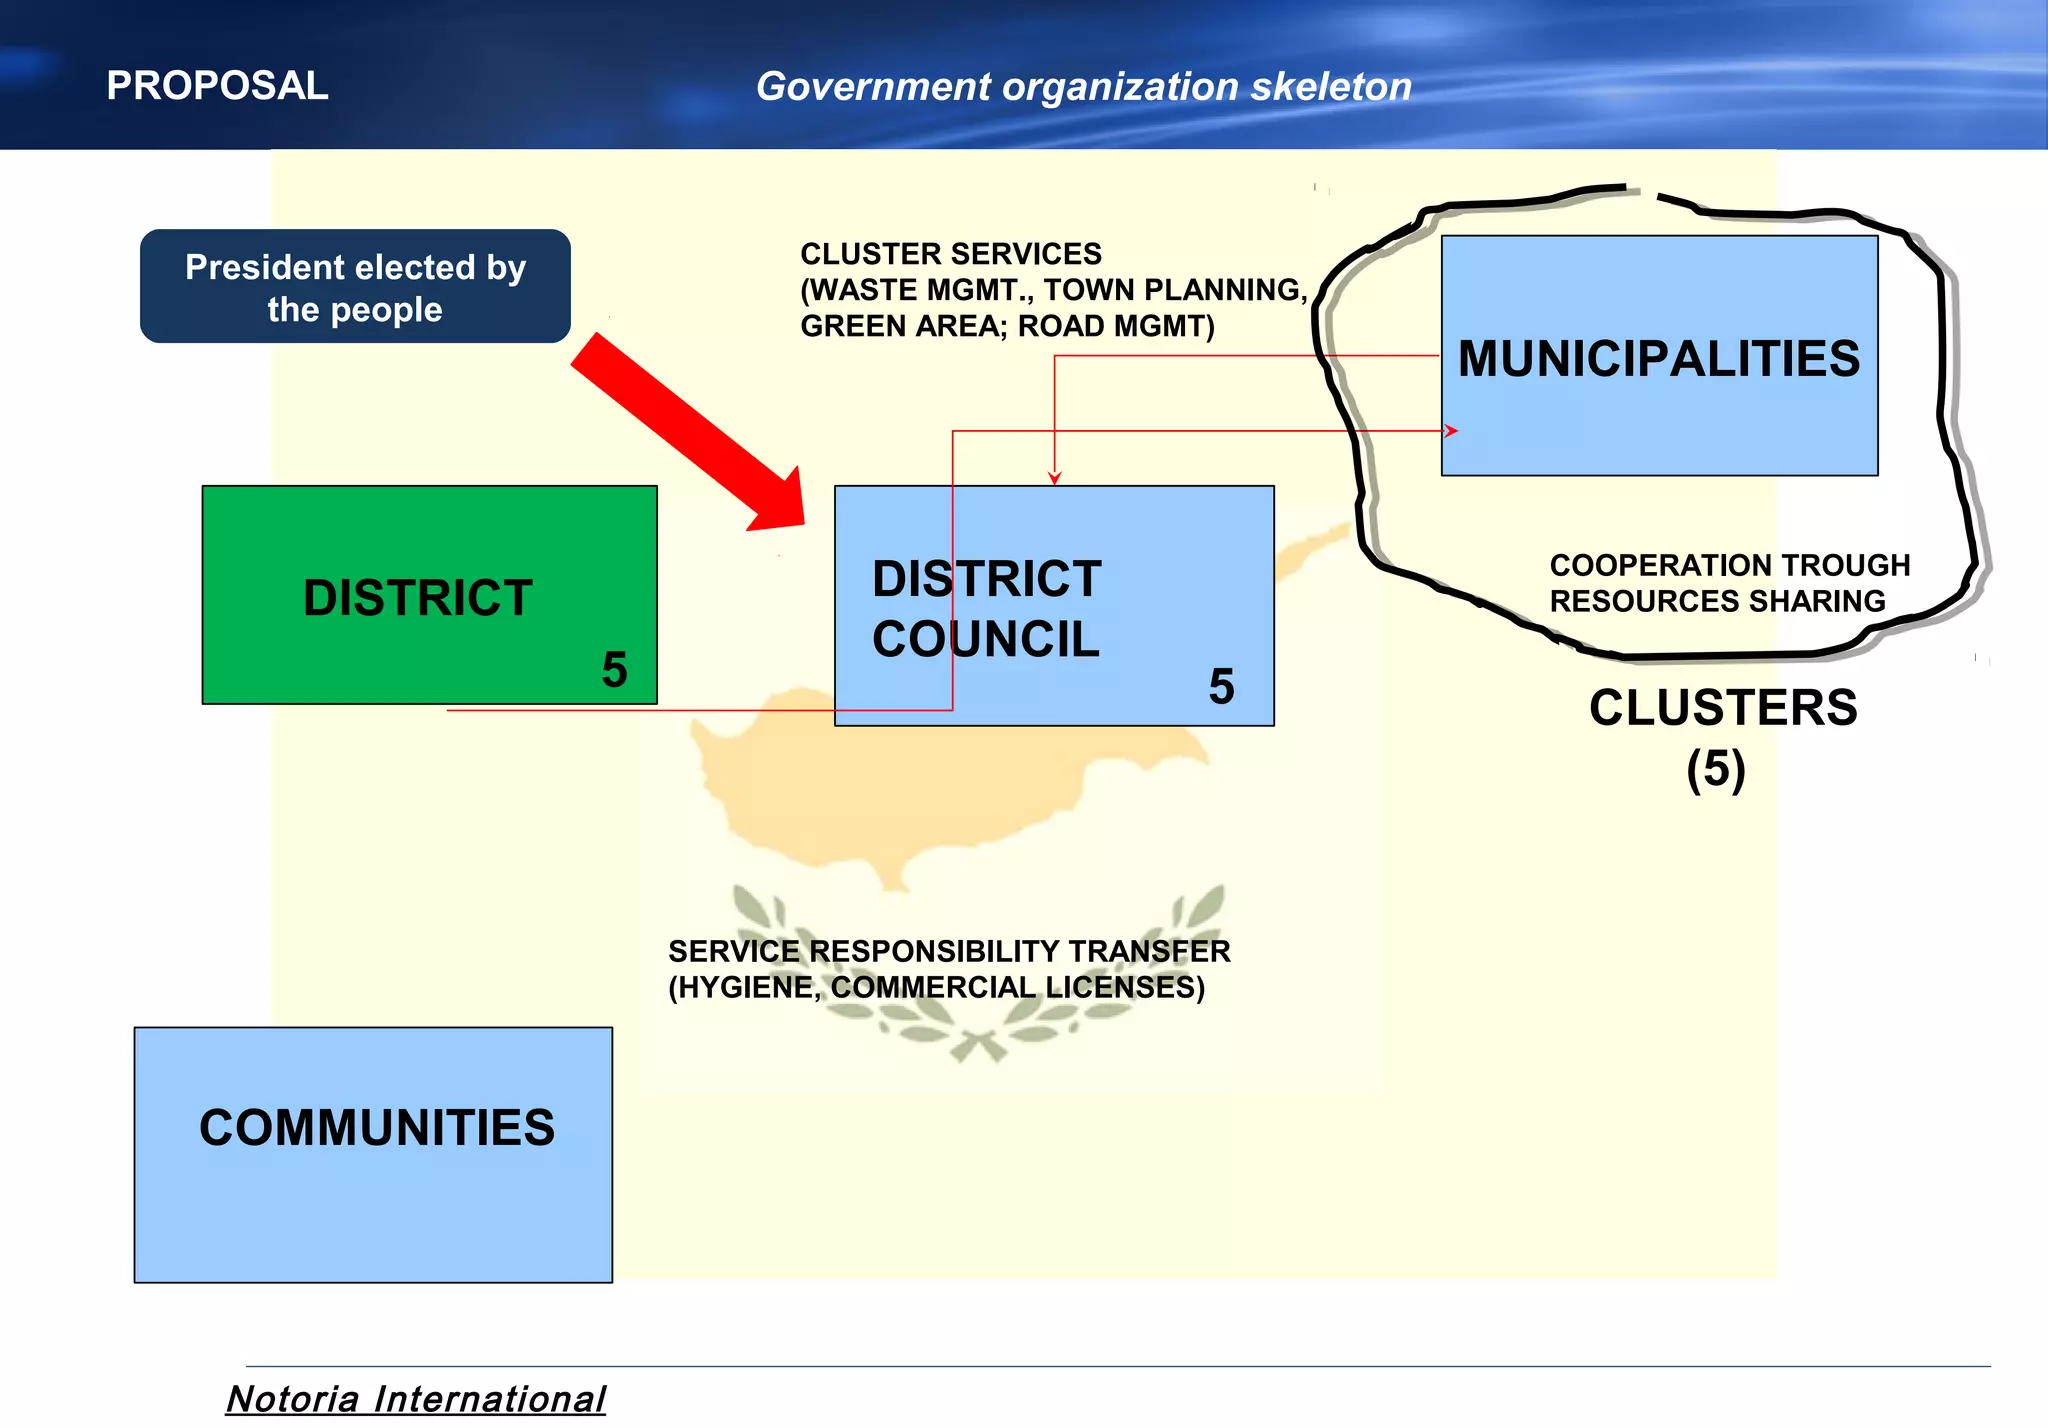
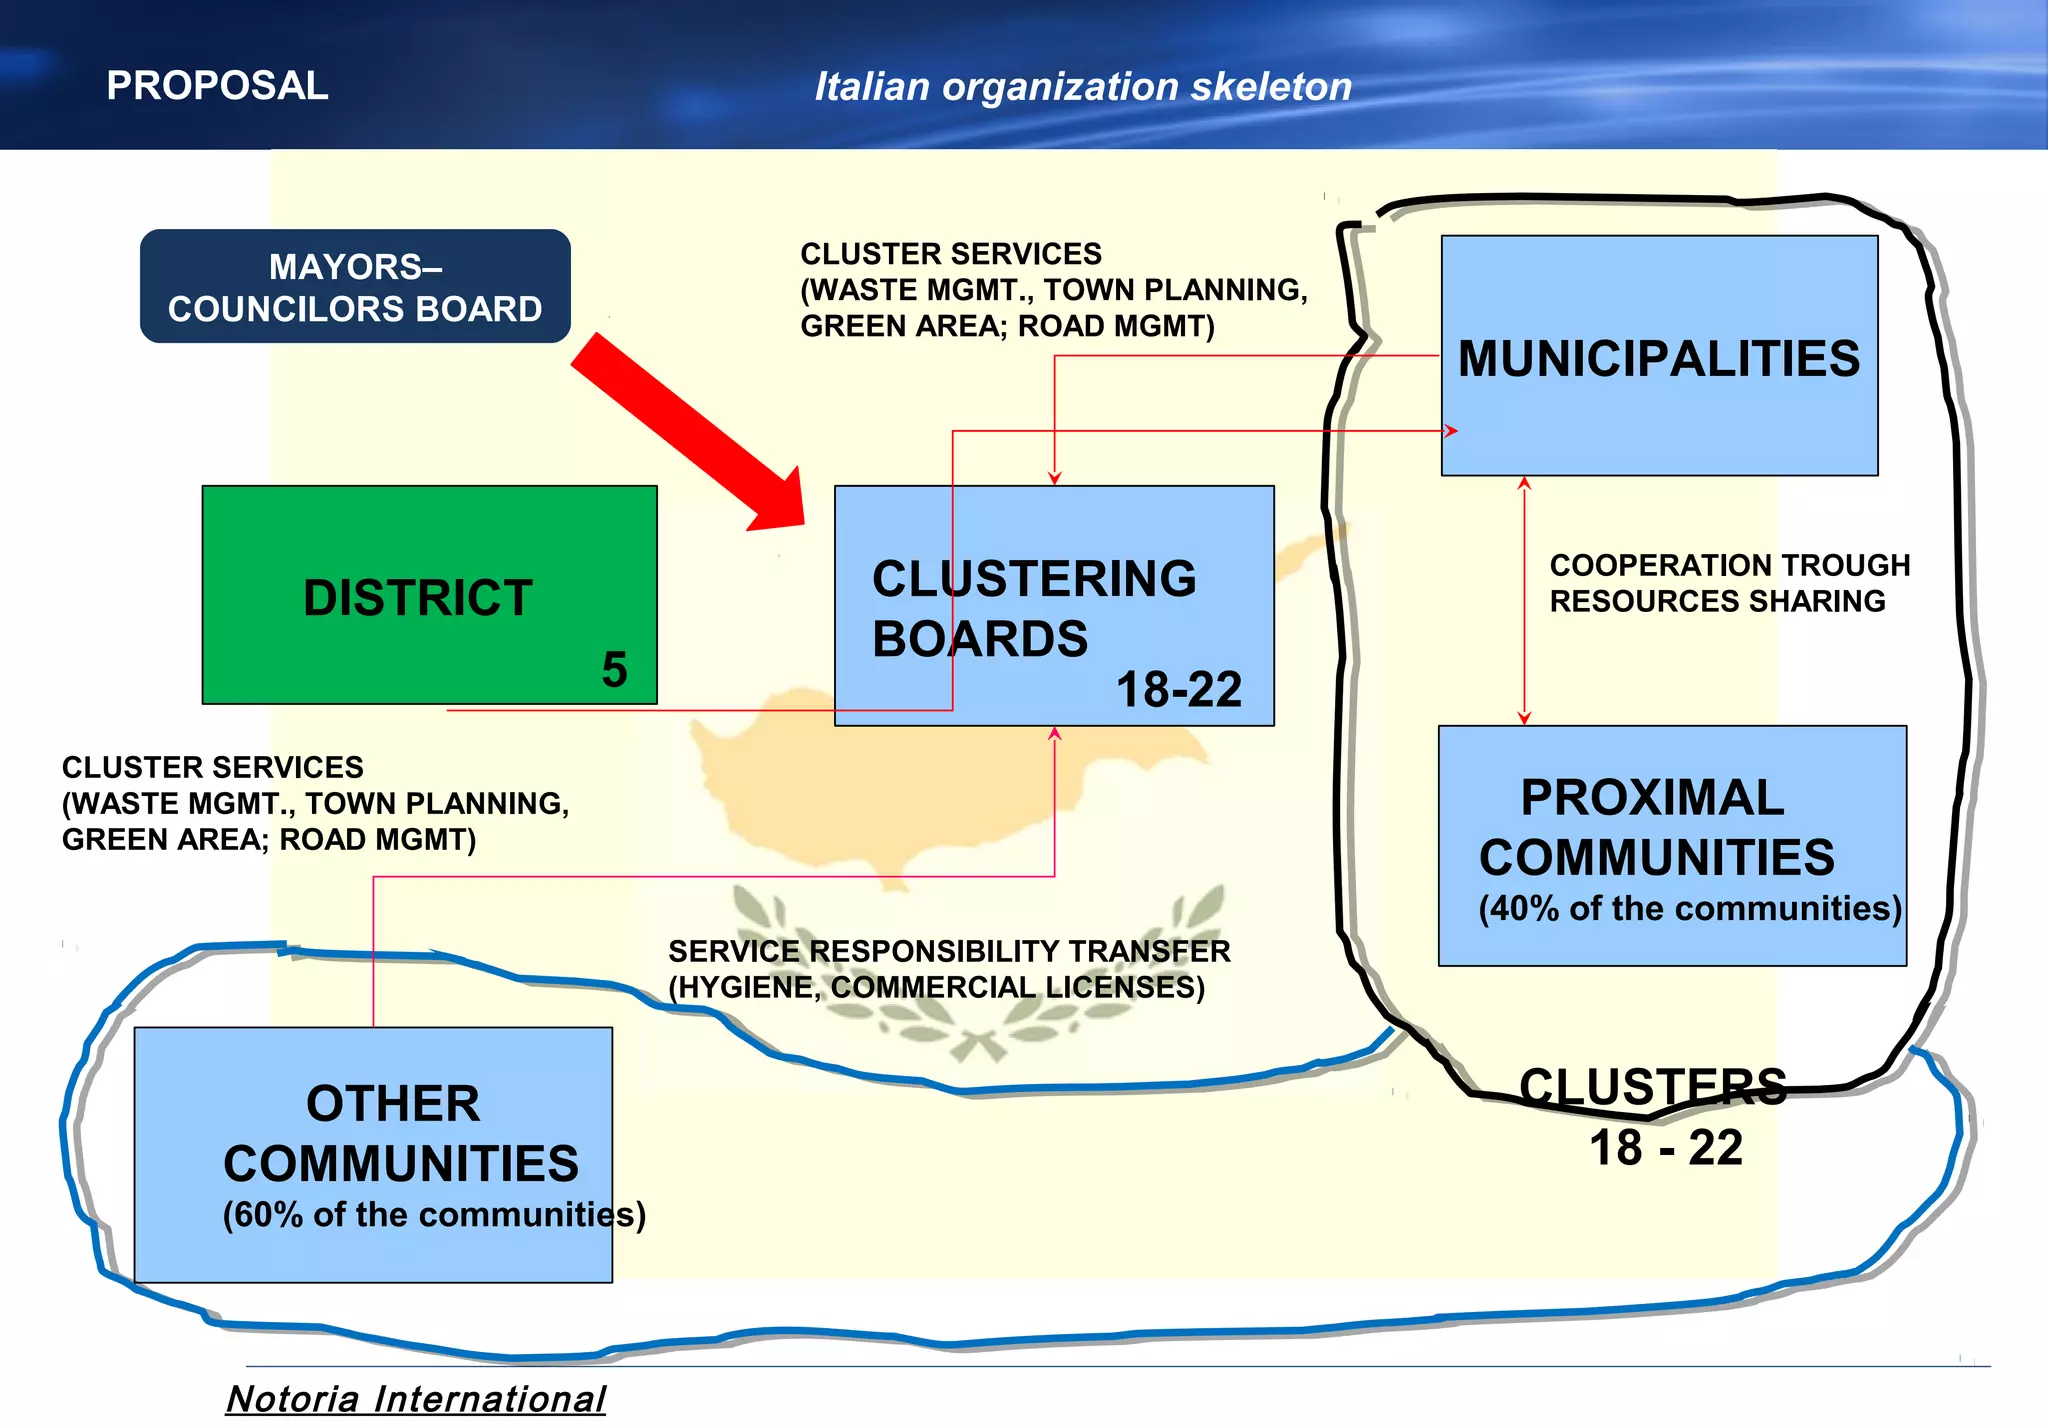
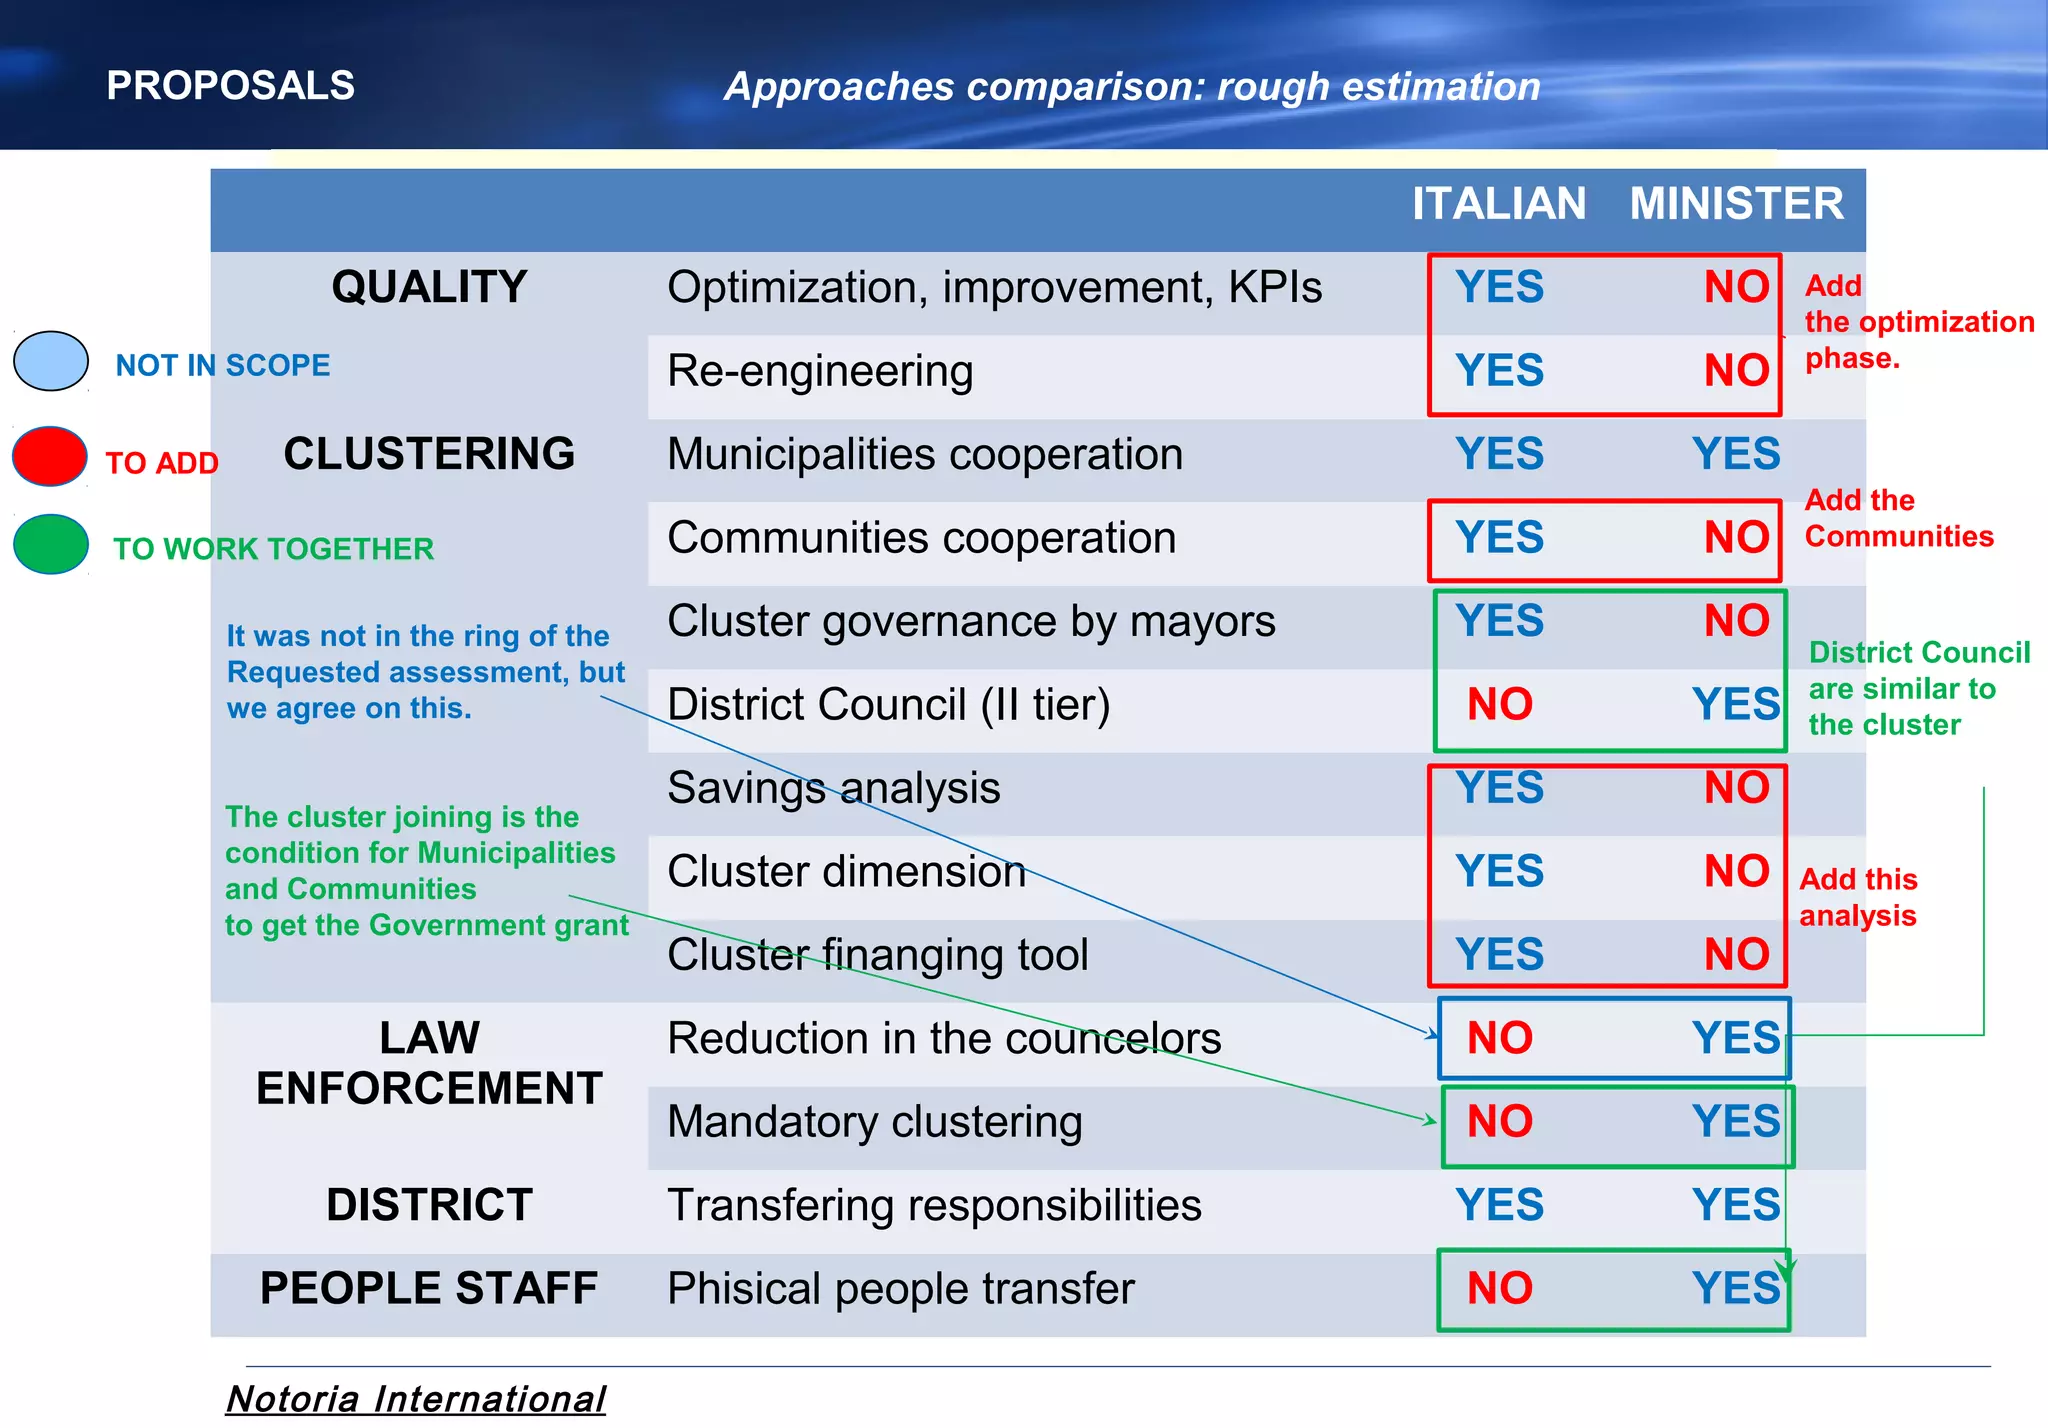


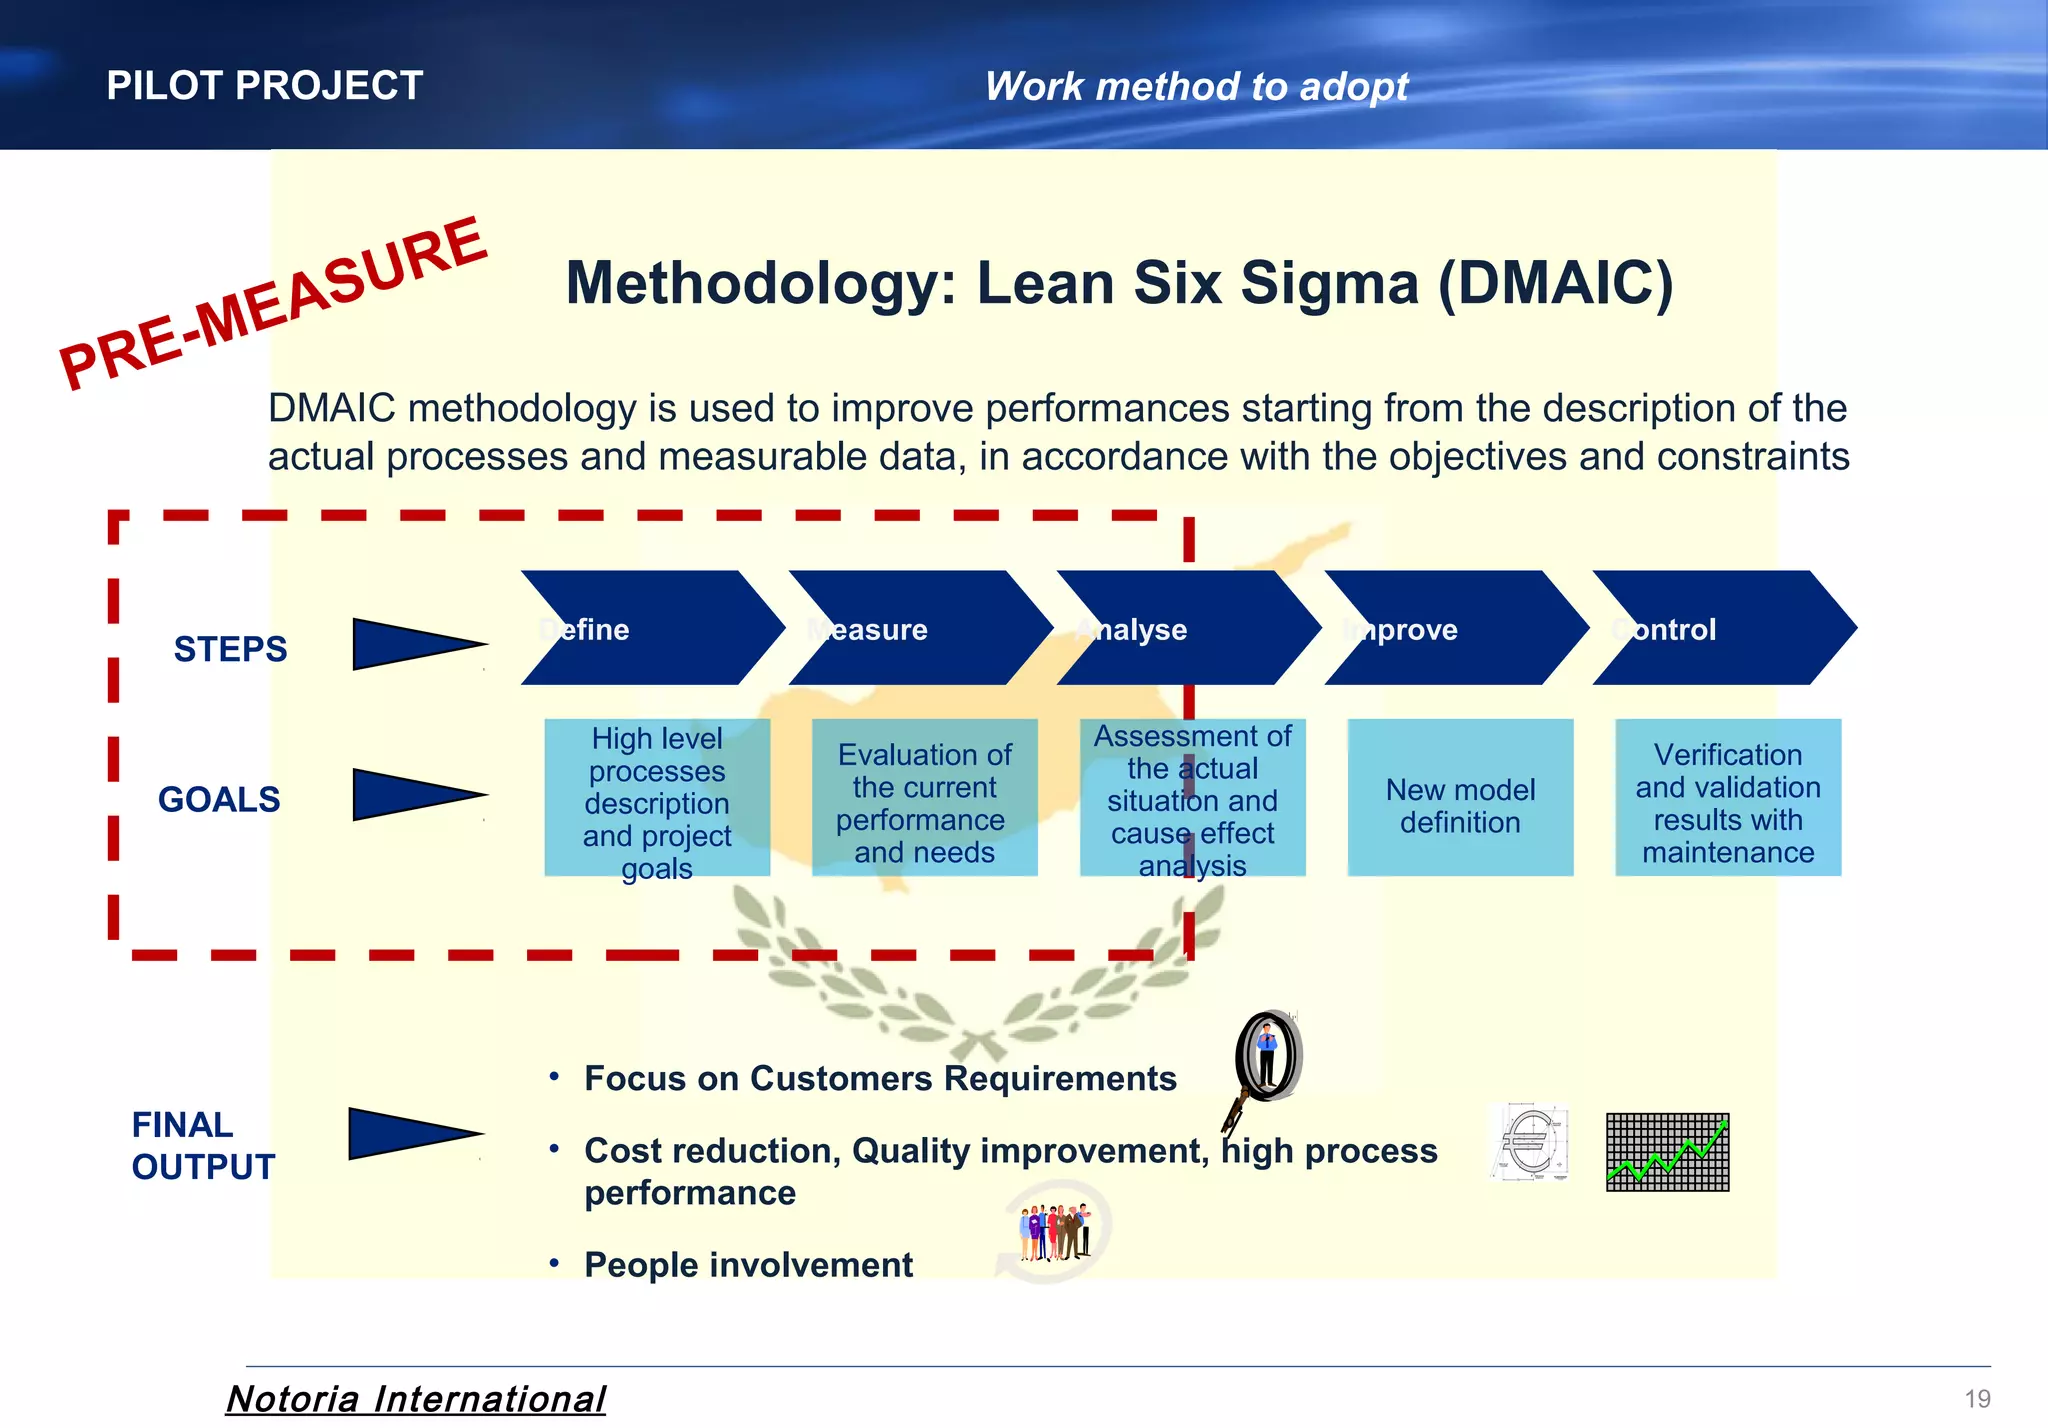
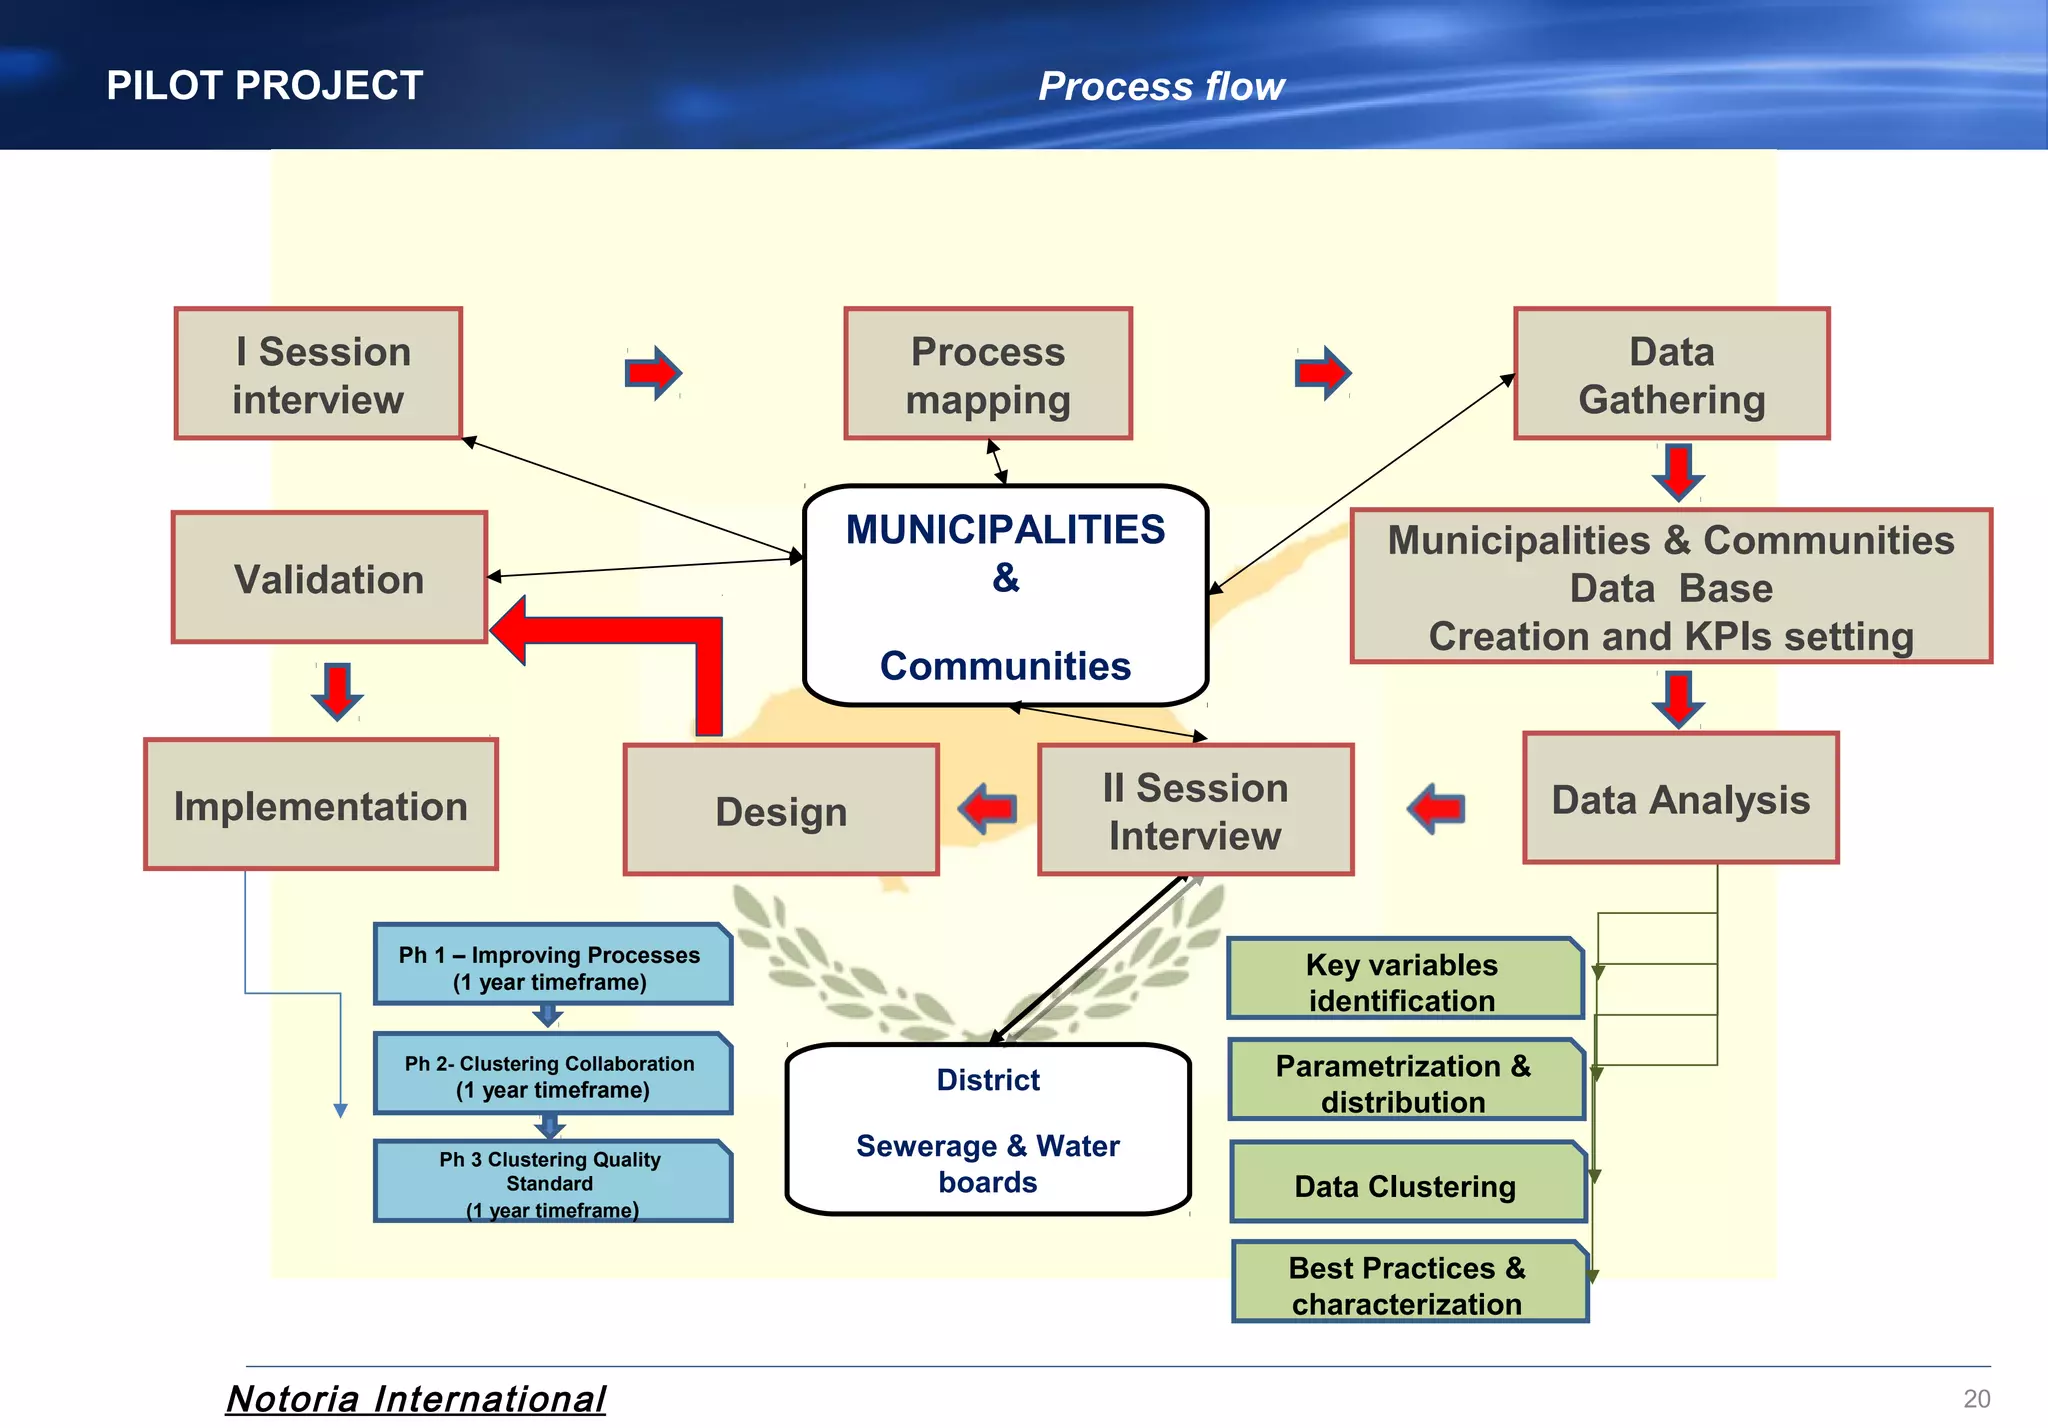
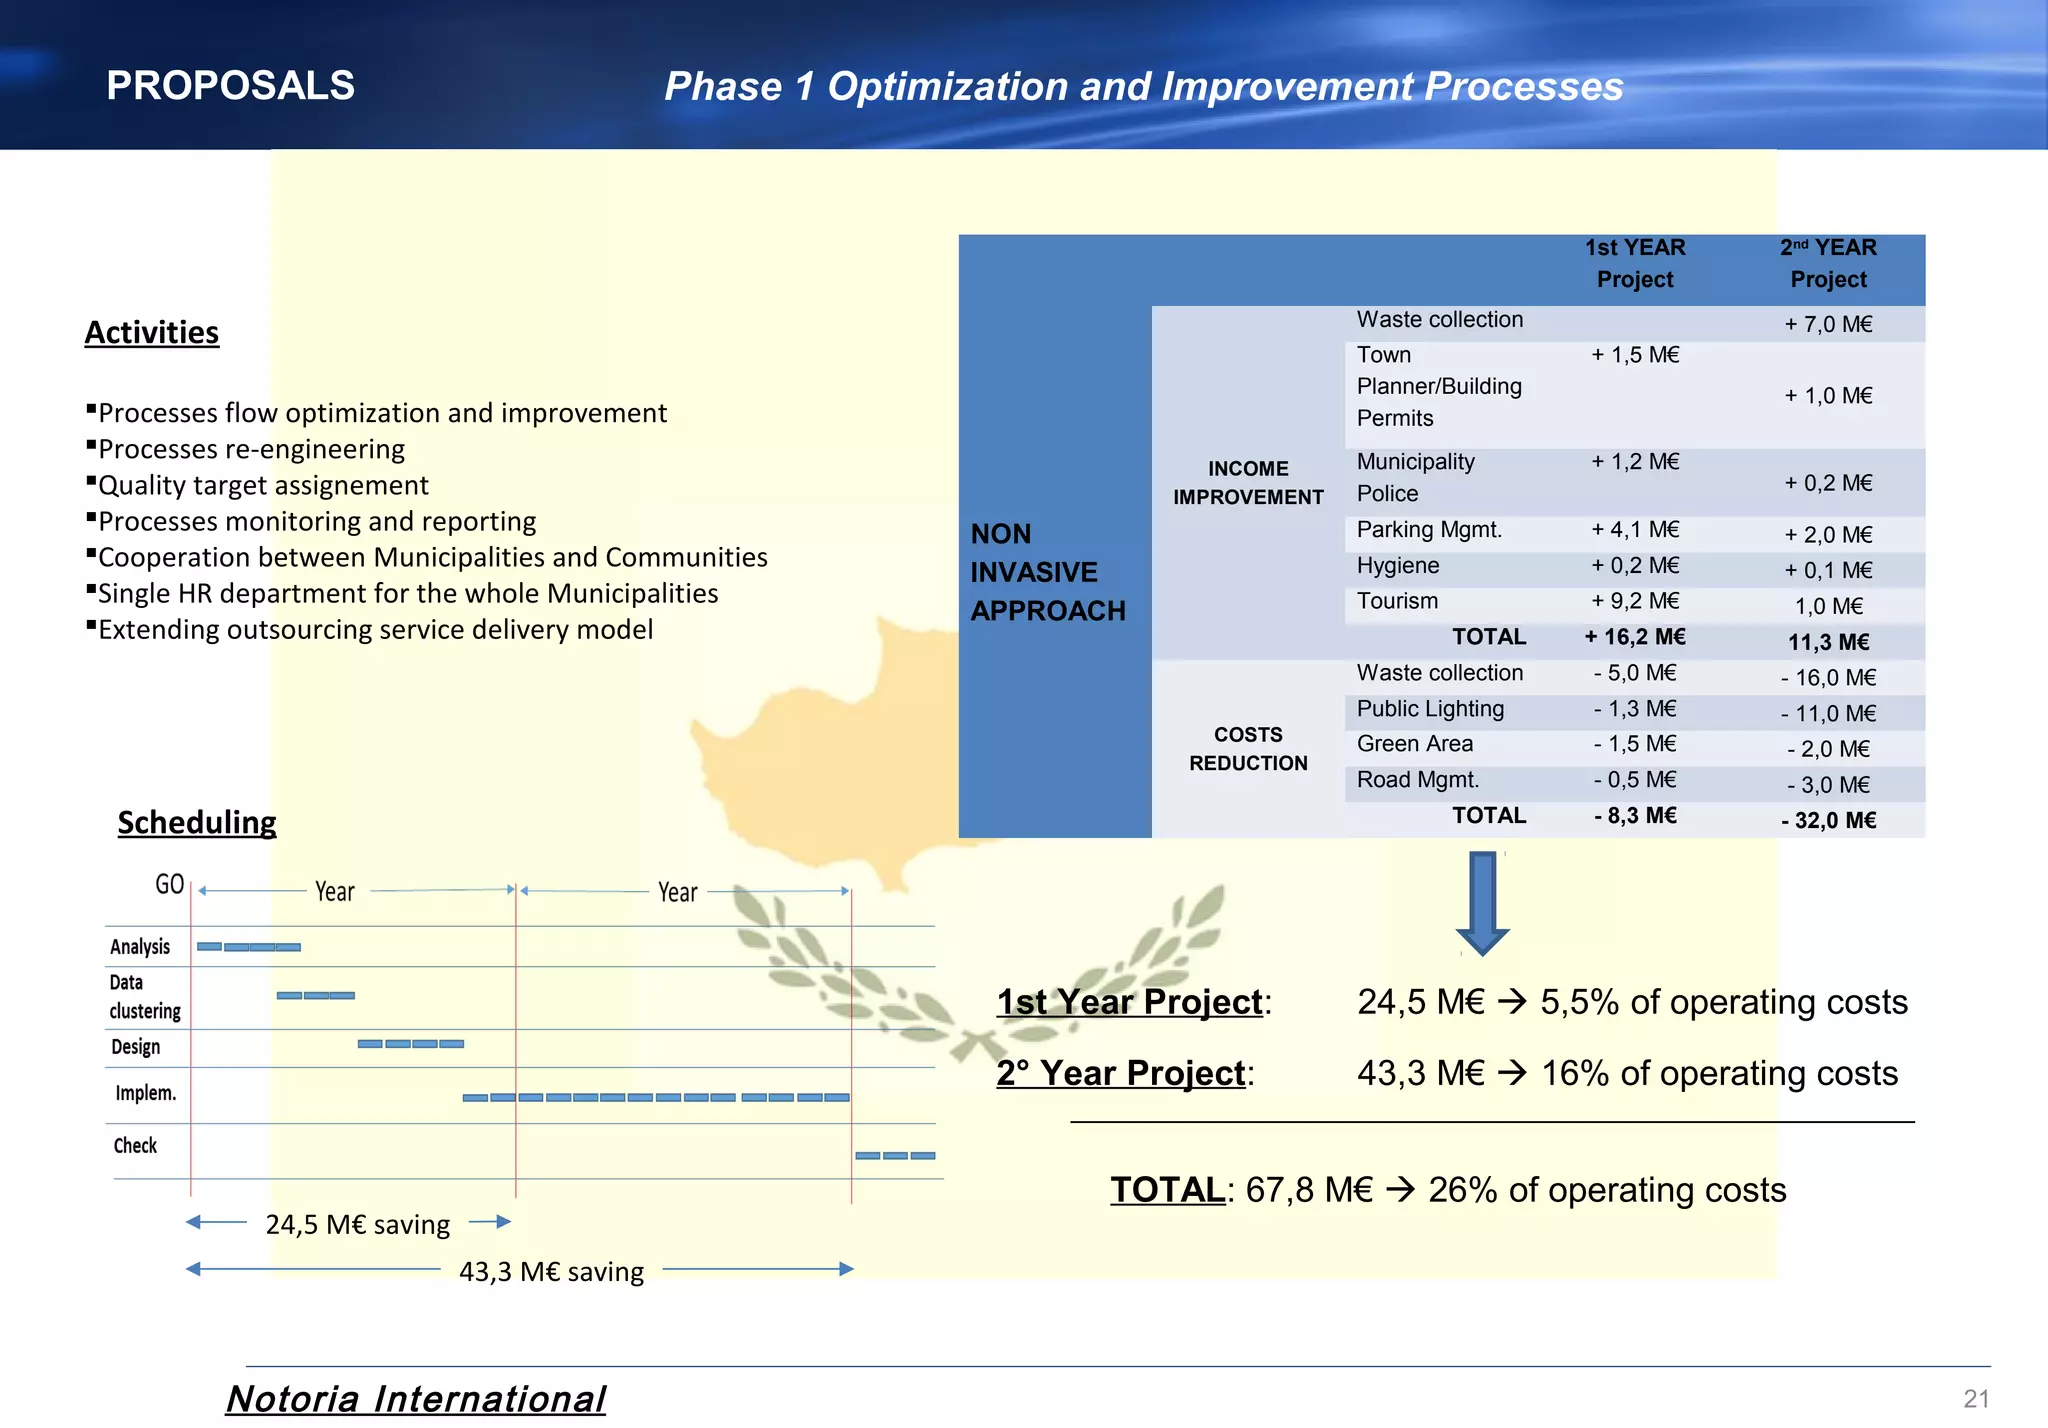
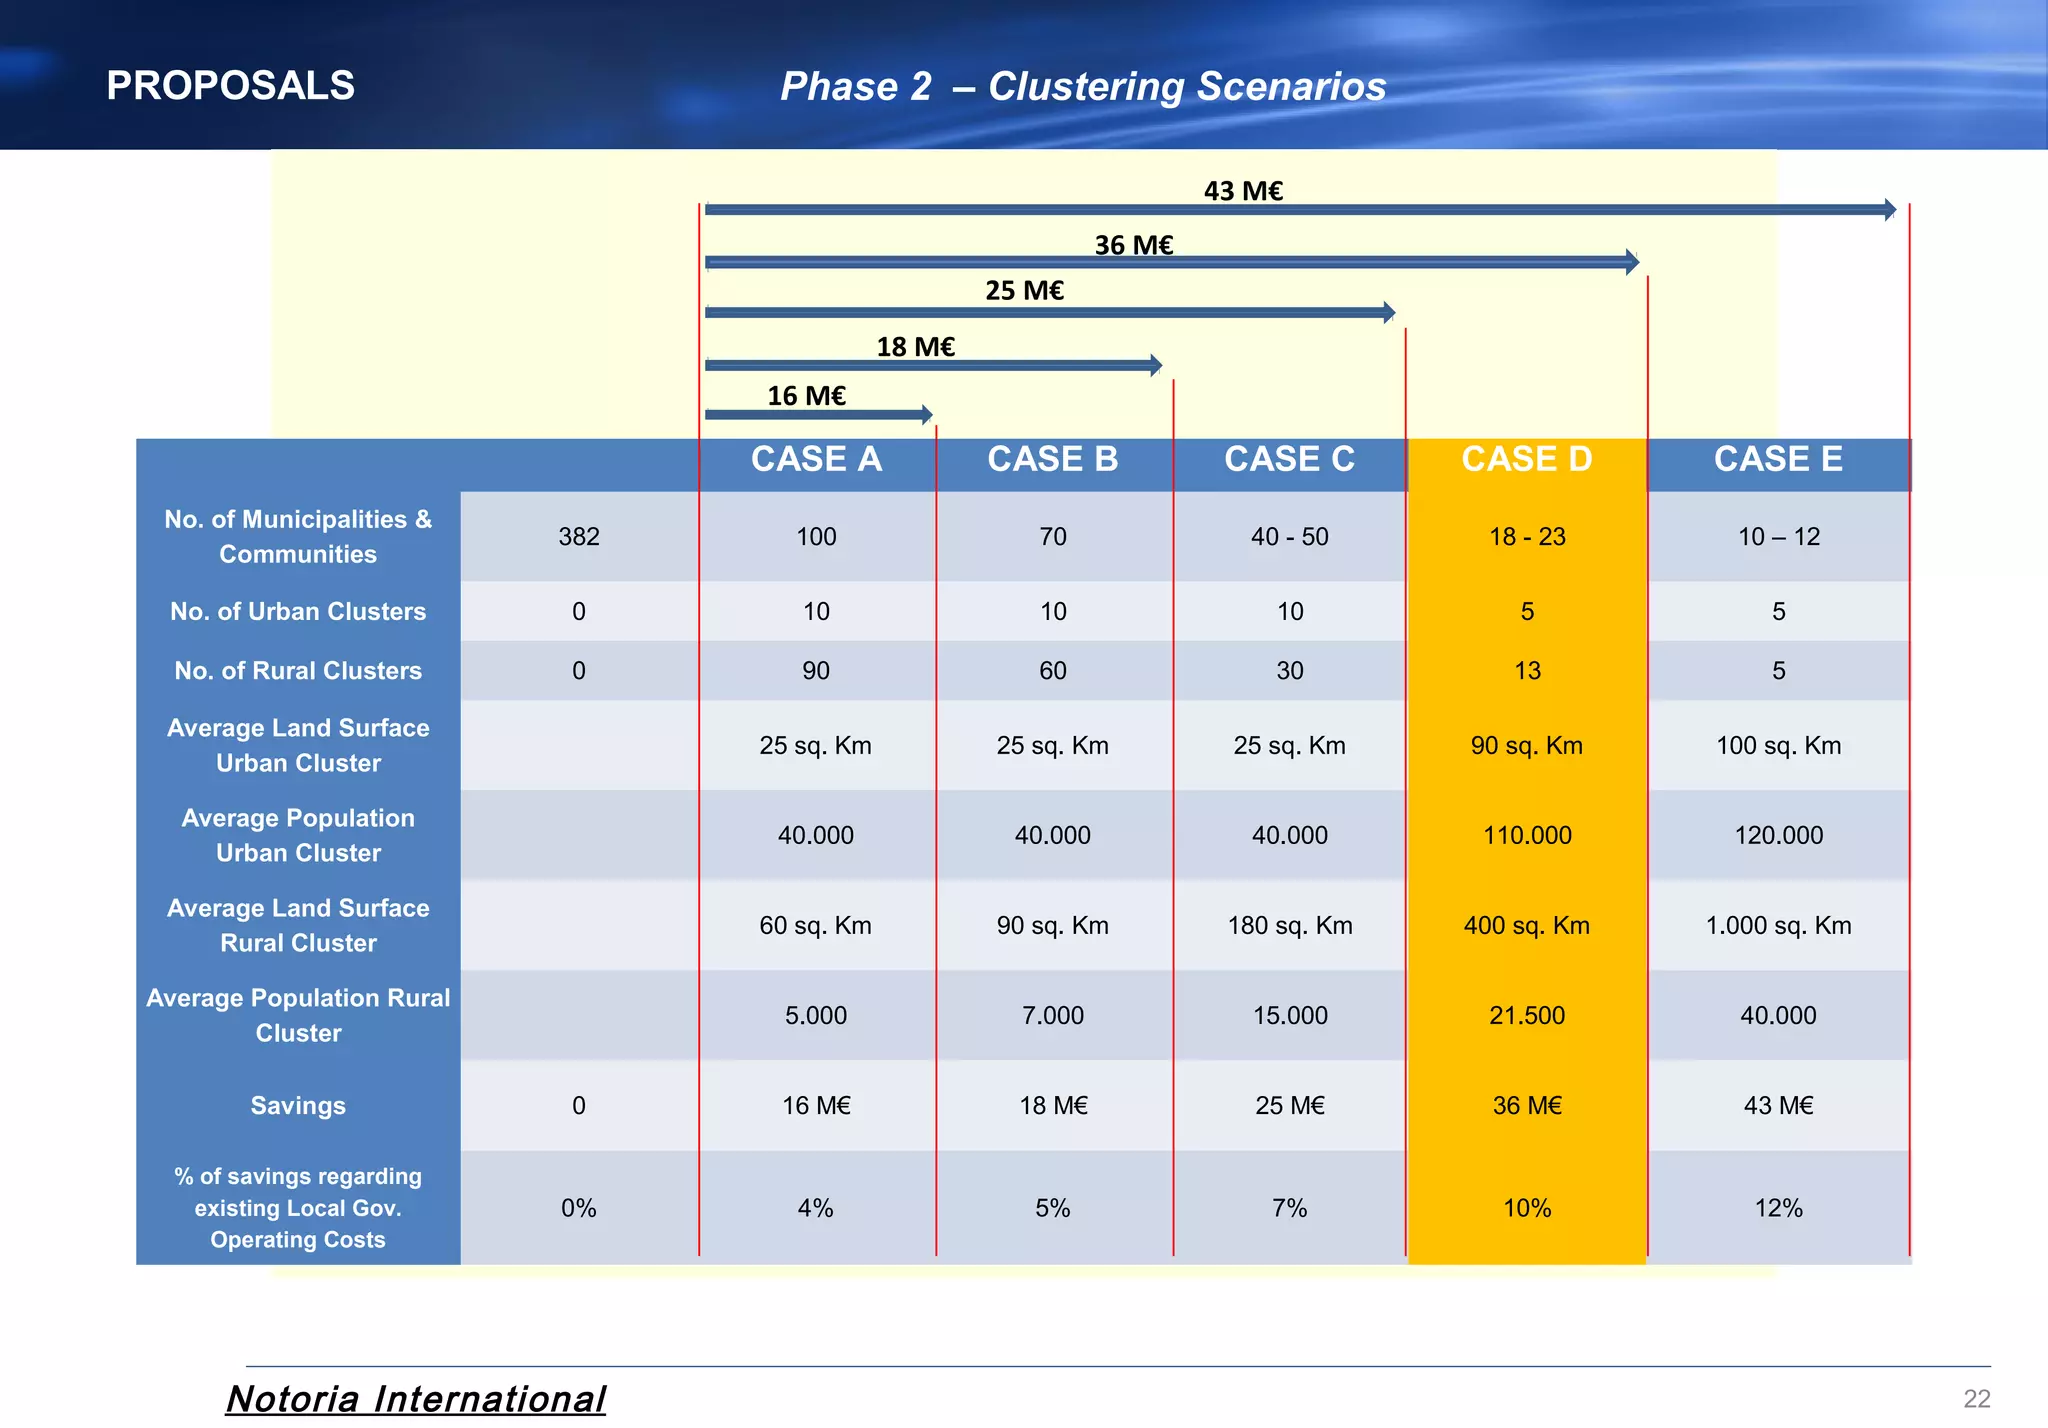
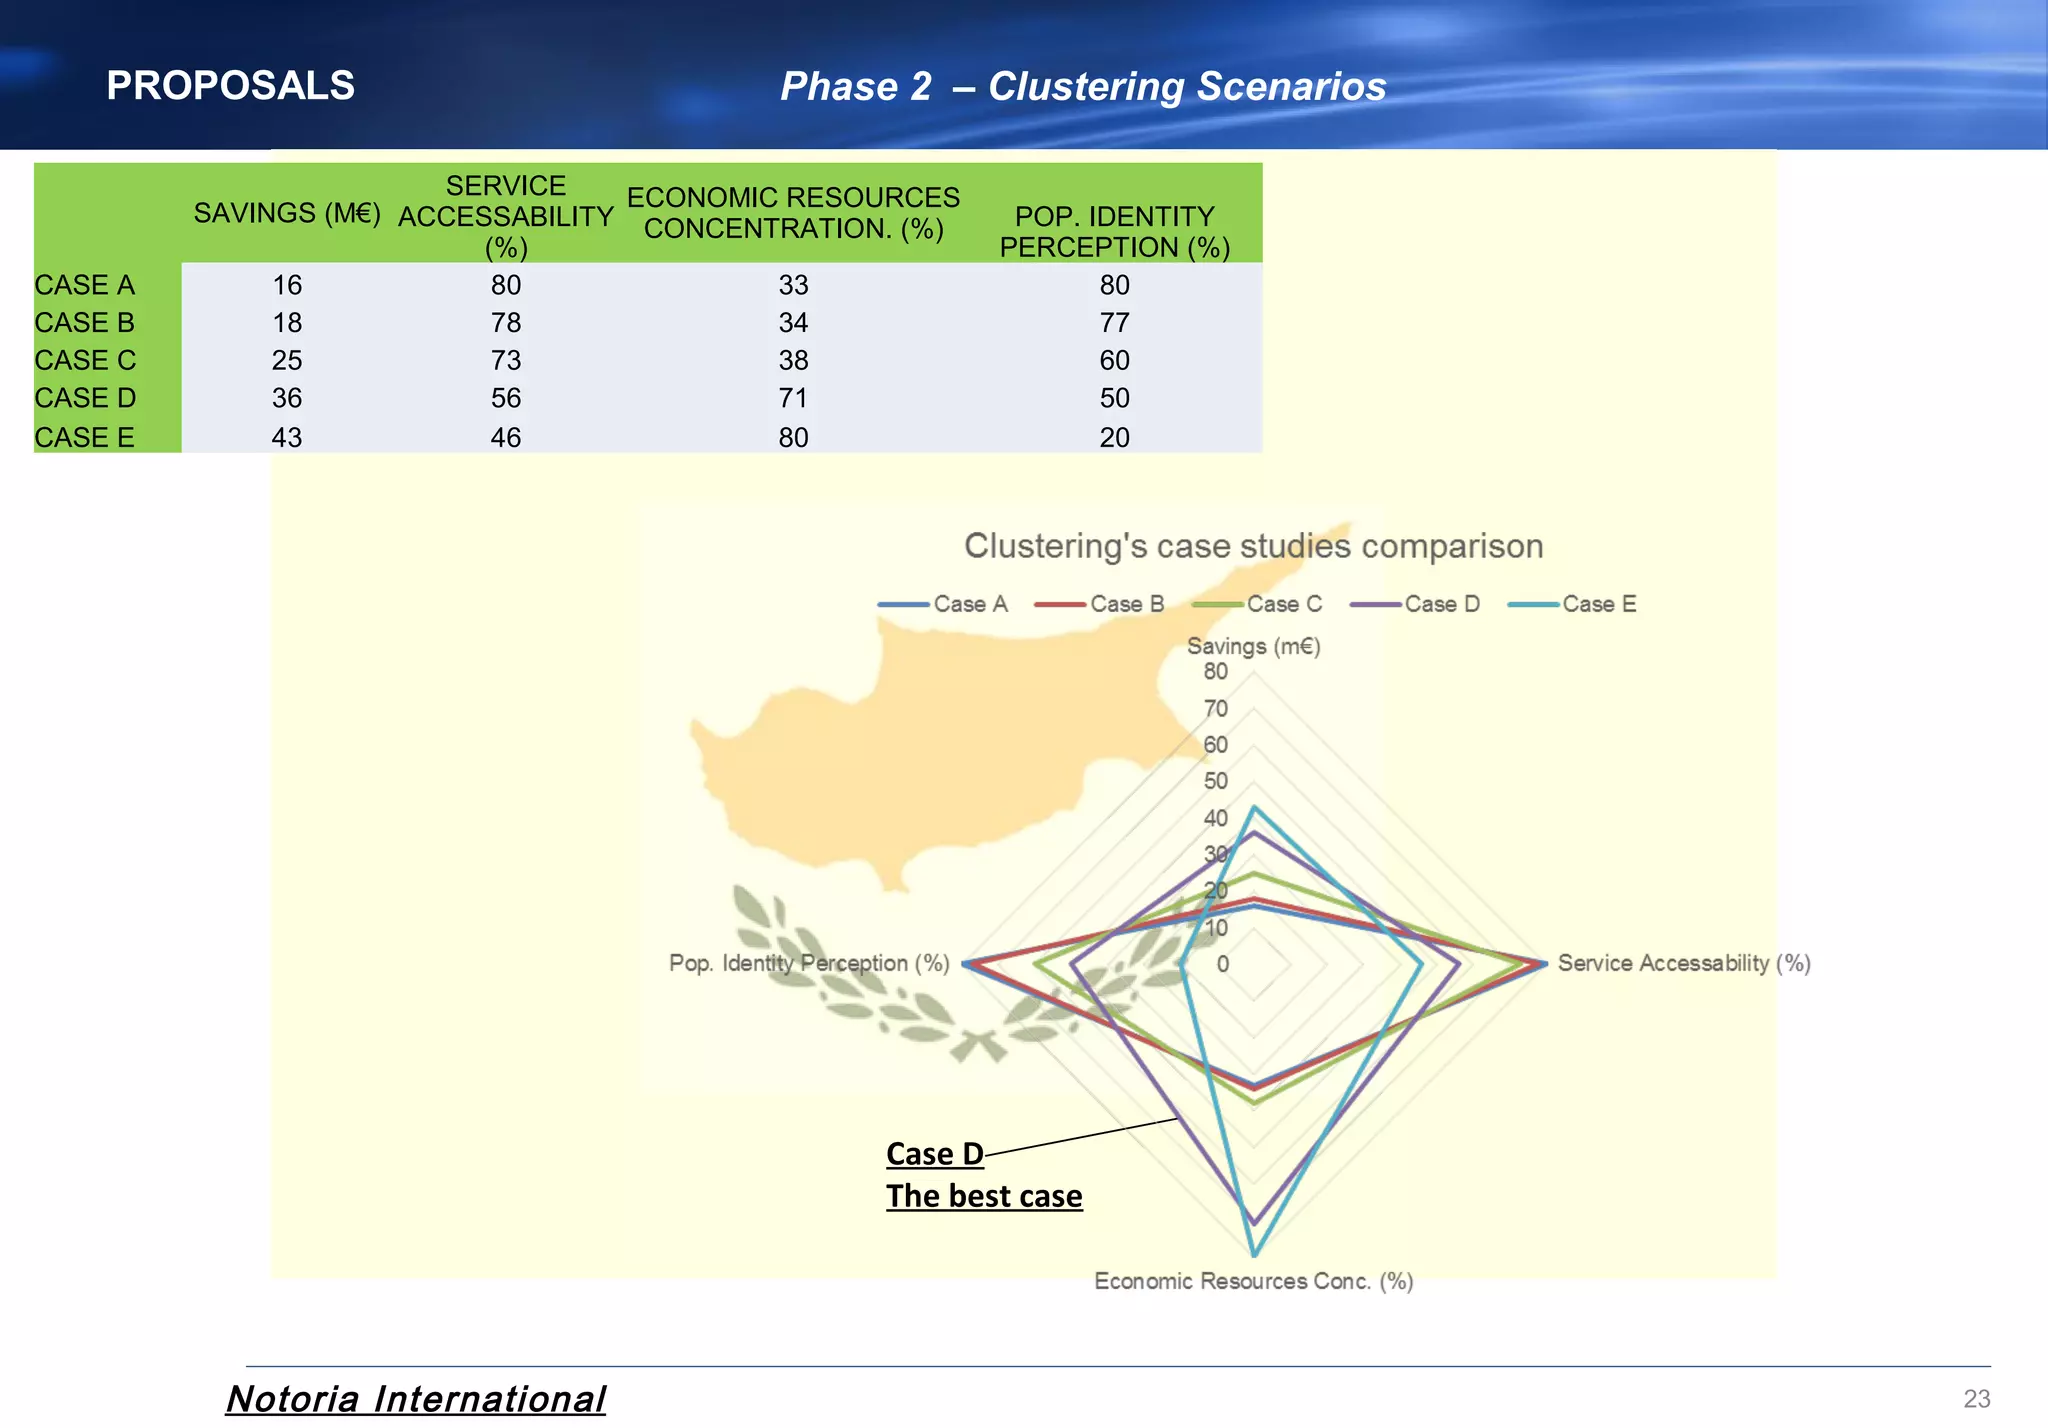
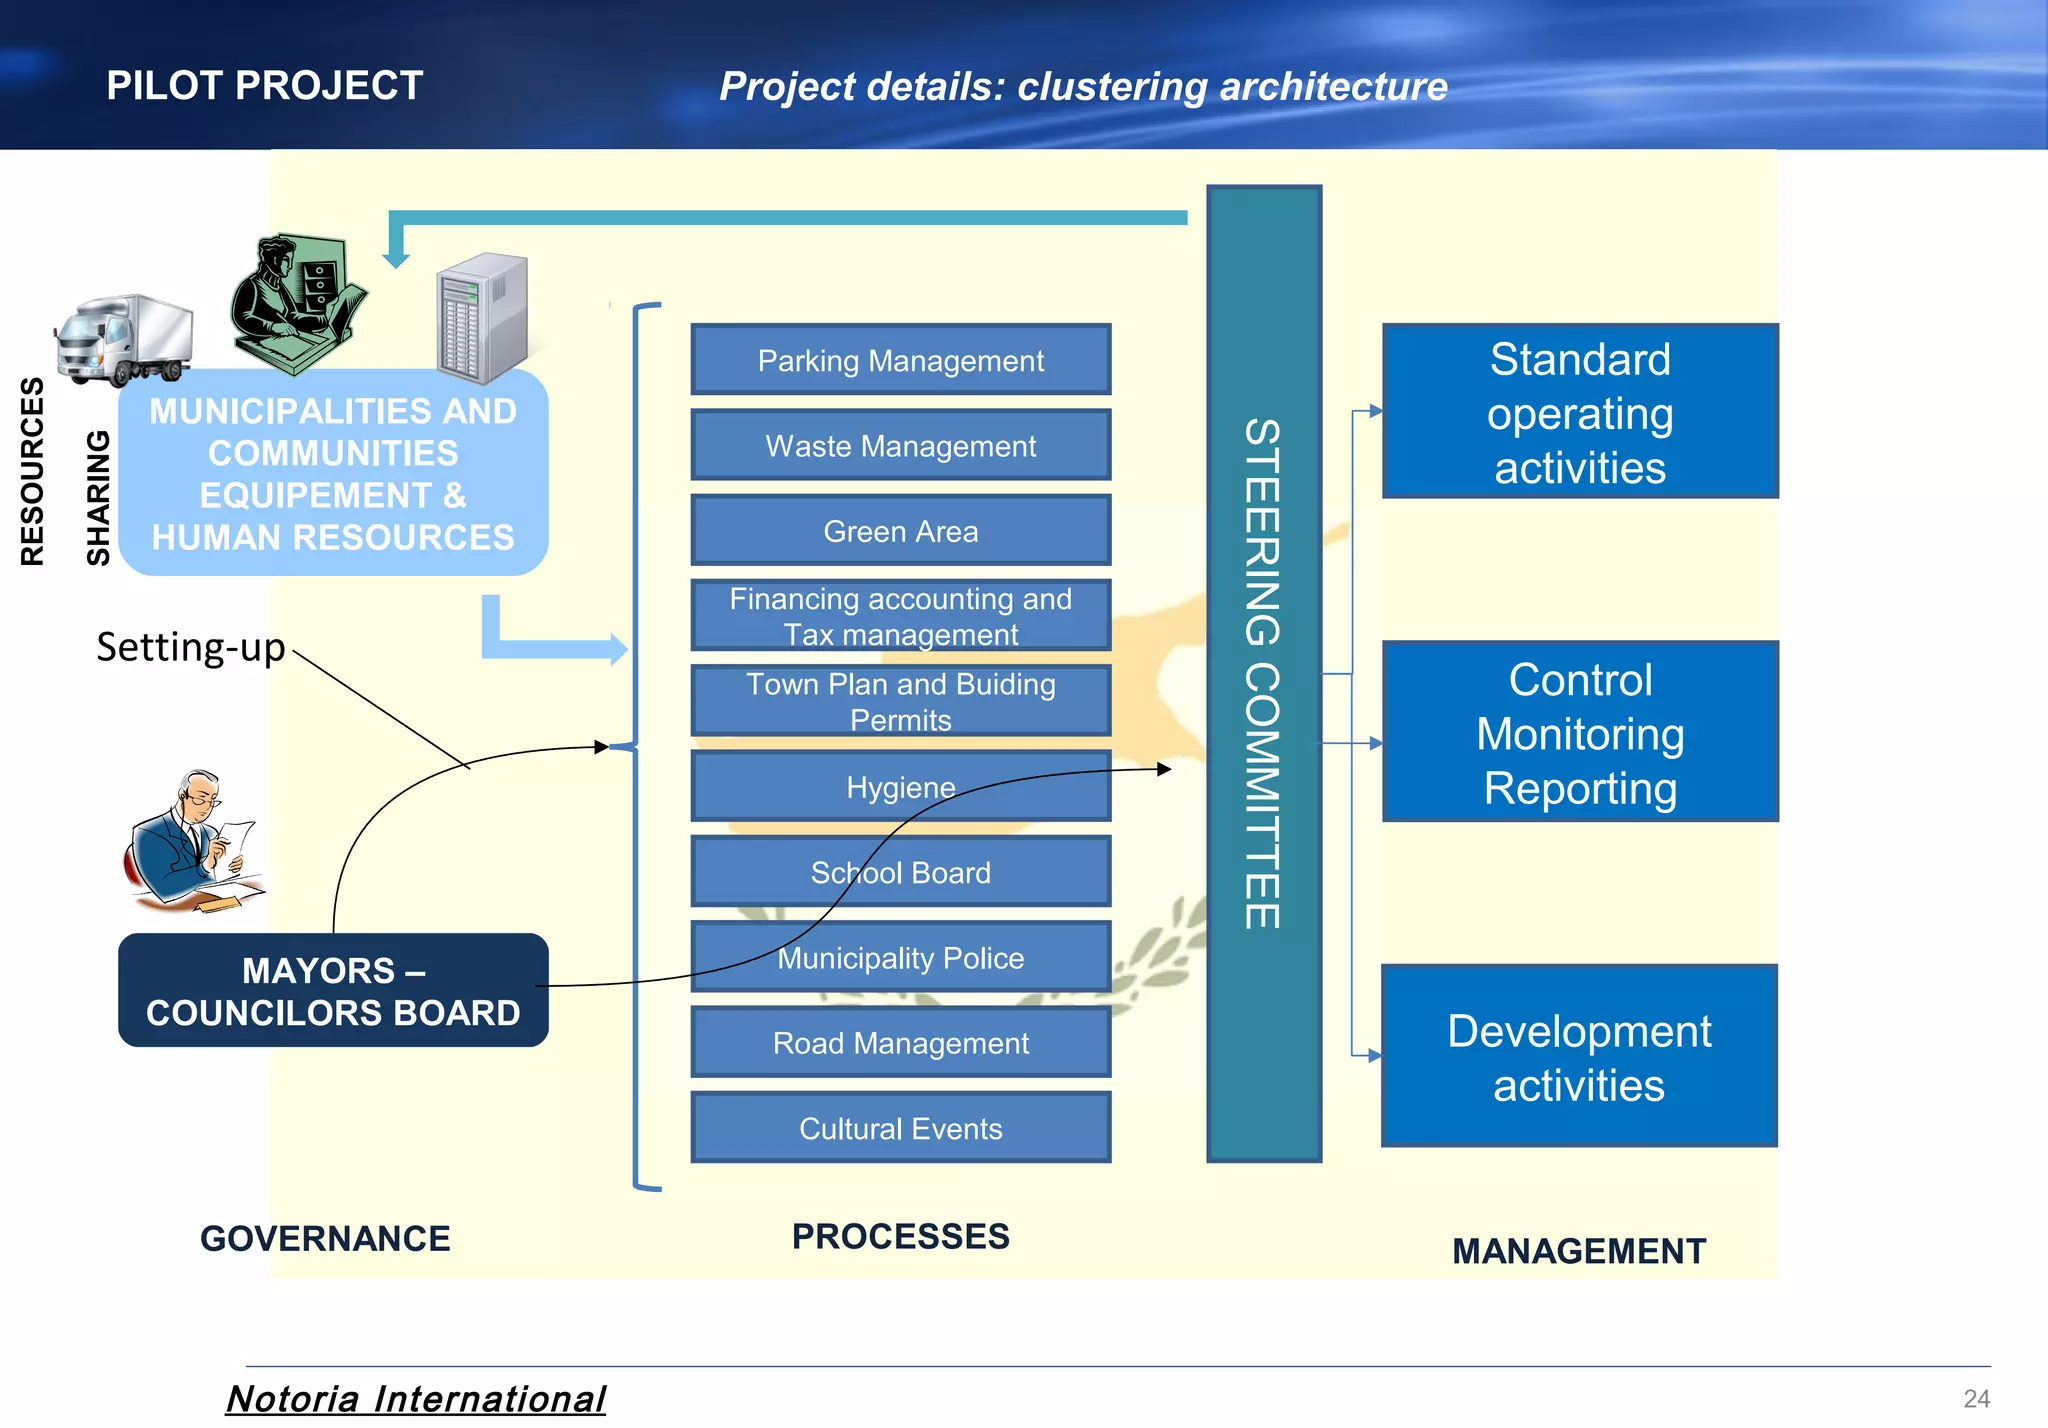
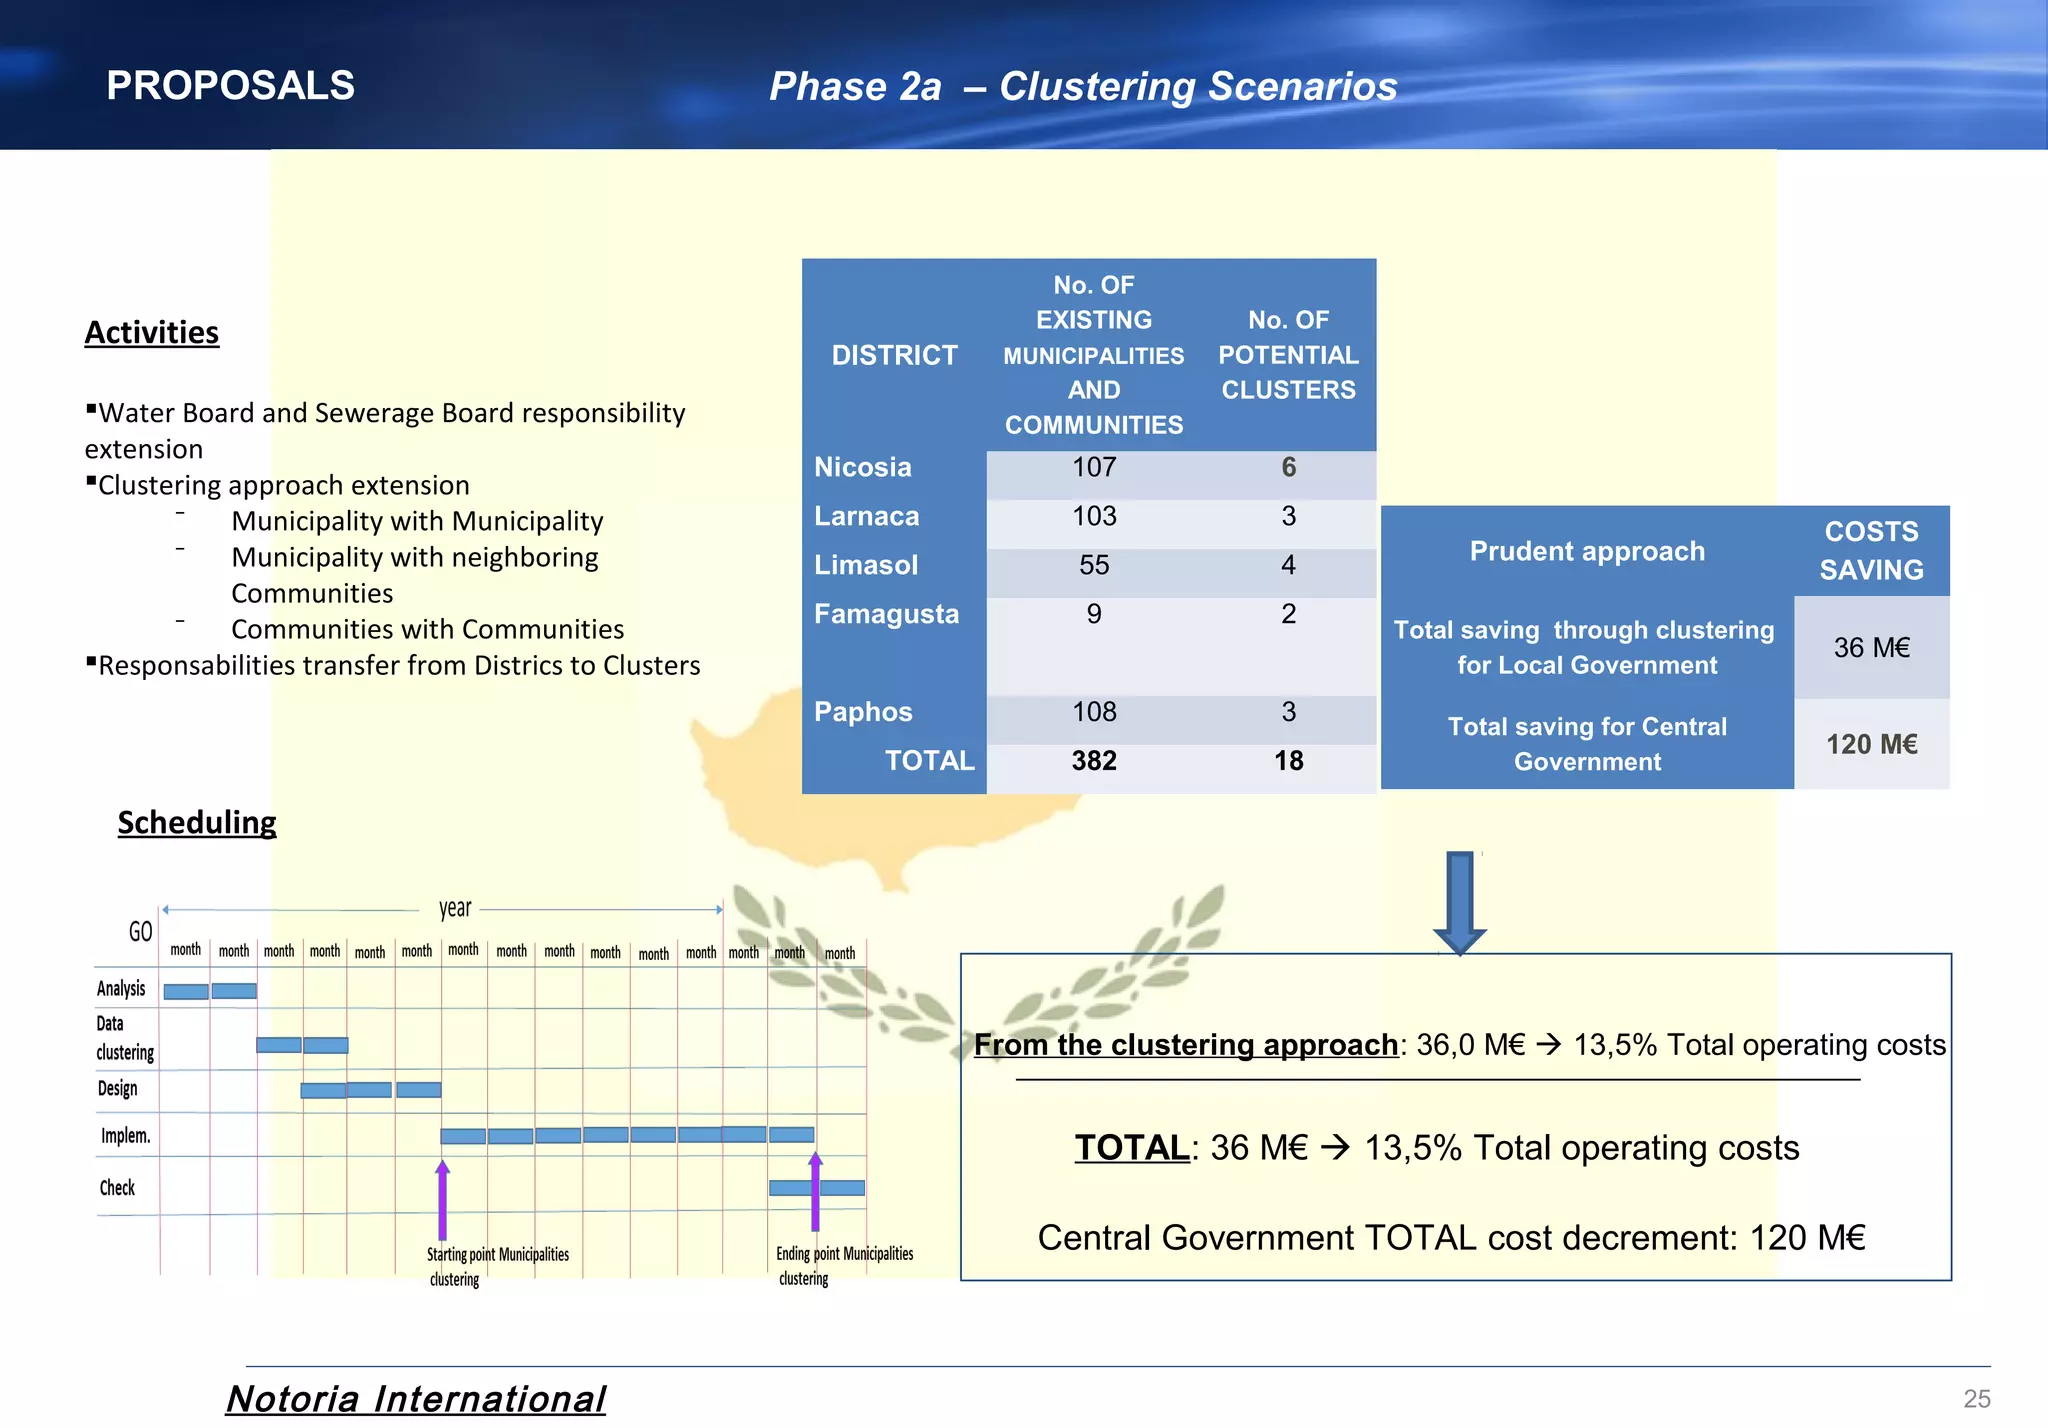
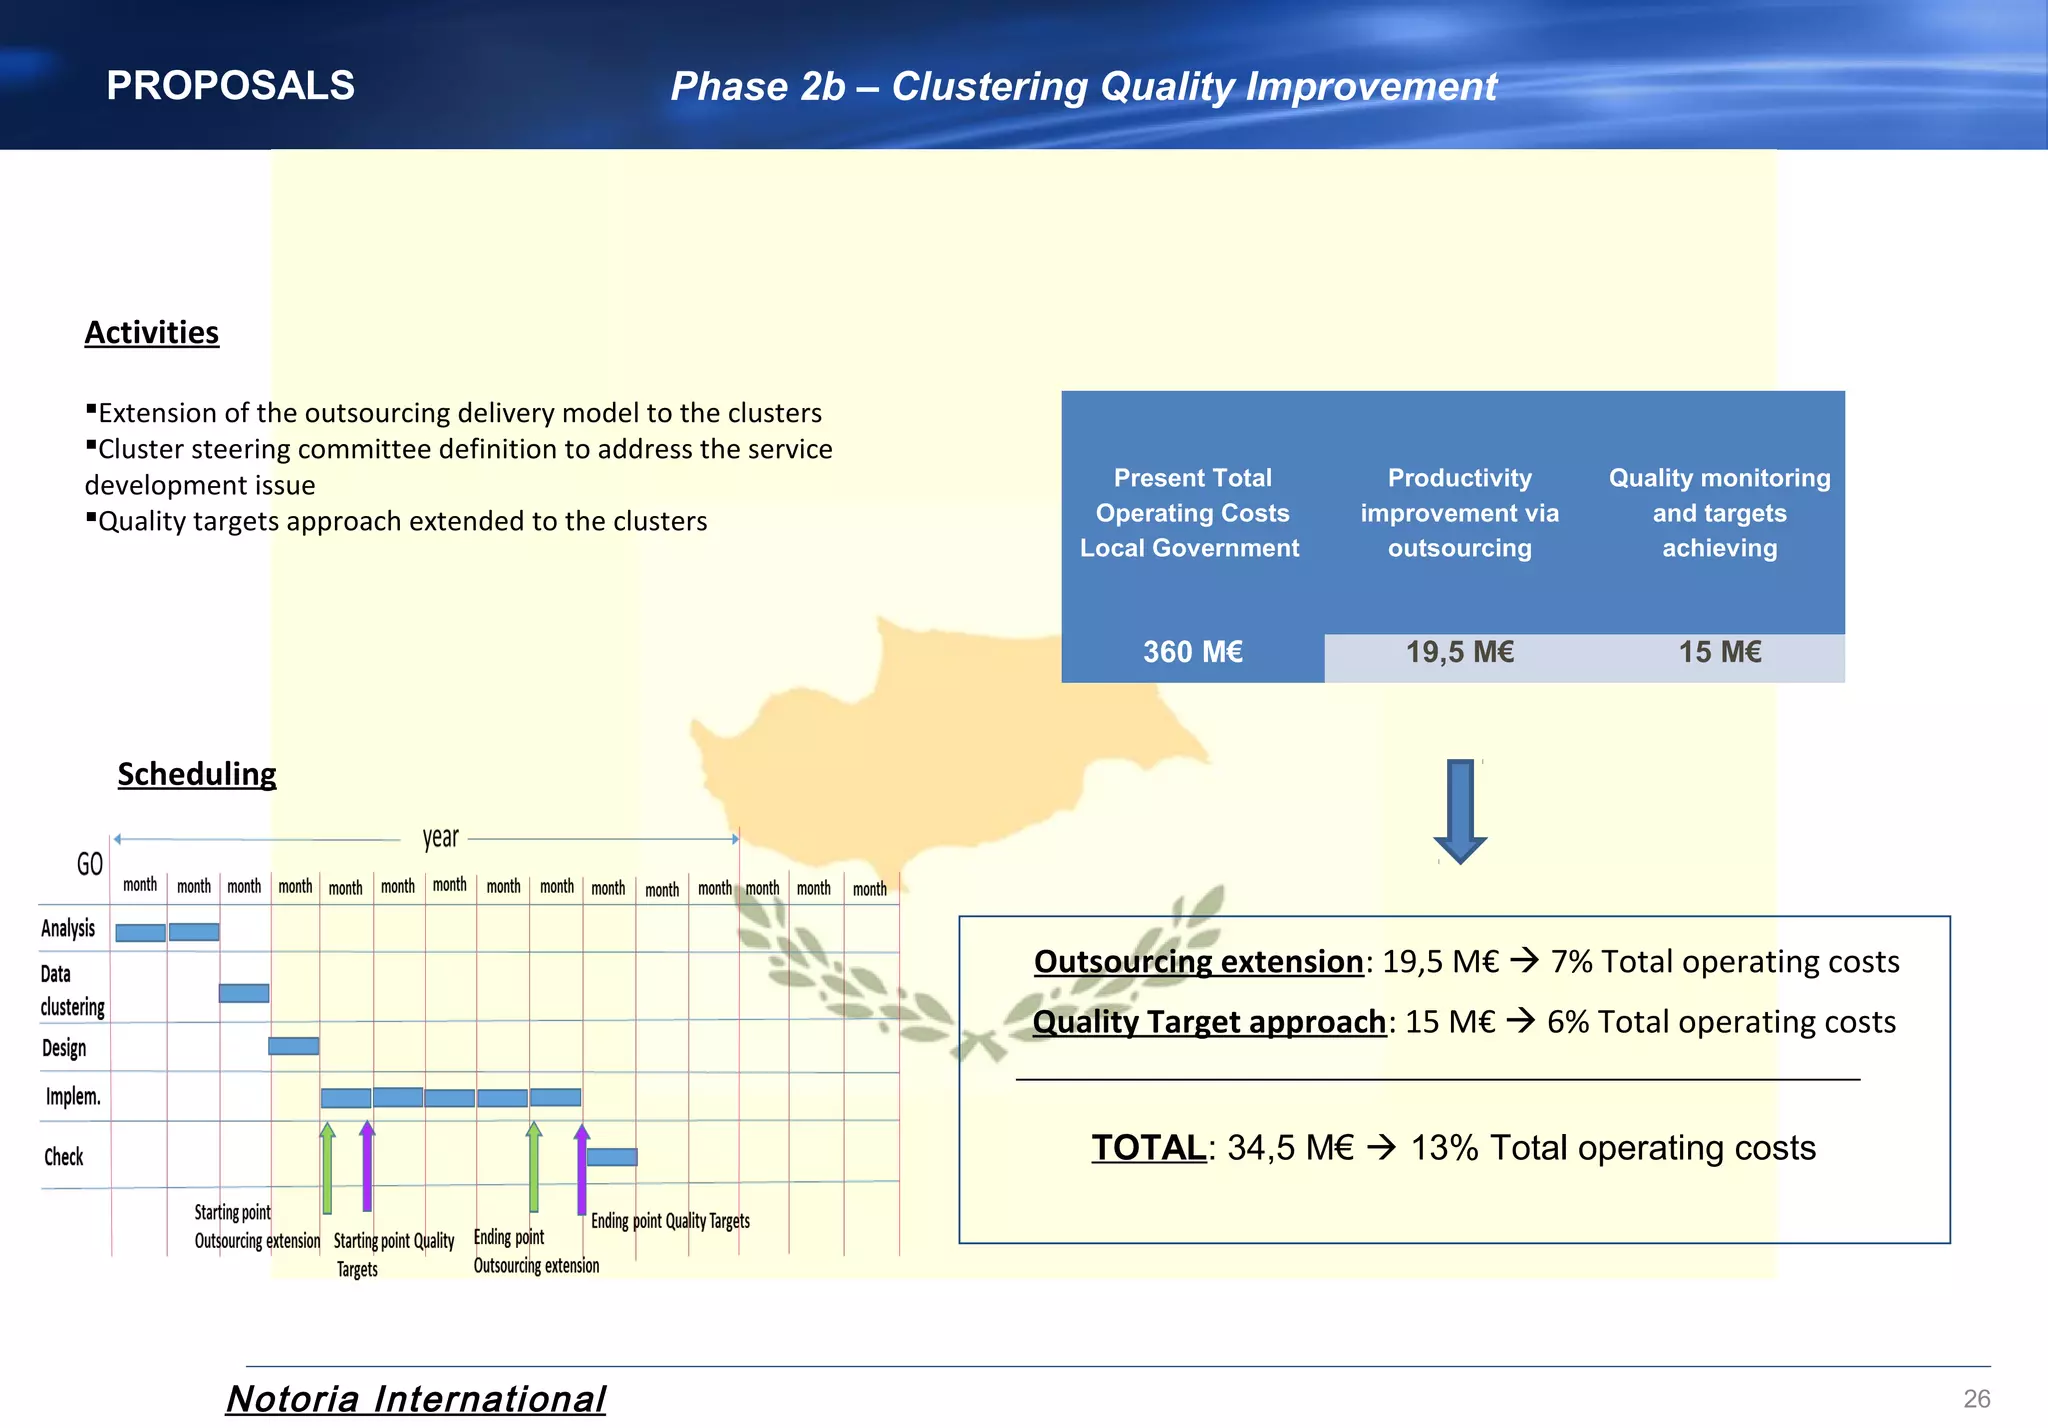
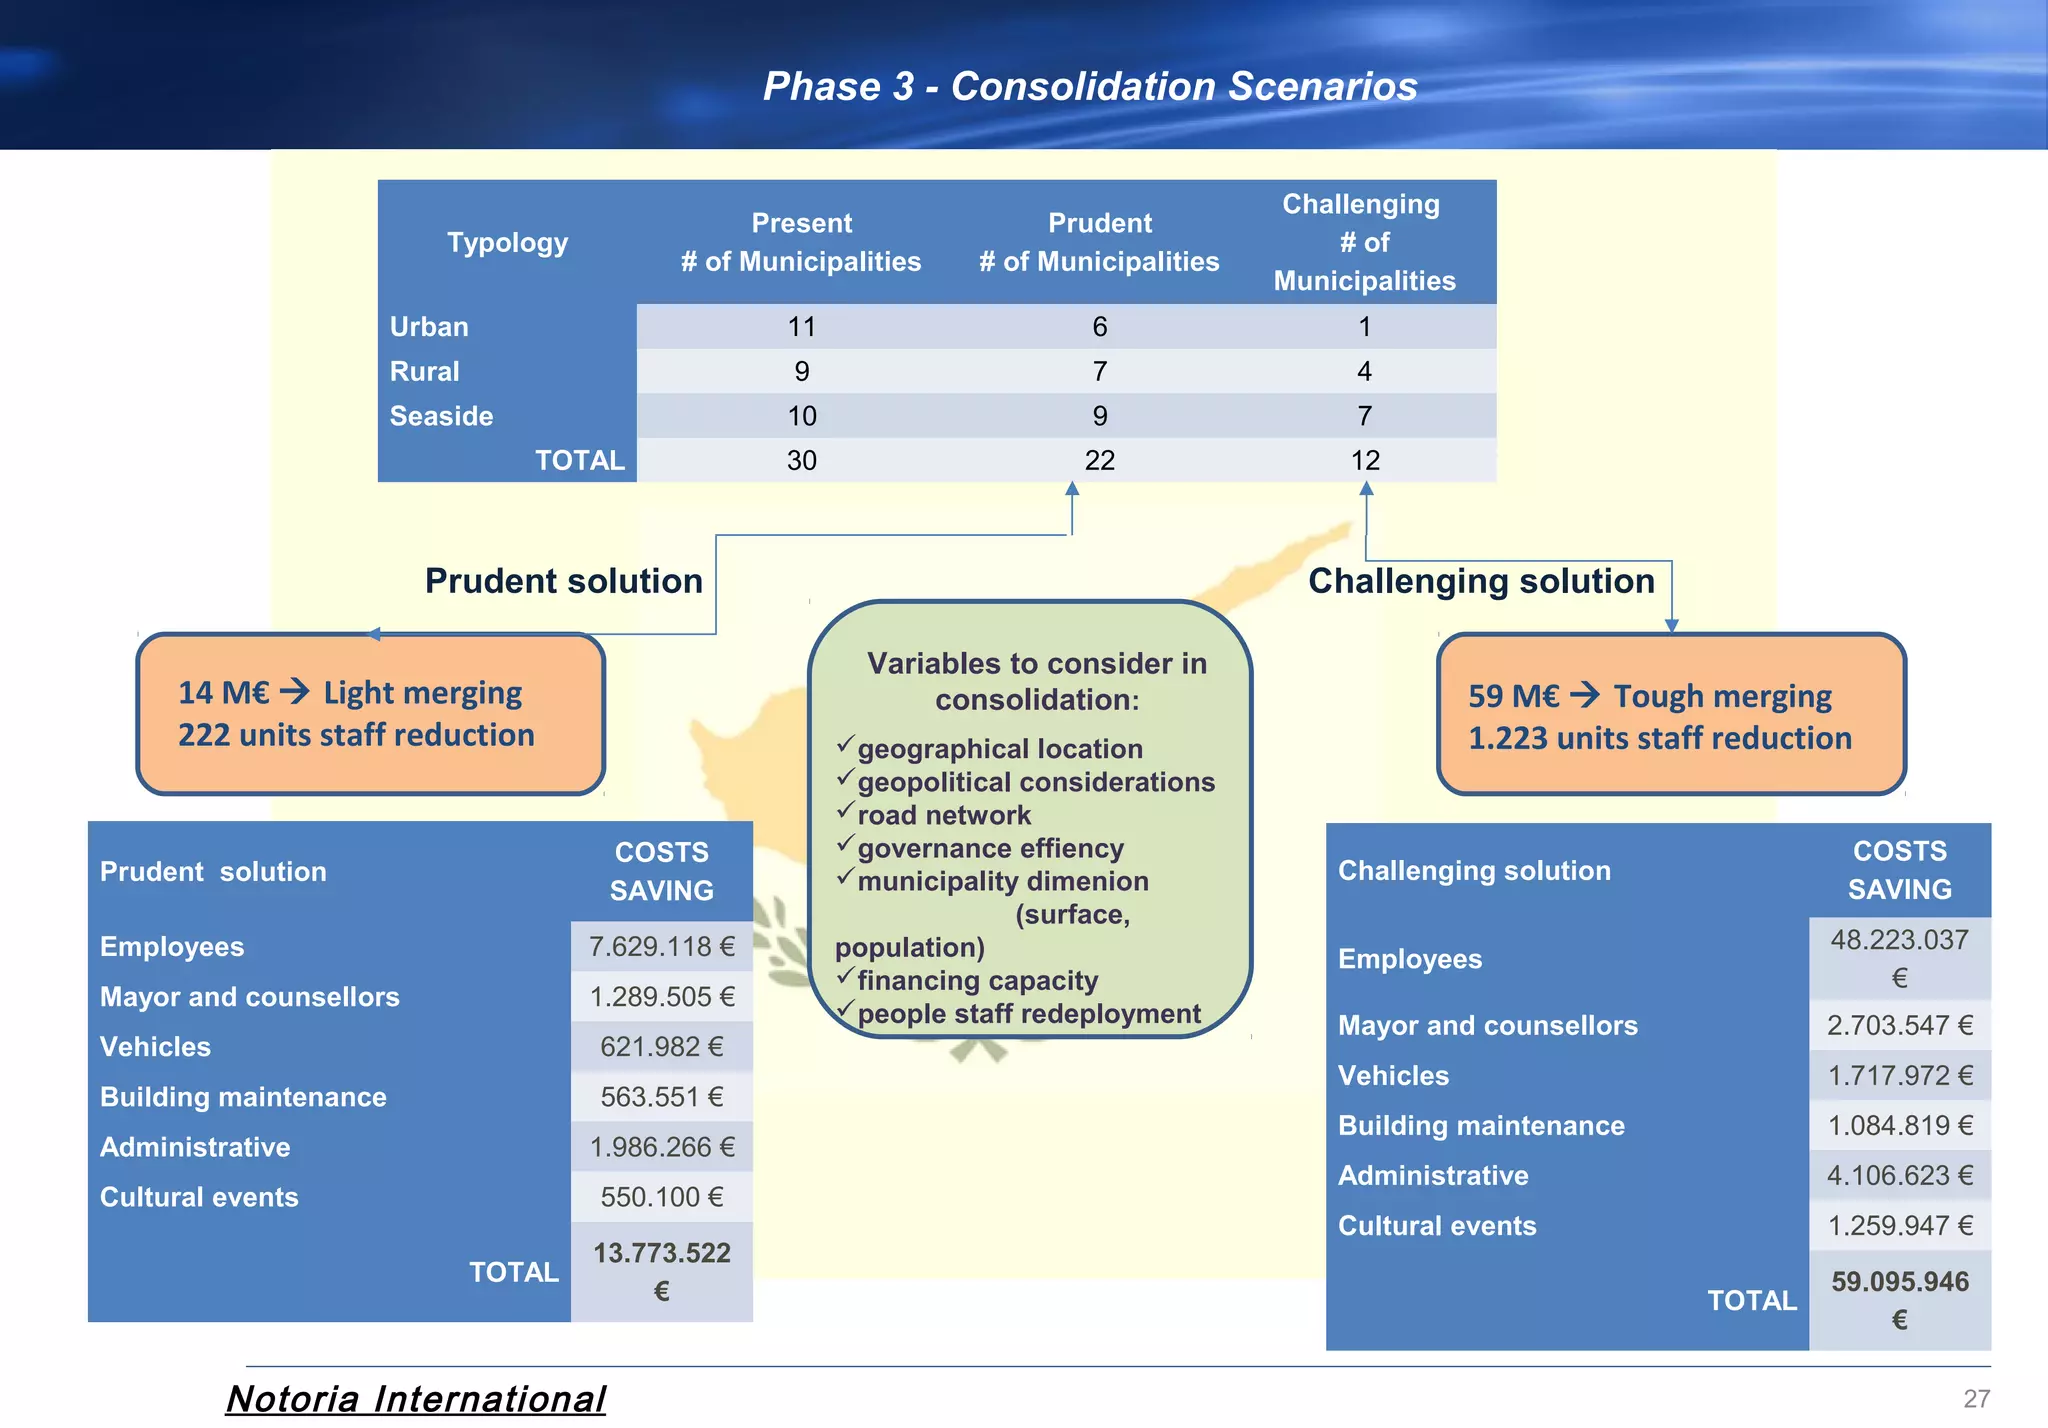
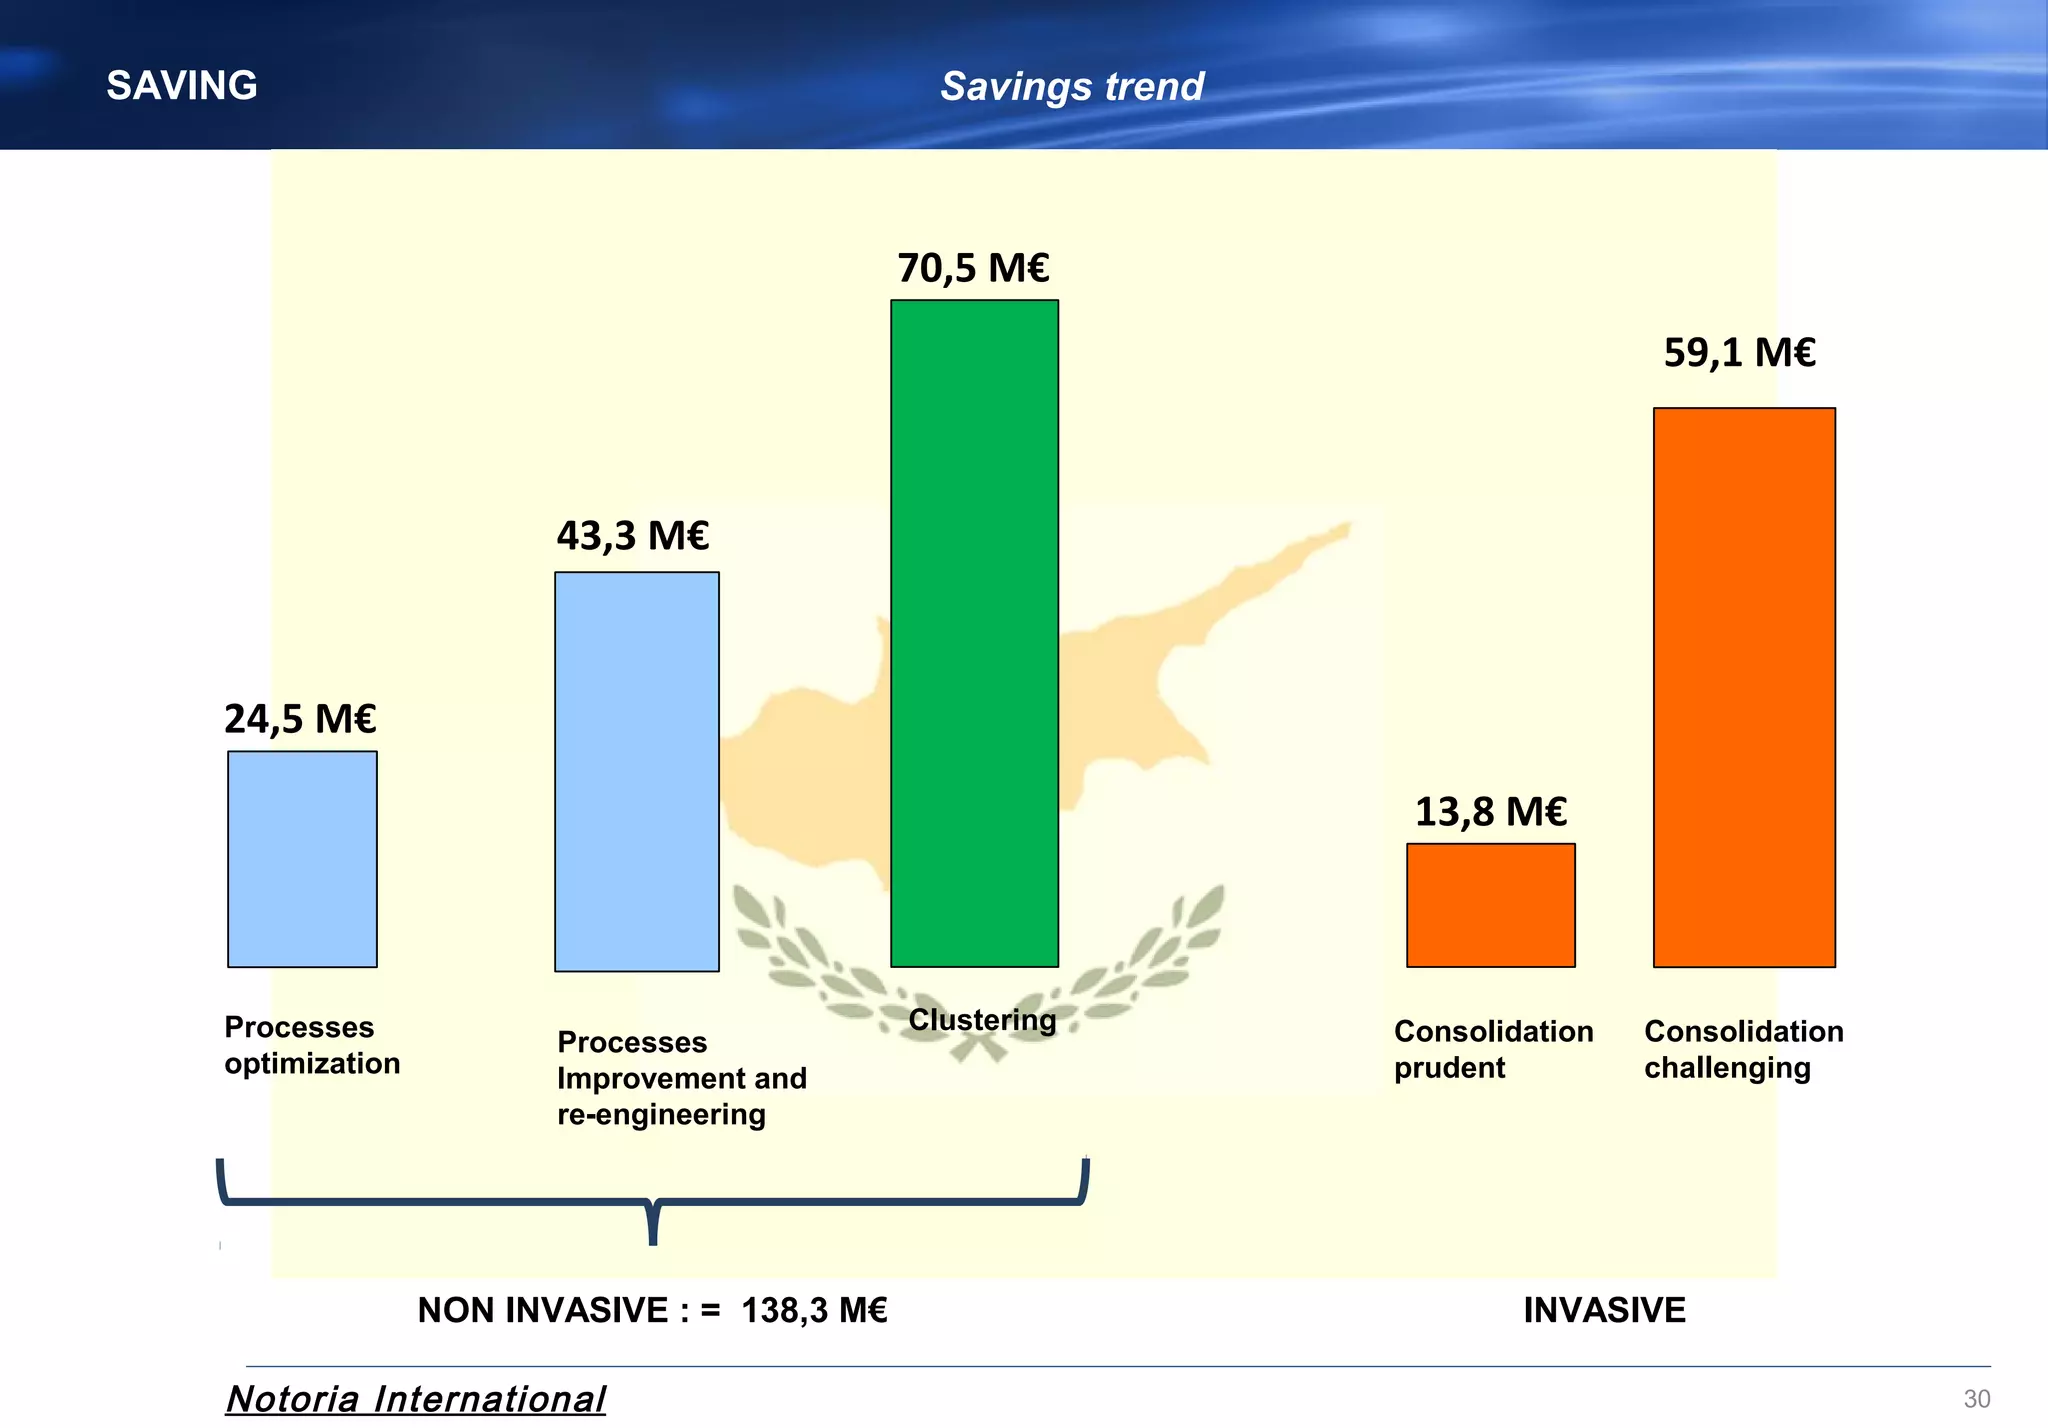
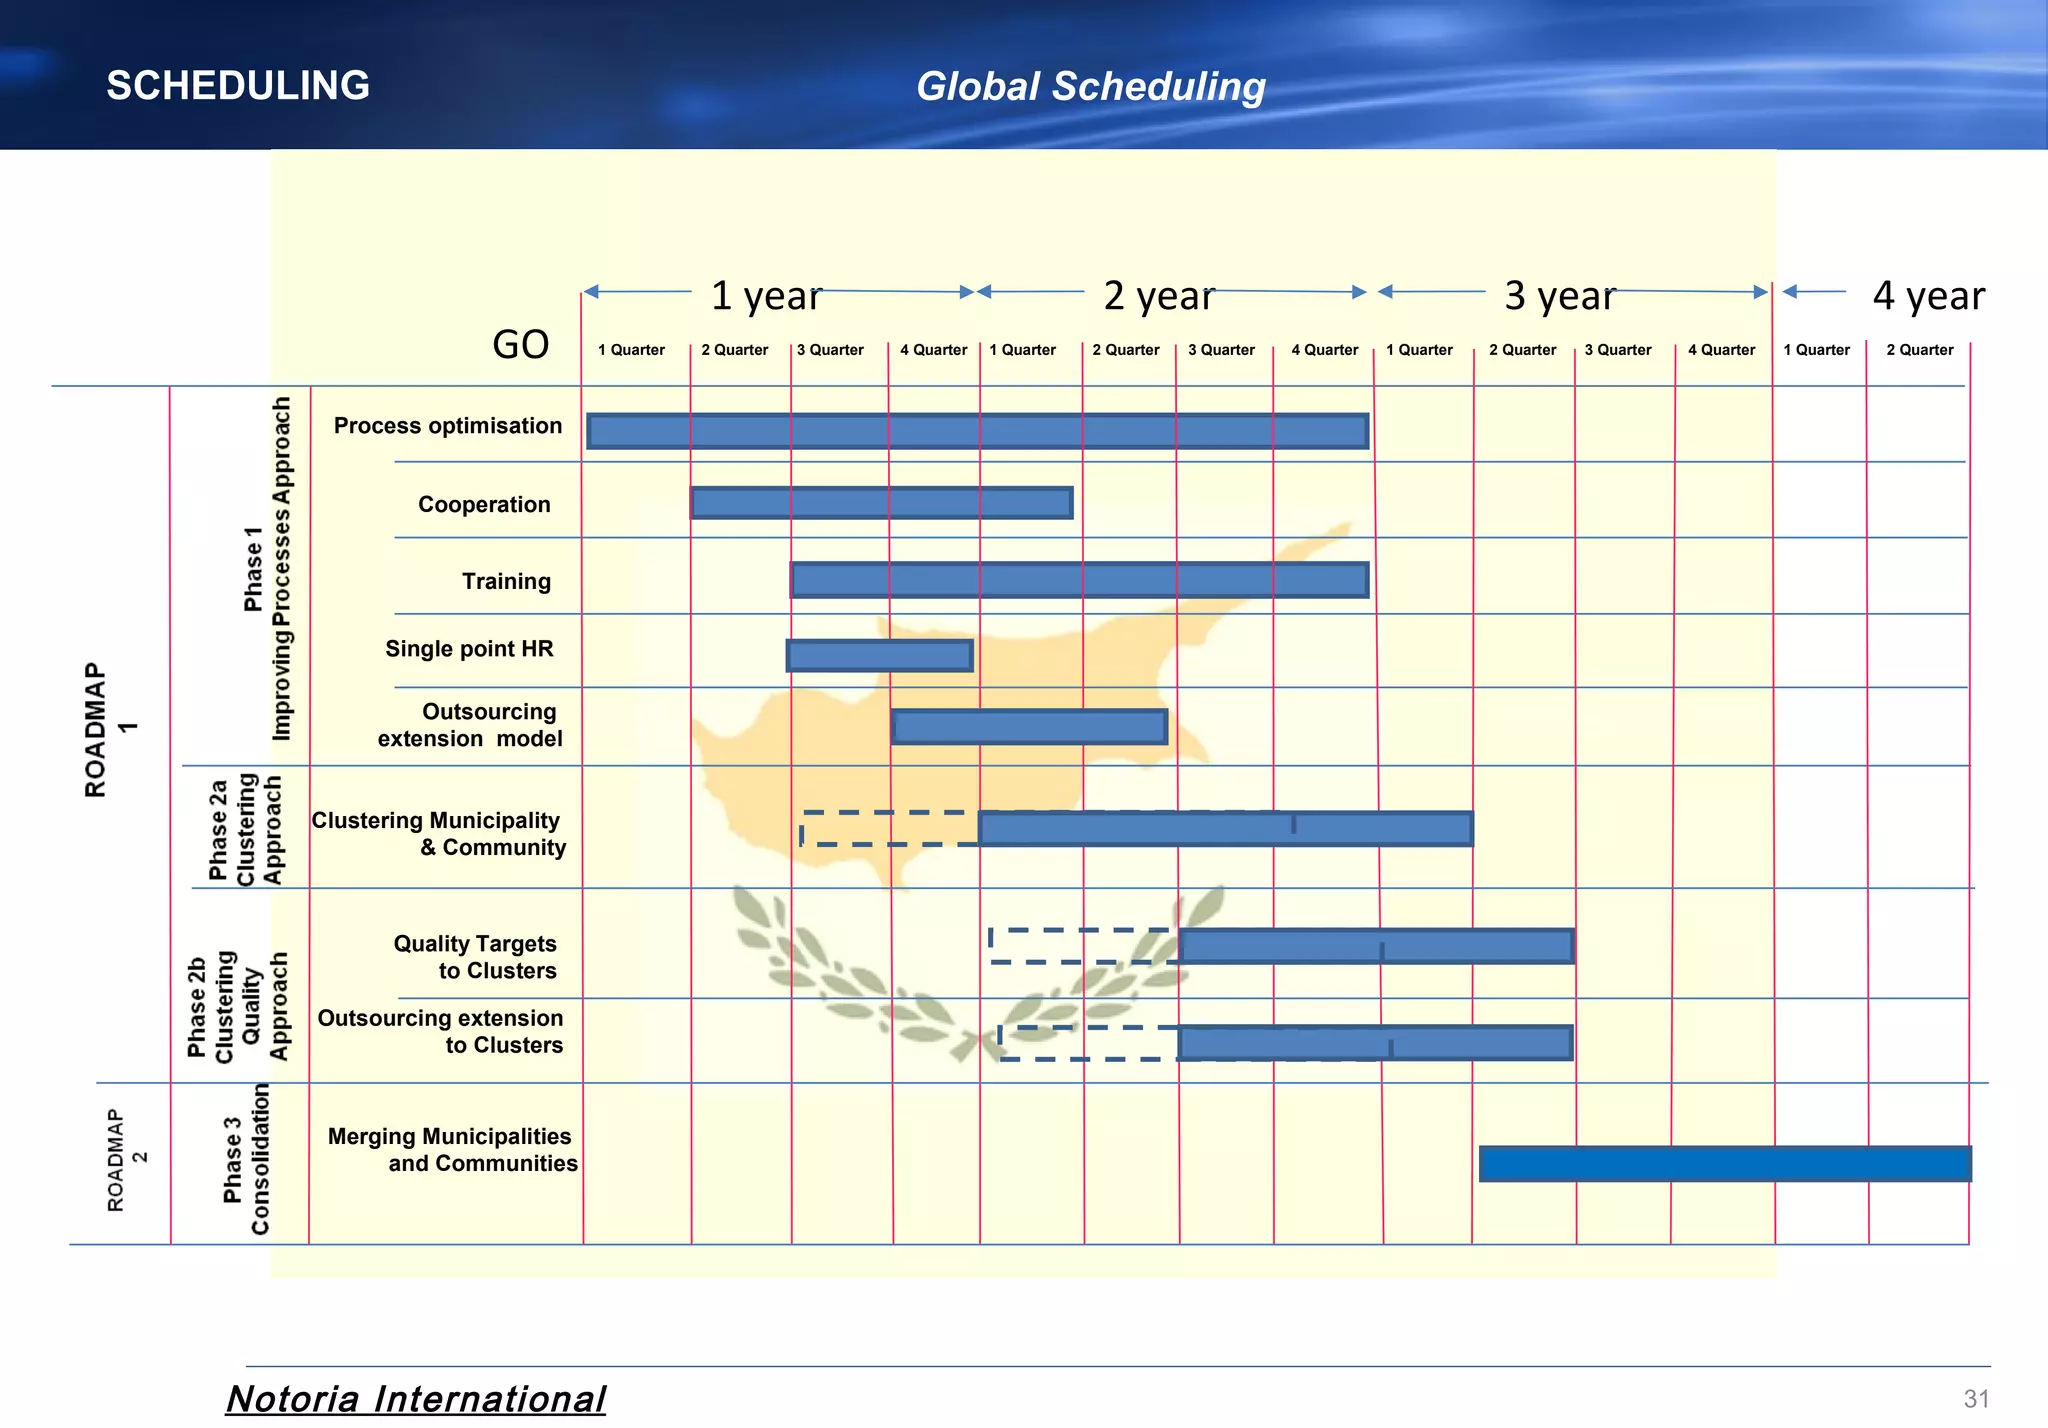

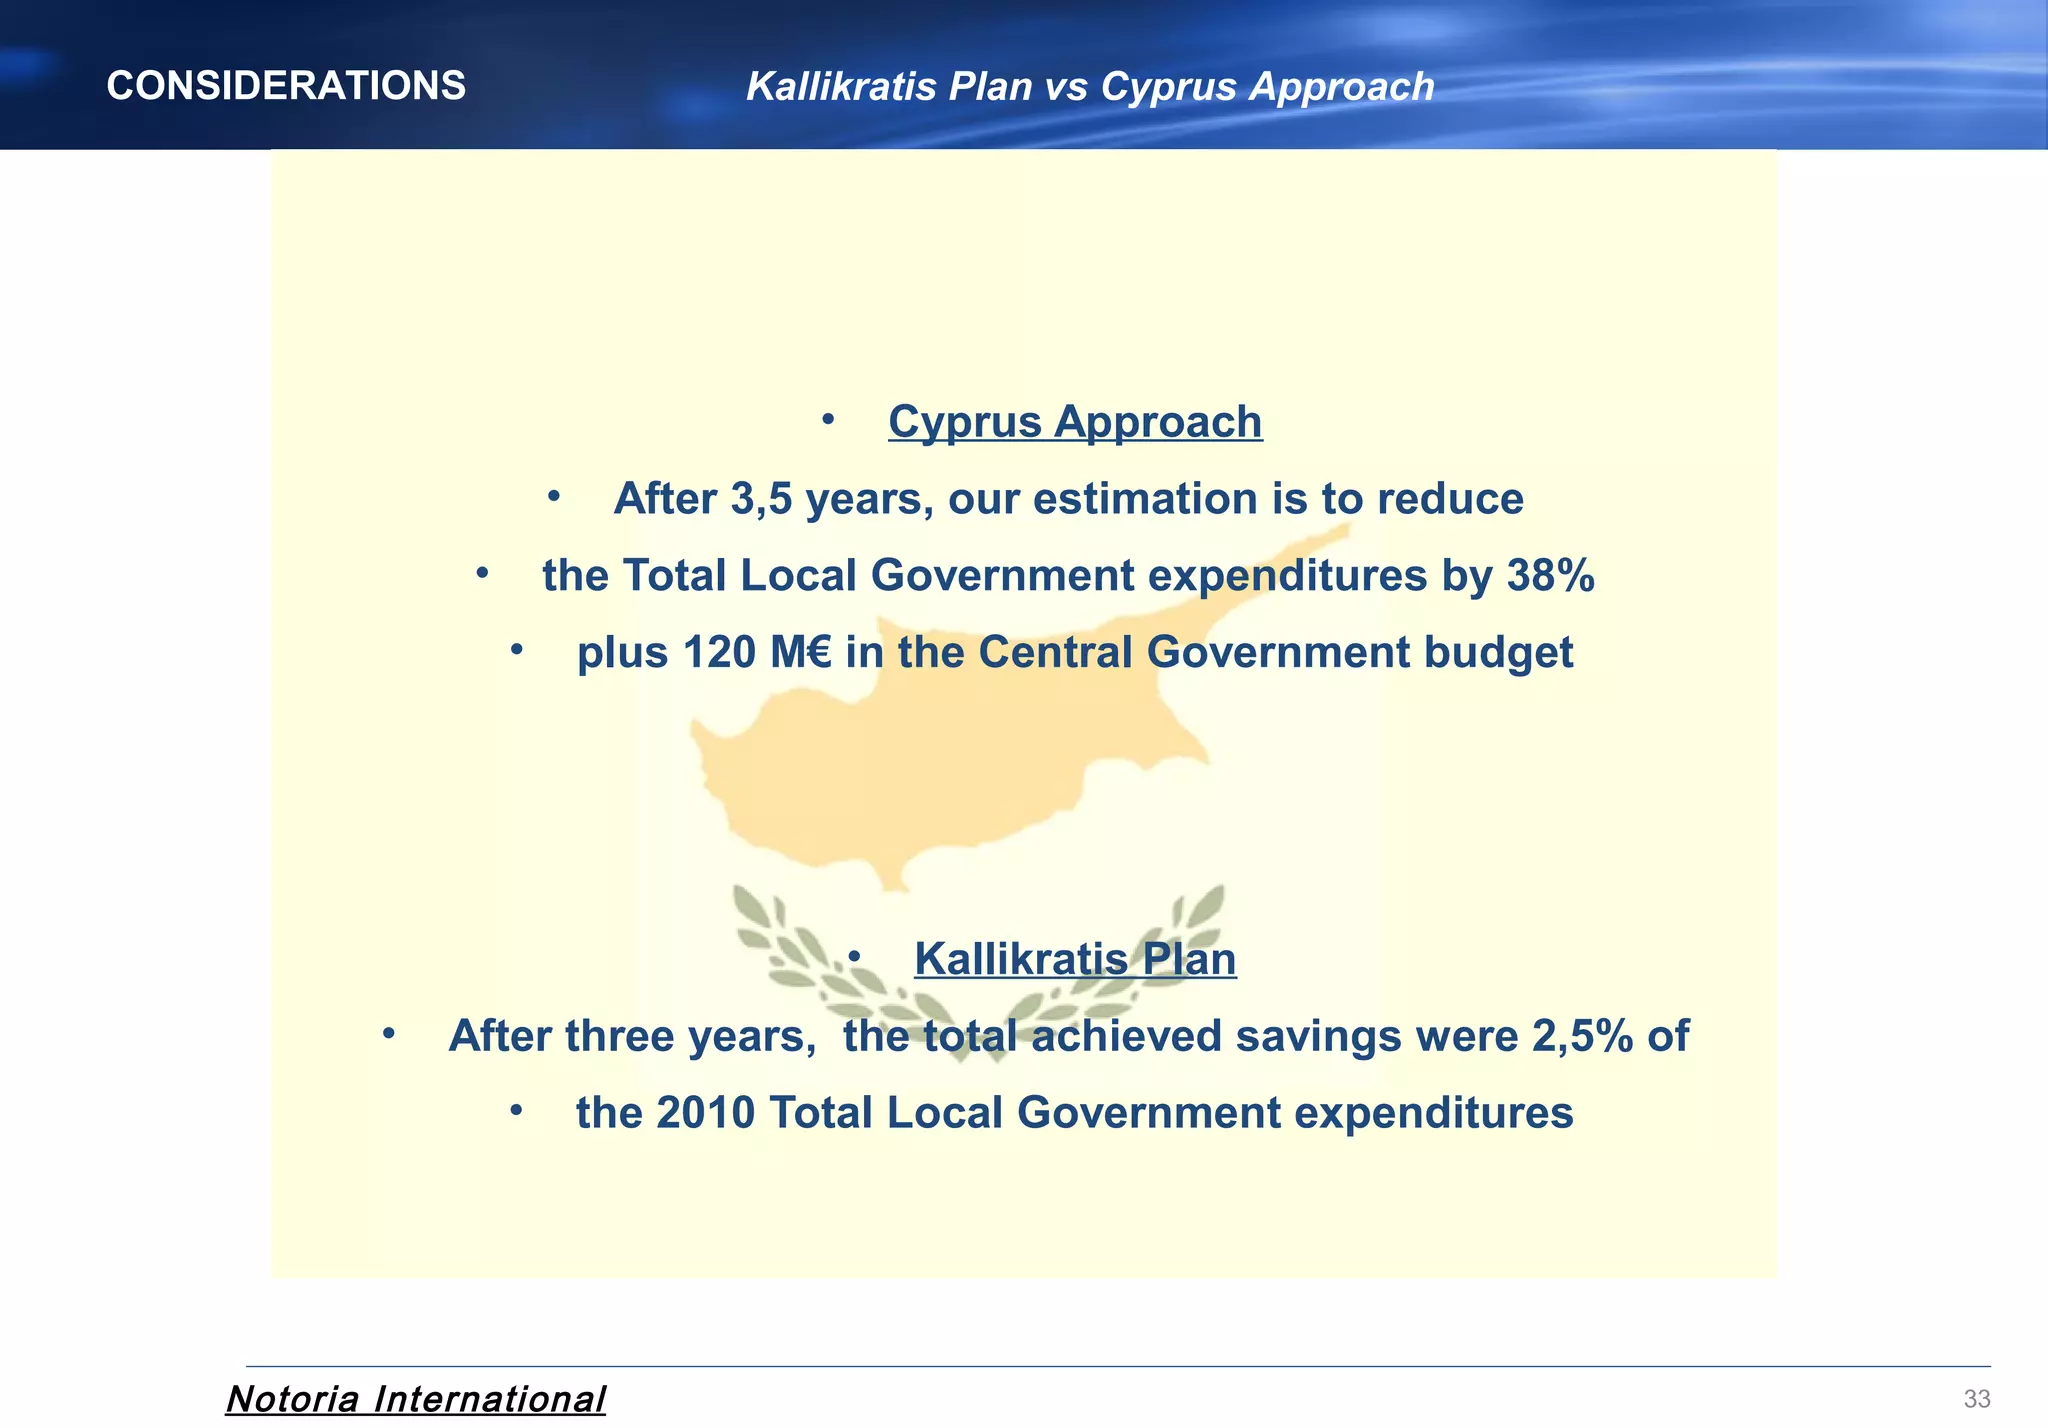
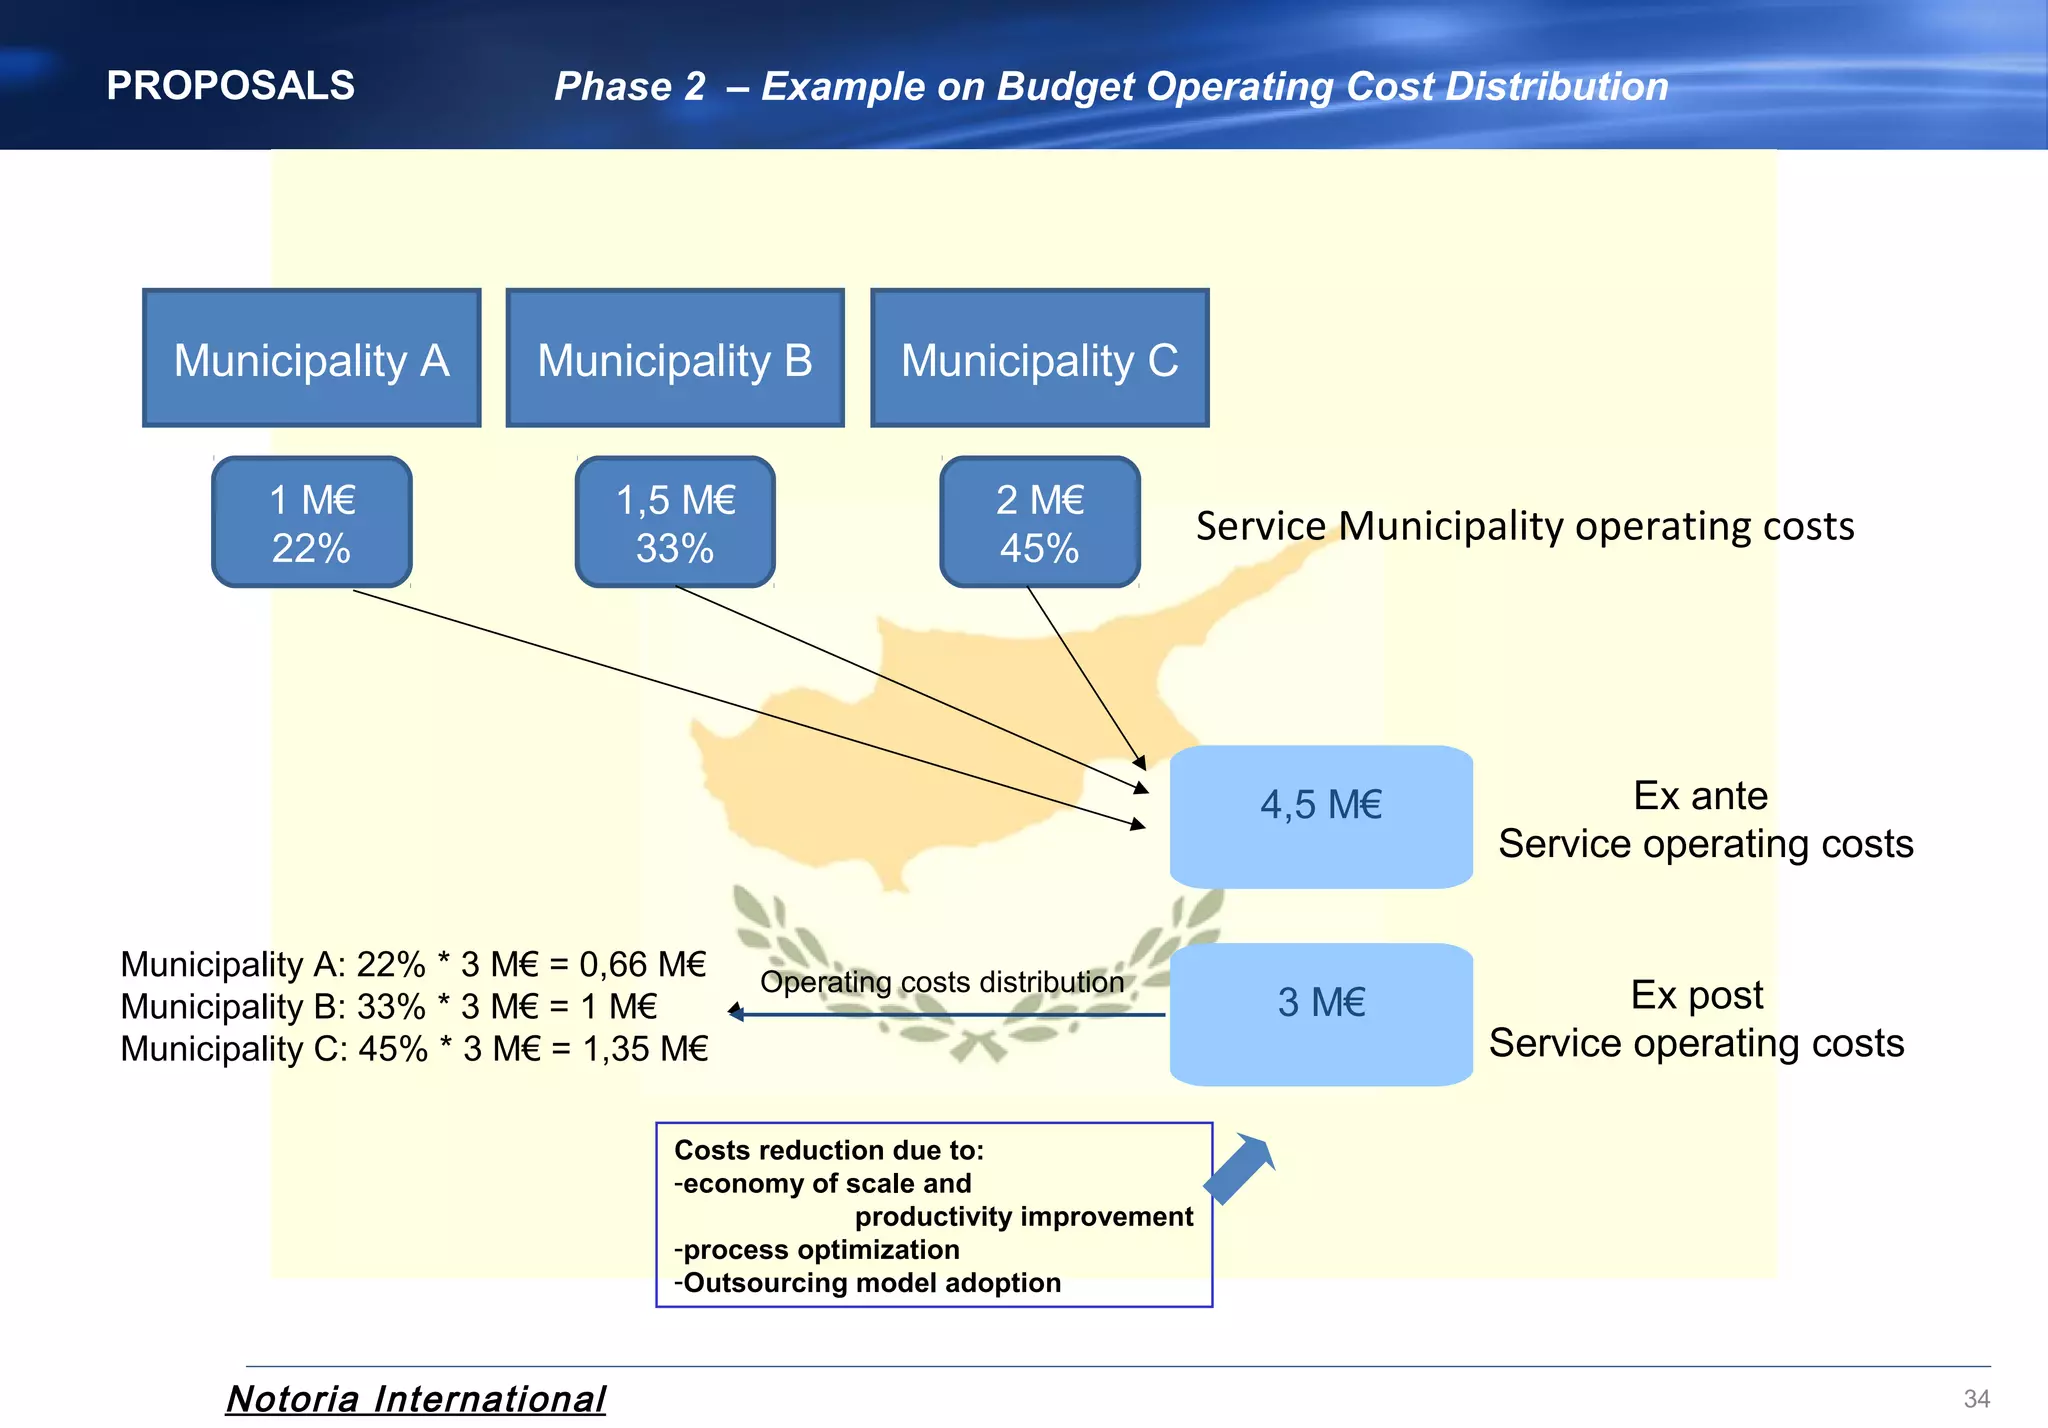
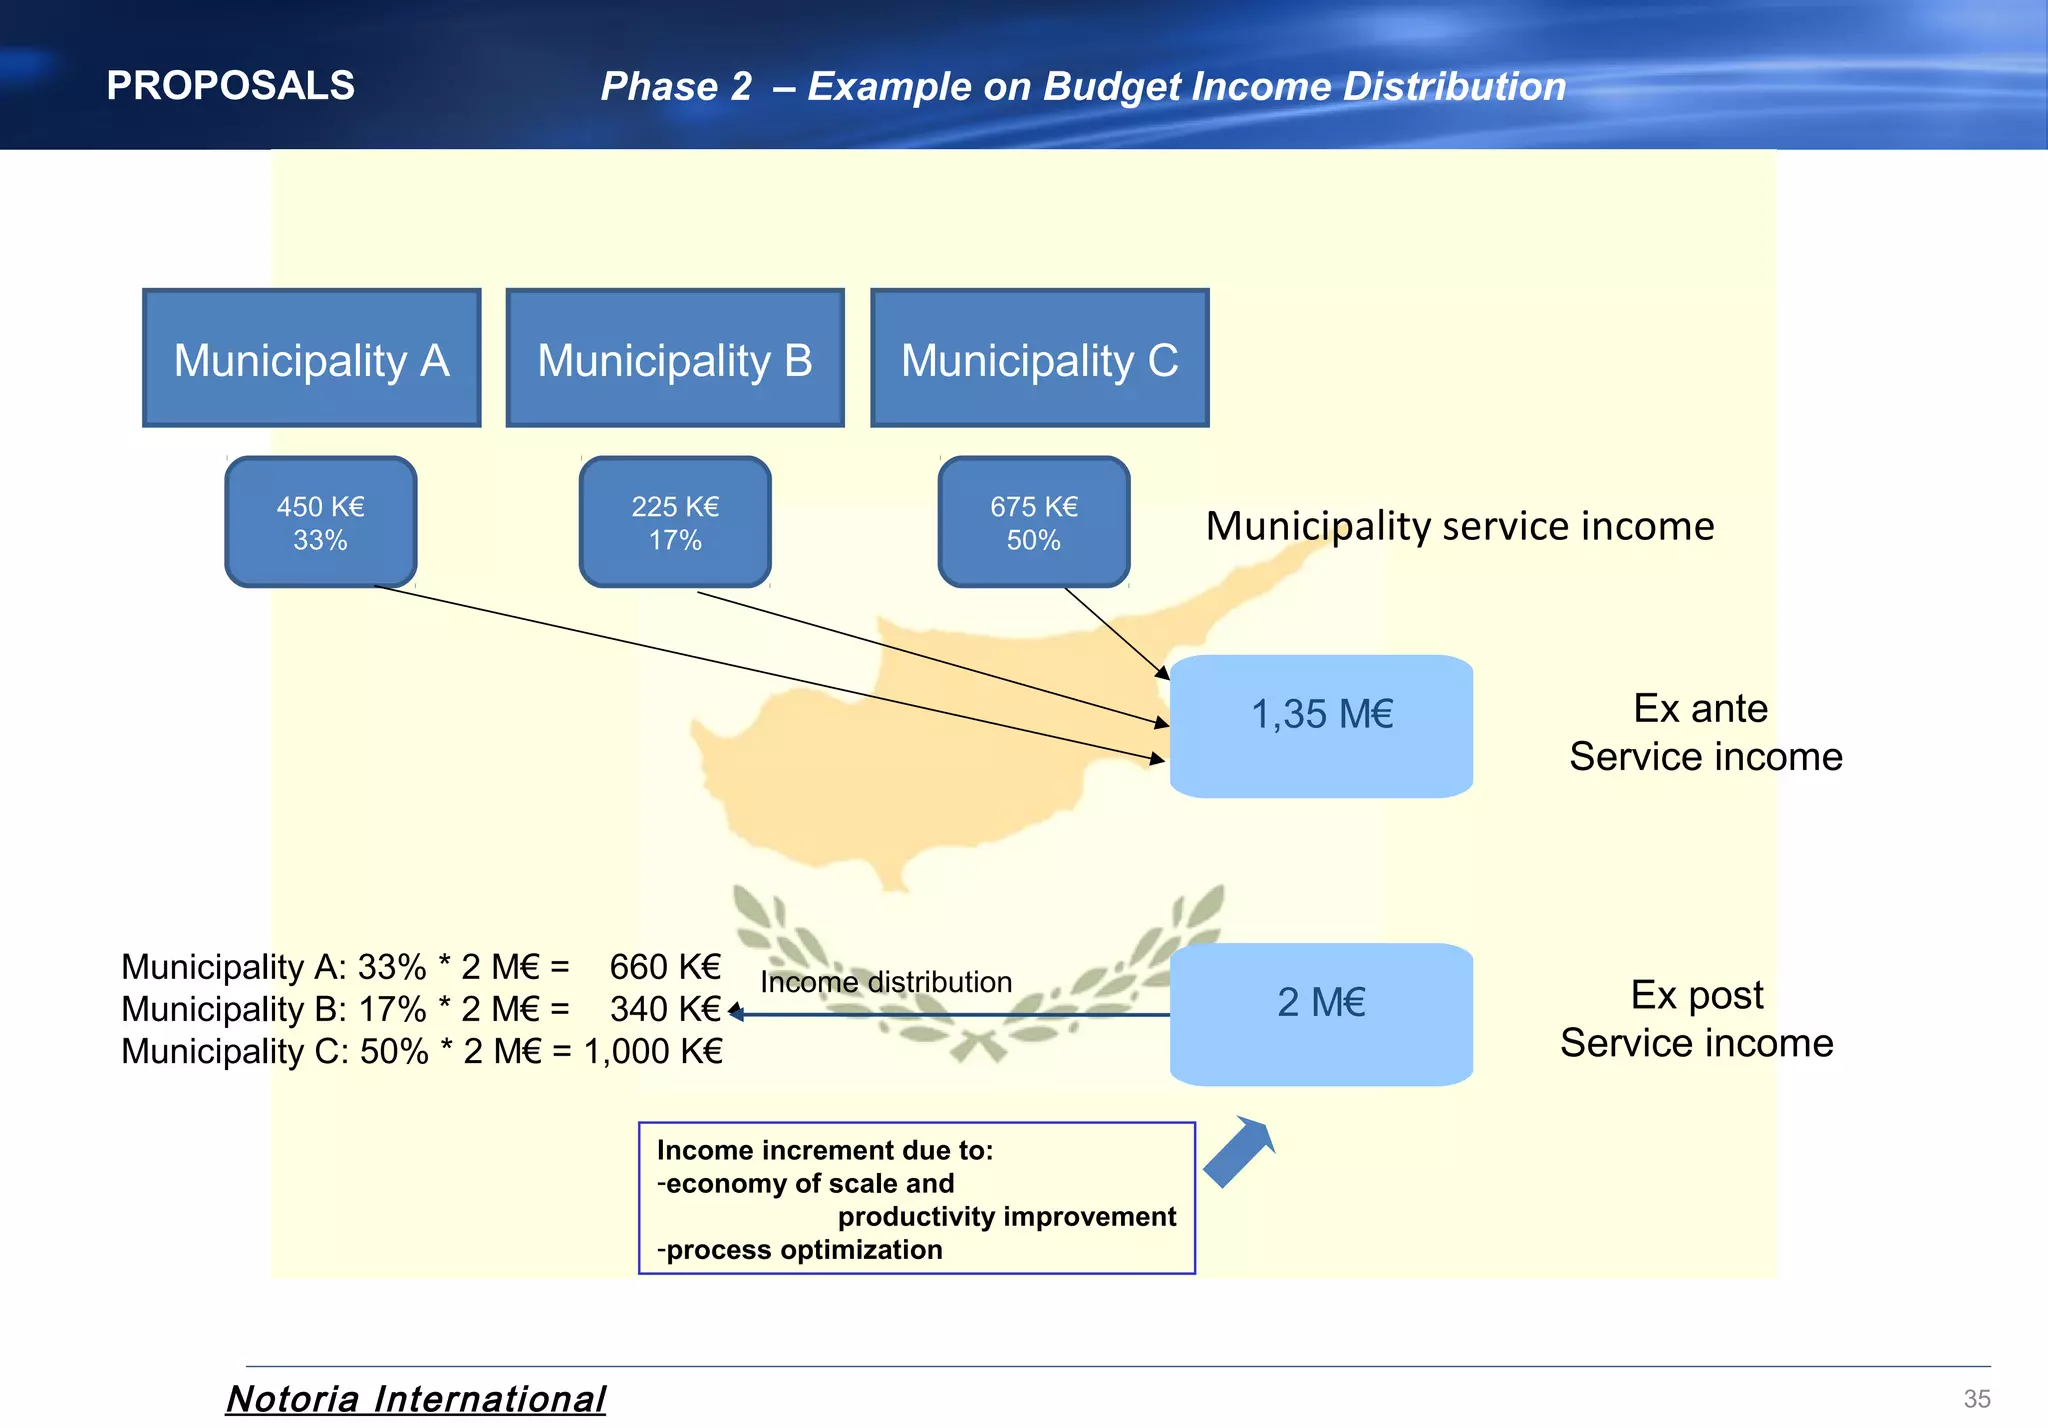
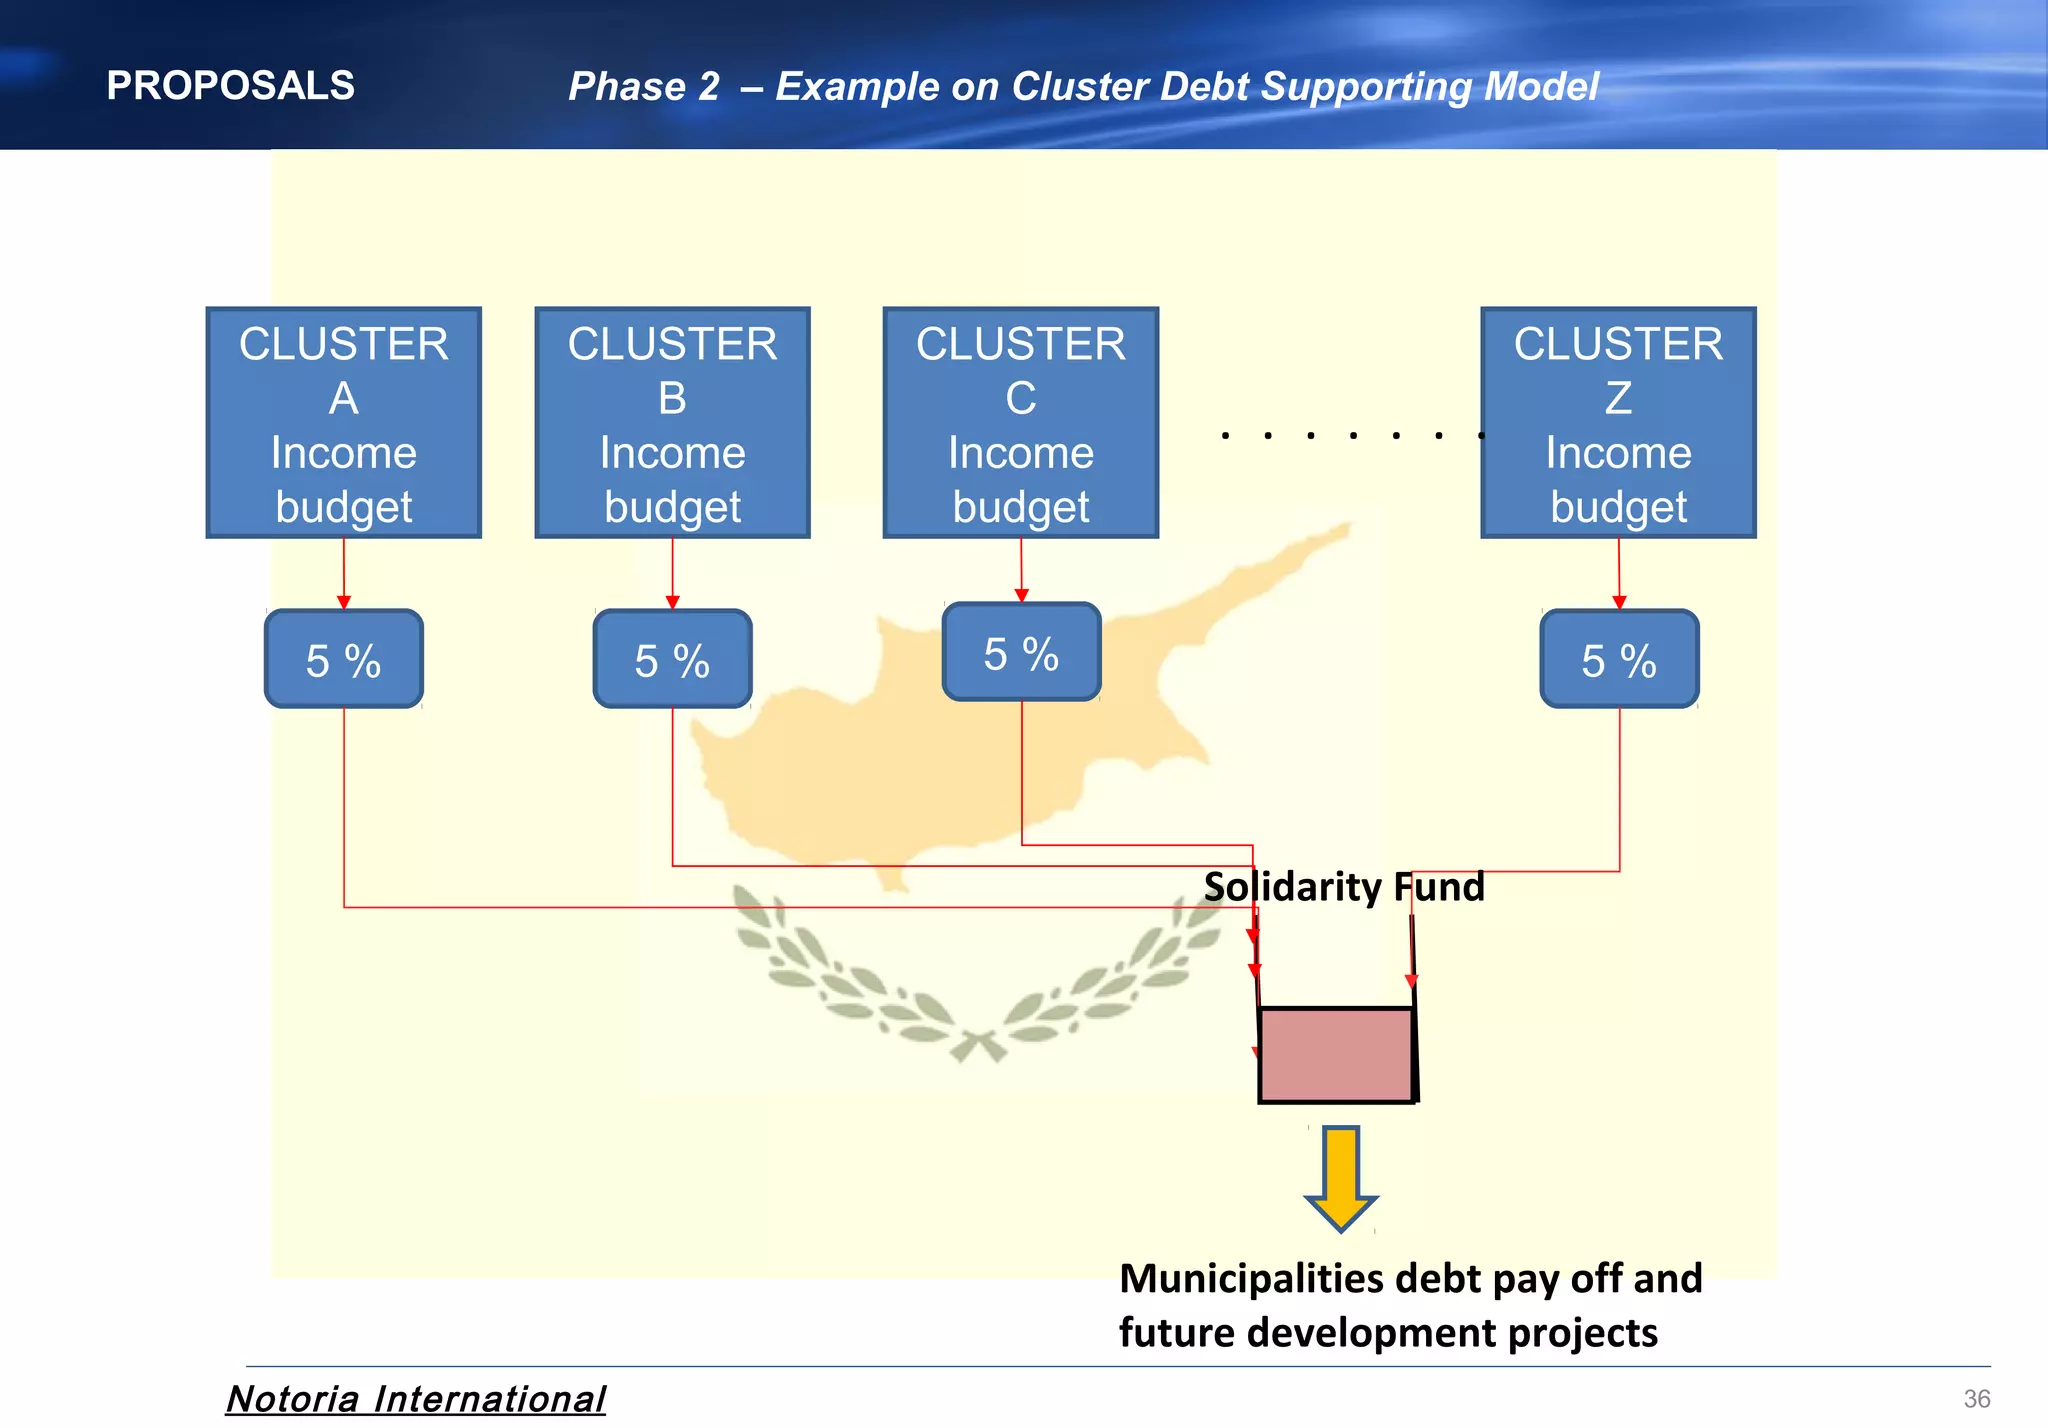

THE PROPOSAL - The proposal suggests optimizing processes, improving quality of services, and reducing operating costs for municipalities through Lean Six Sigma and clustering municipalities. THE ITALIAN APPROACH - The approach involves 3 phases: 1) optimizing processes, 2) cooperation between municipalities and communities through resource sharing, and 3) clustering municipalities and communities to consolidate services and reduce costs. THE SAVINGS - Clustering could save between 16-43 million Euros annually, reducing operating costs by 4-12%. The best scenario would cluster 40-50 municipalities and communities and save 36 million.


