Download to read offline

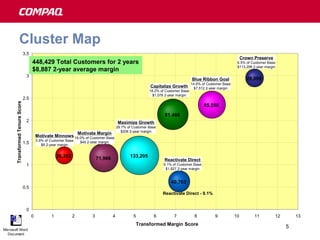

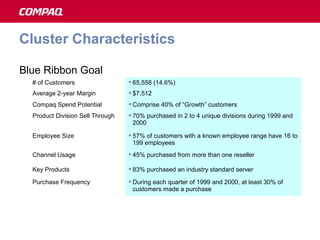


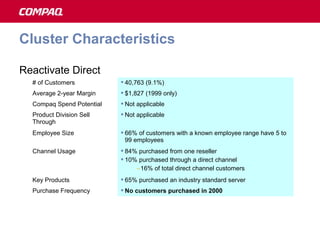
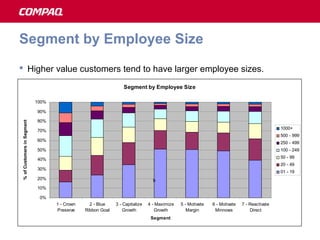
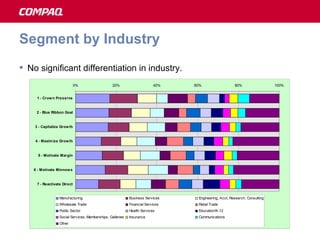
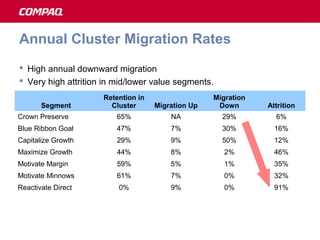

The document discusses a customer value segmentation project for NA commercial customers. It aims to define value-based customer segments, understand marketing opportunities, and create a repeatable segmentation process. Seven customer segments were identified based on dimensions like margin, tenure, purchase behavior, and channel usage. The segments are highly differentiated and have clear strategic directions. Descriptions of each segment's characteristics are provided, including number of customers, average margin, spend potential, product purchases, channel usage, and purchase frequency. Charts show segmentation by employee size, industry, and annual migration rates between segments.


