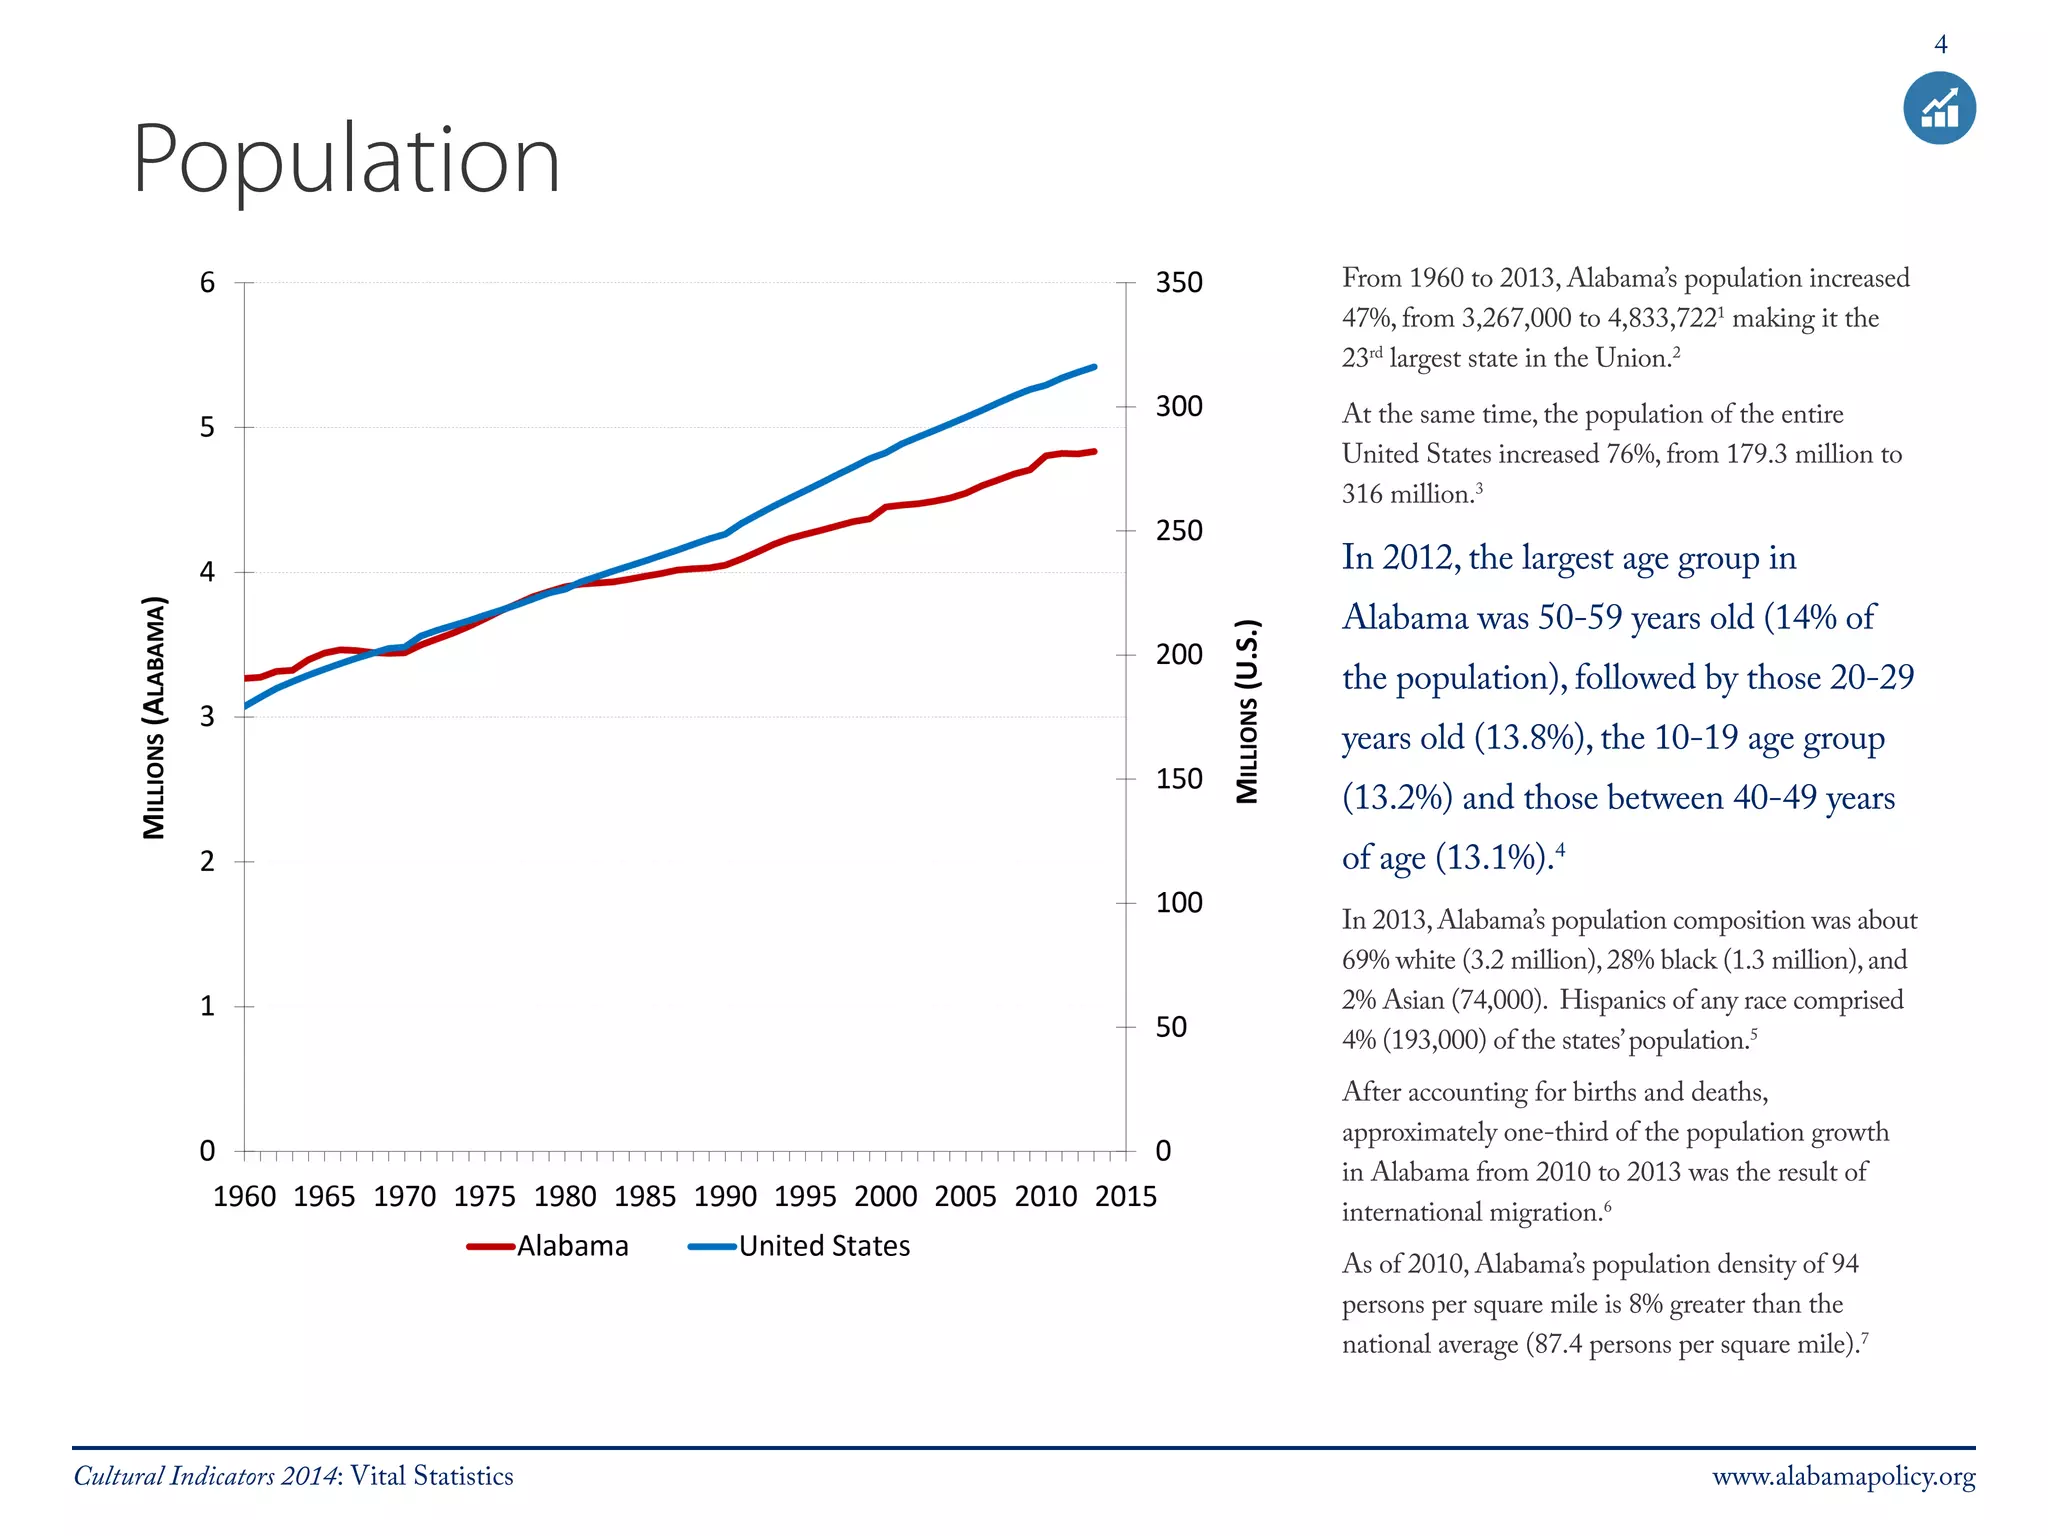
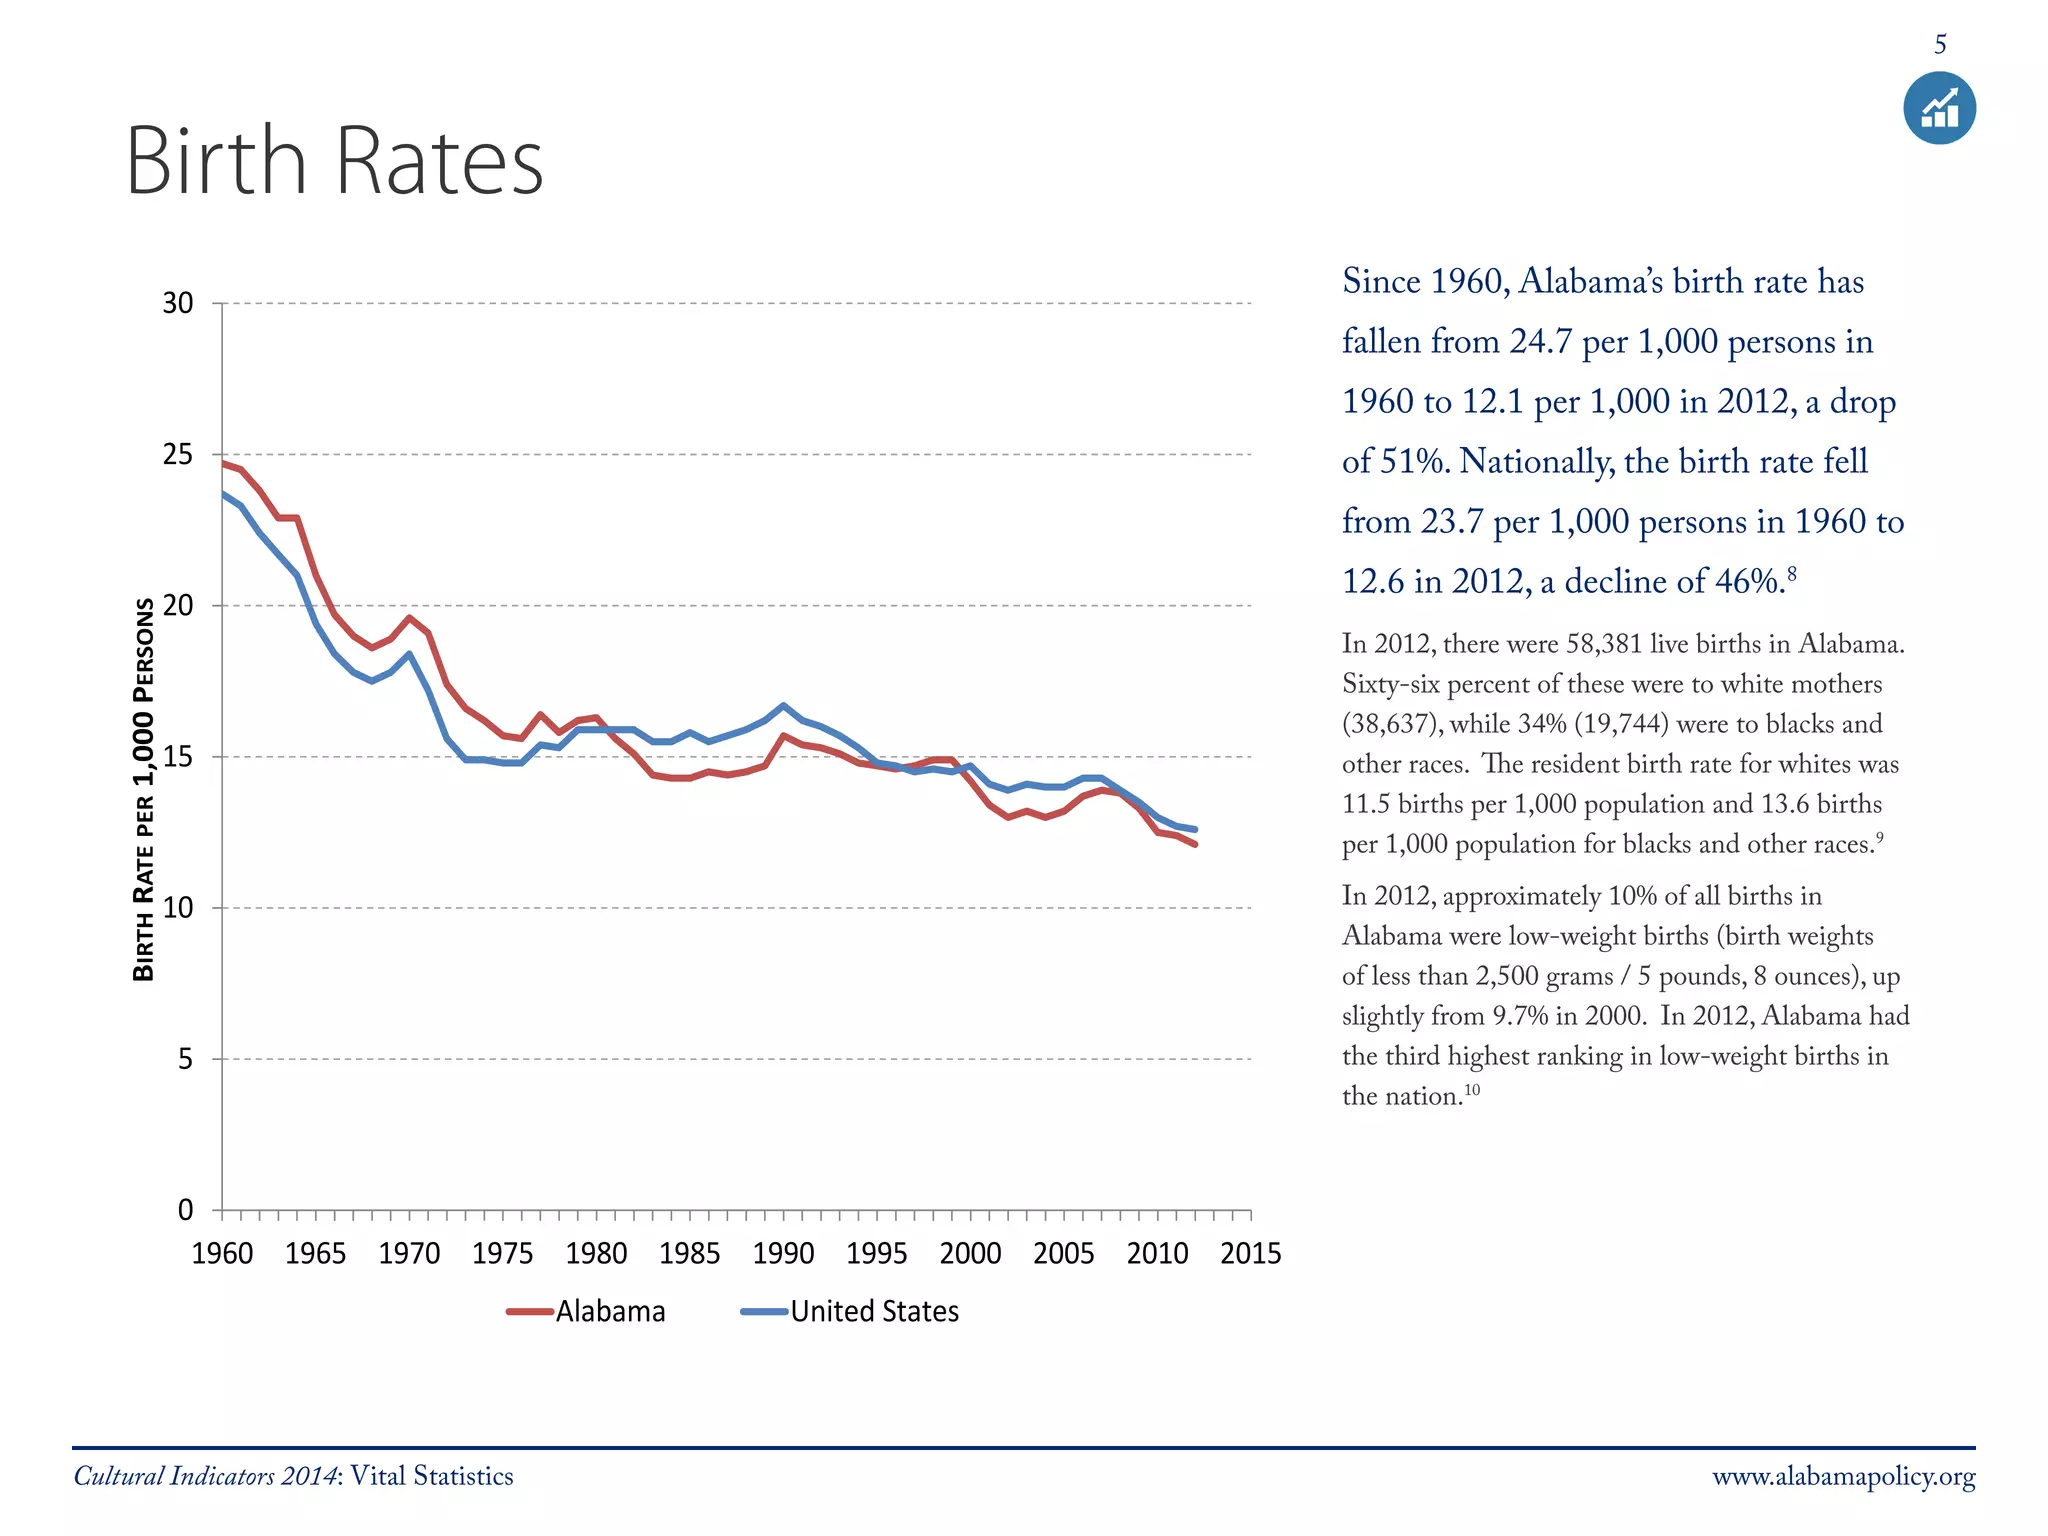
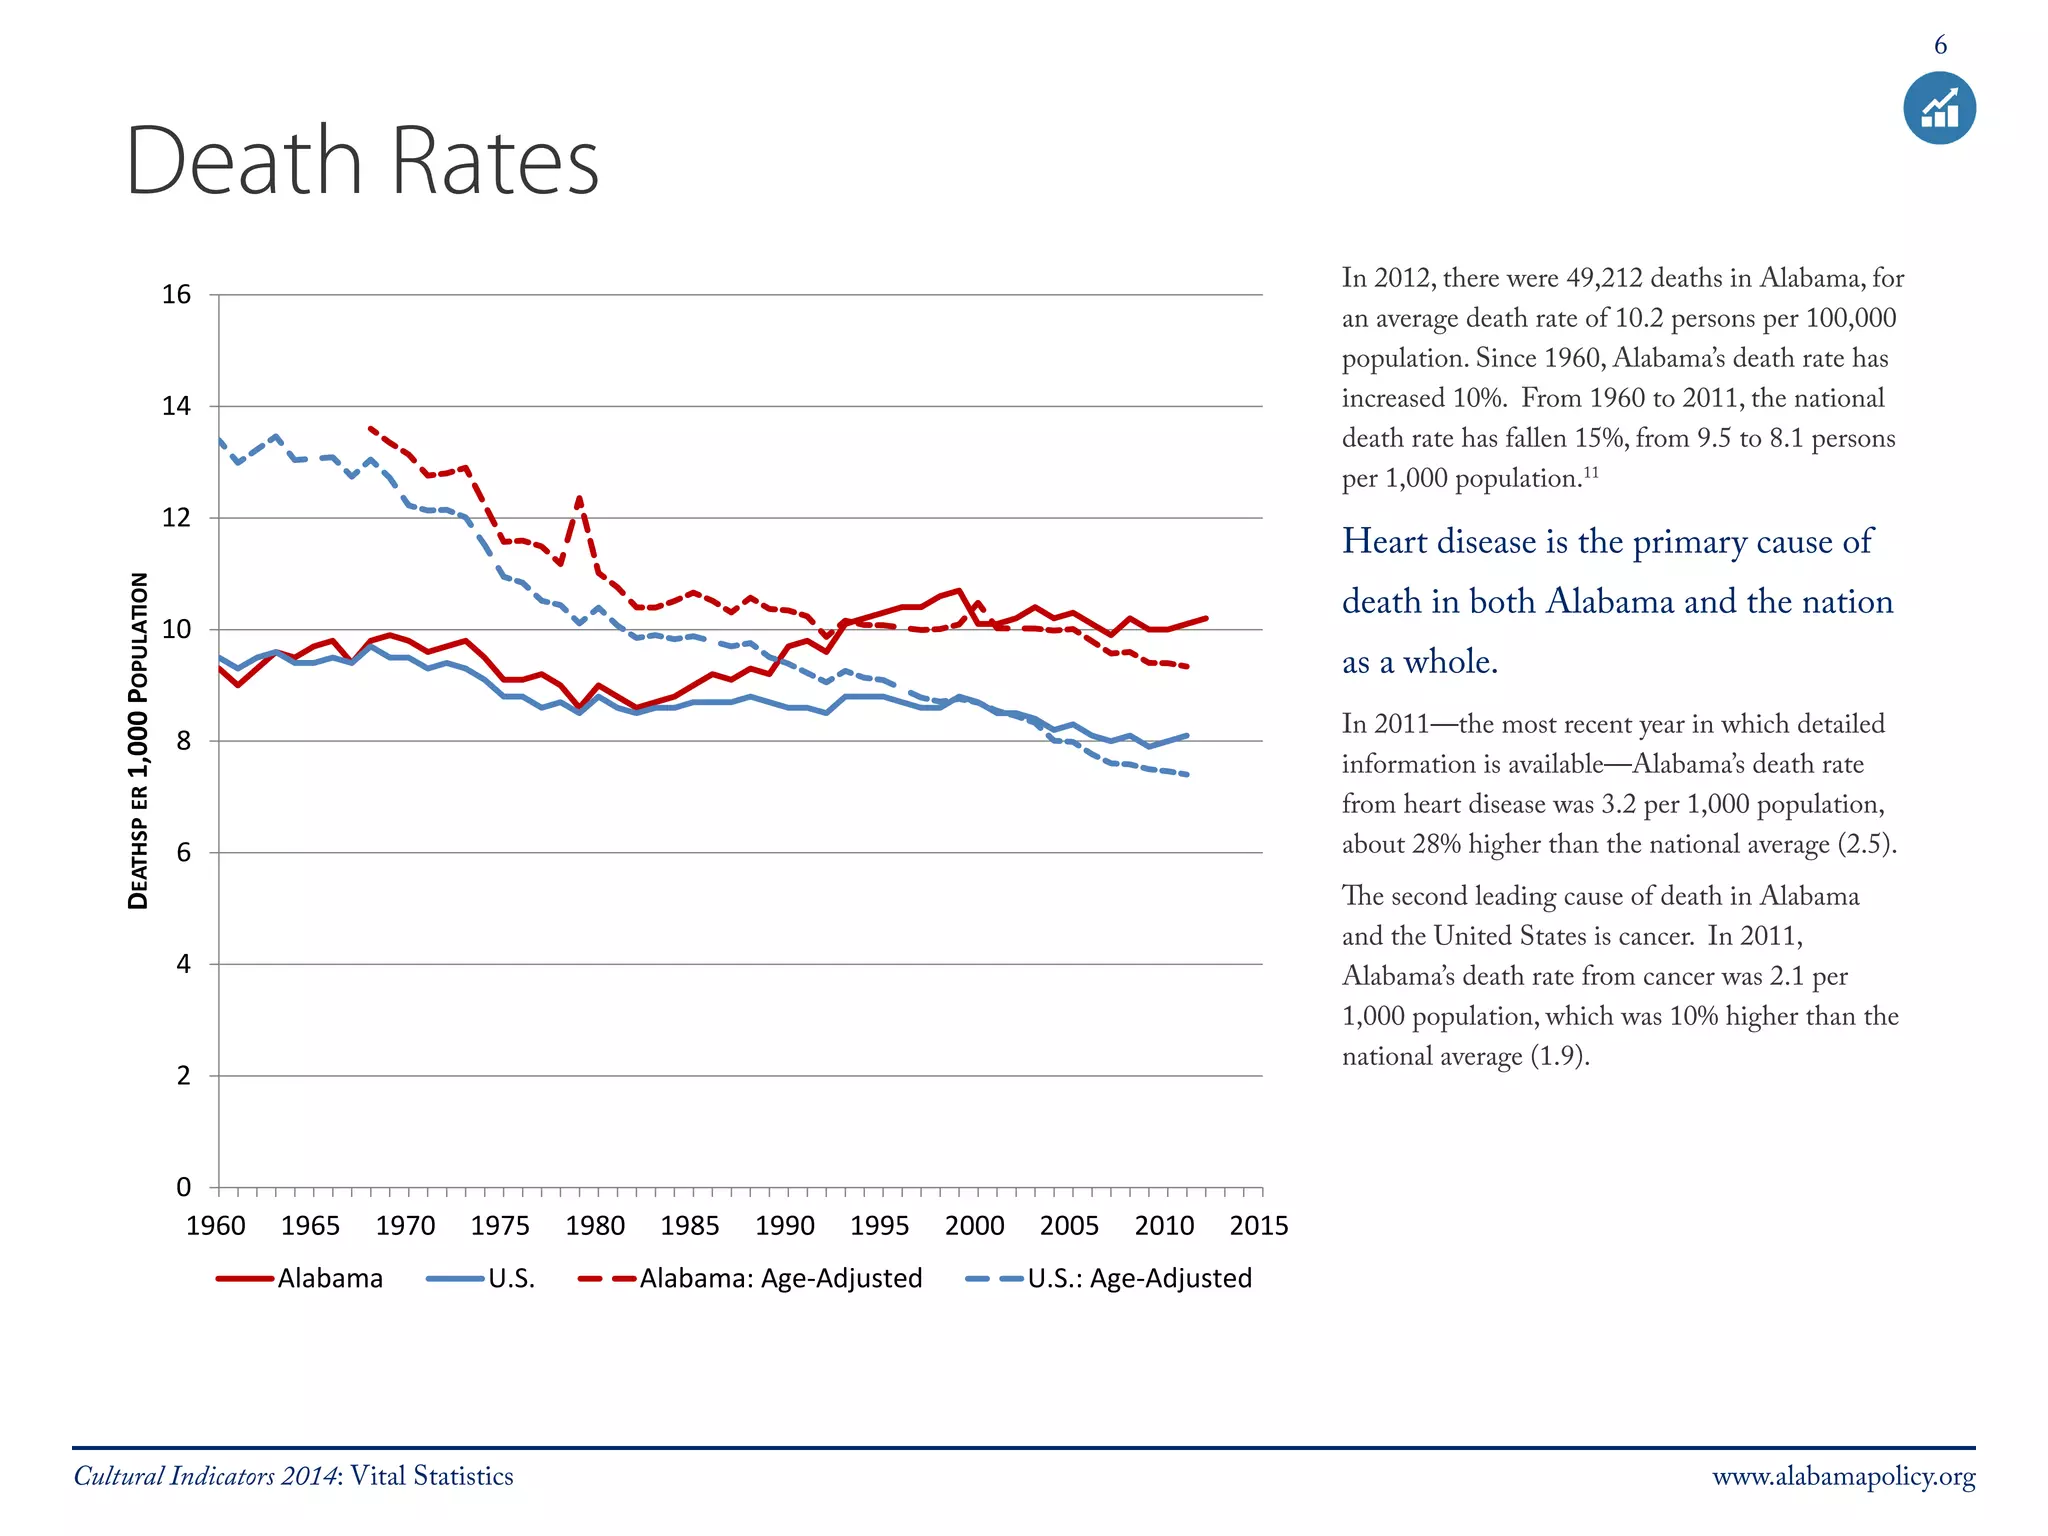
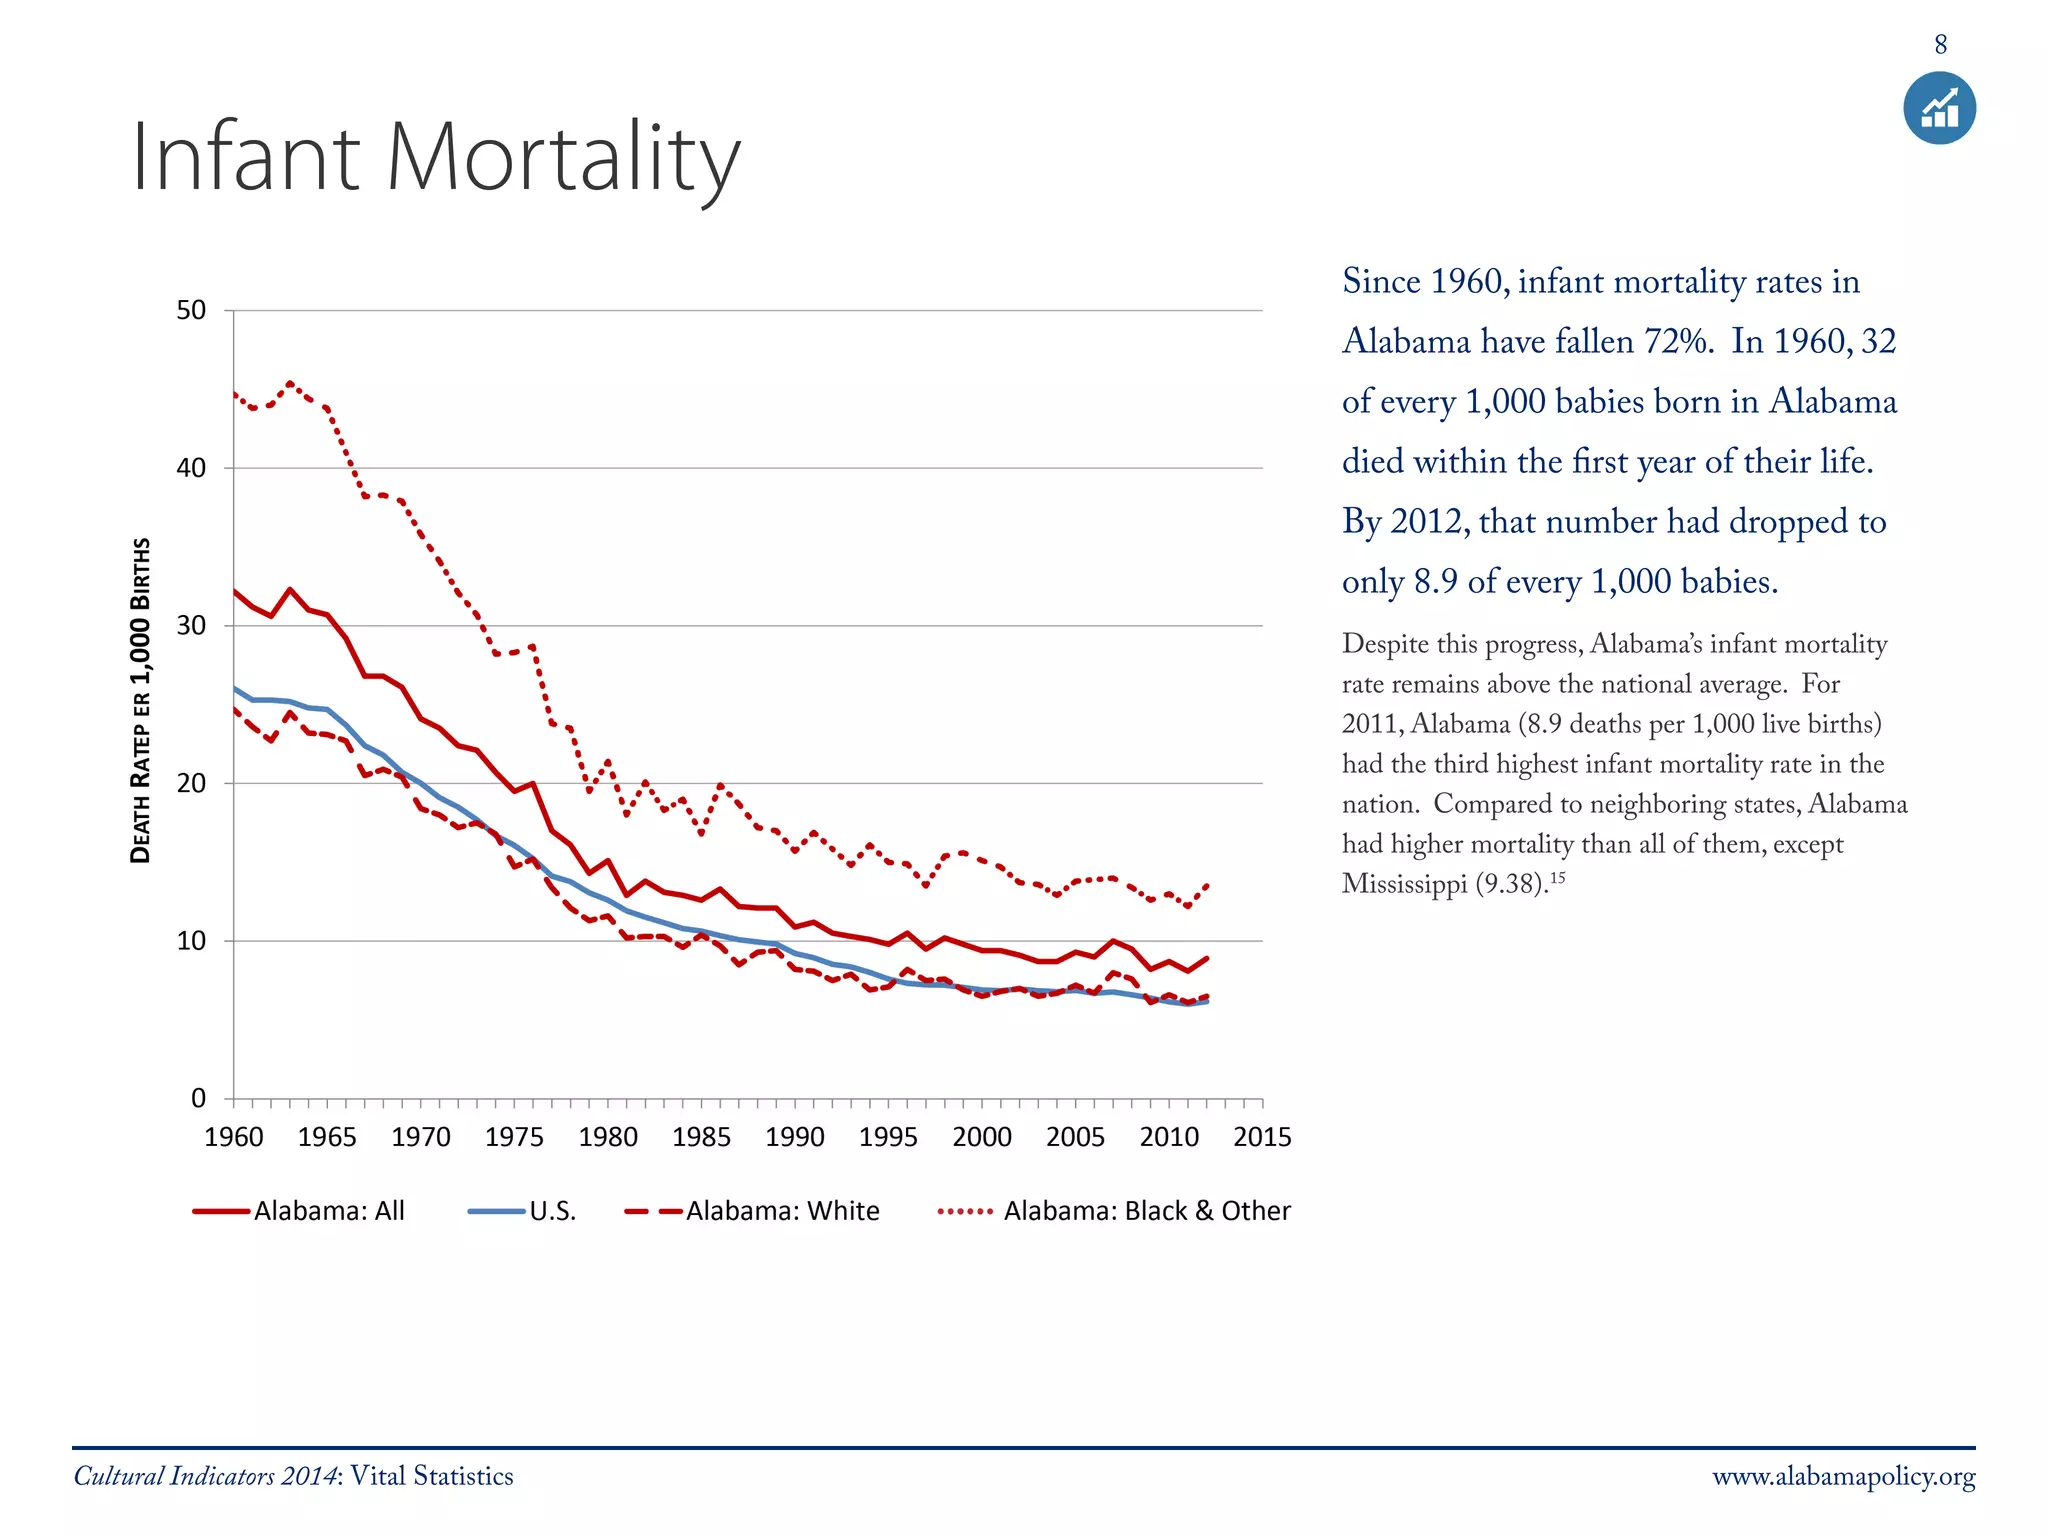
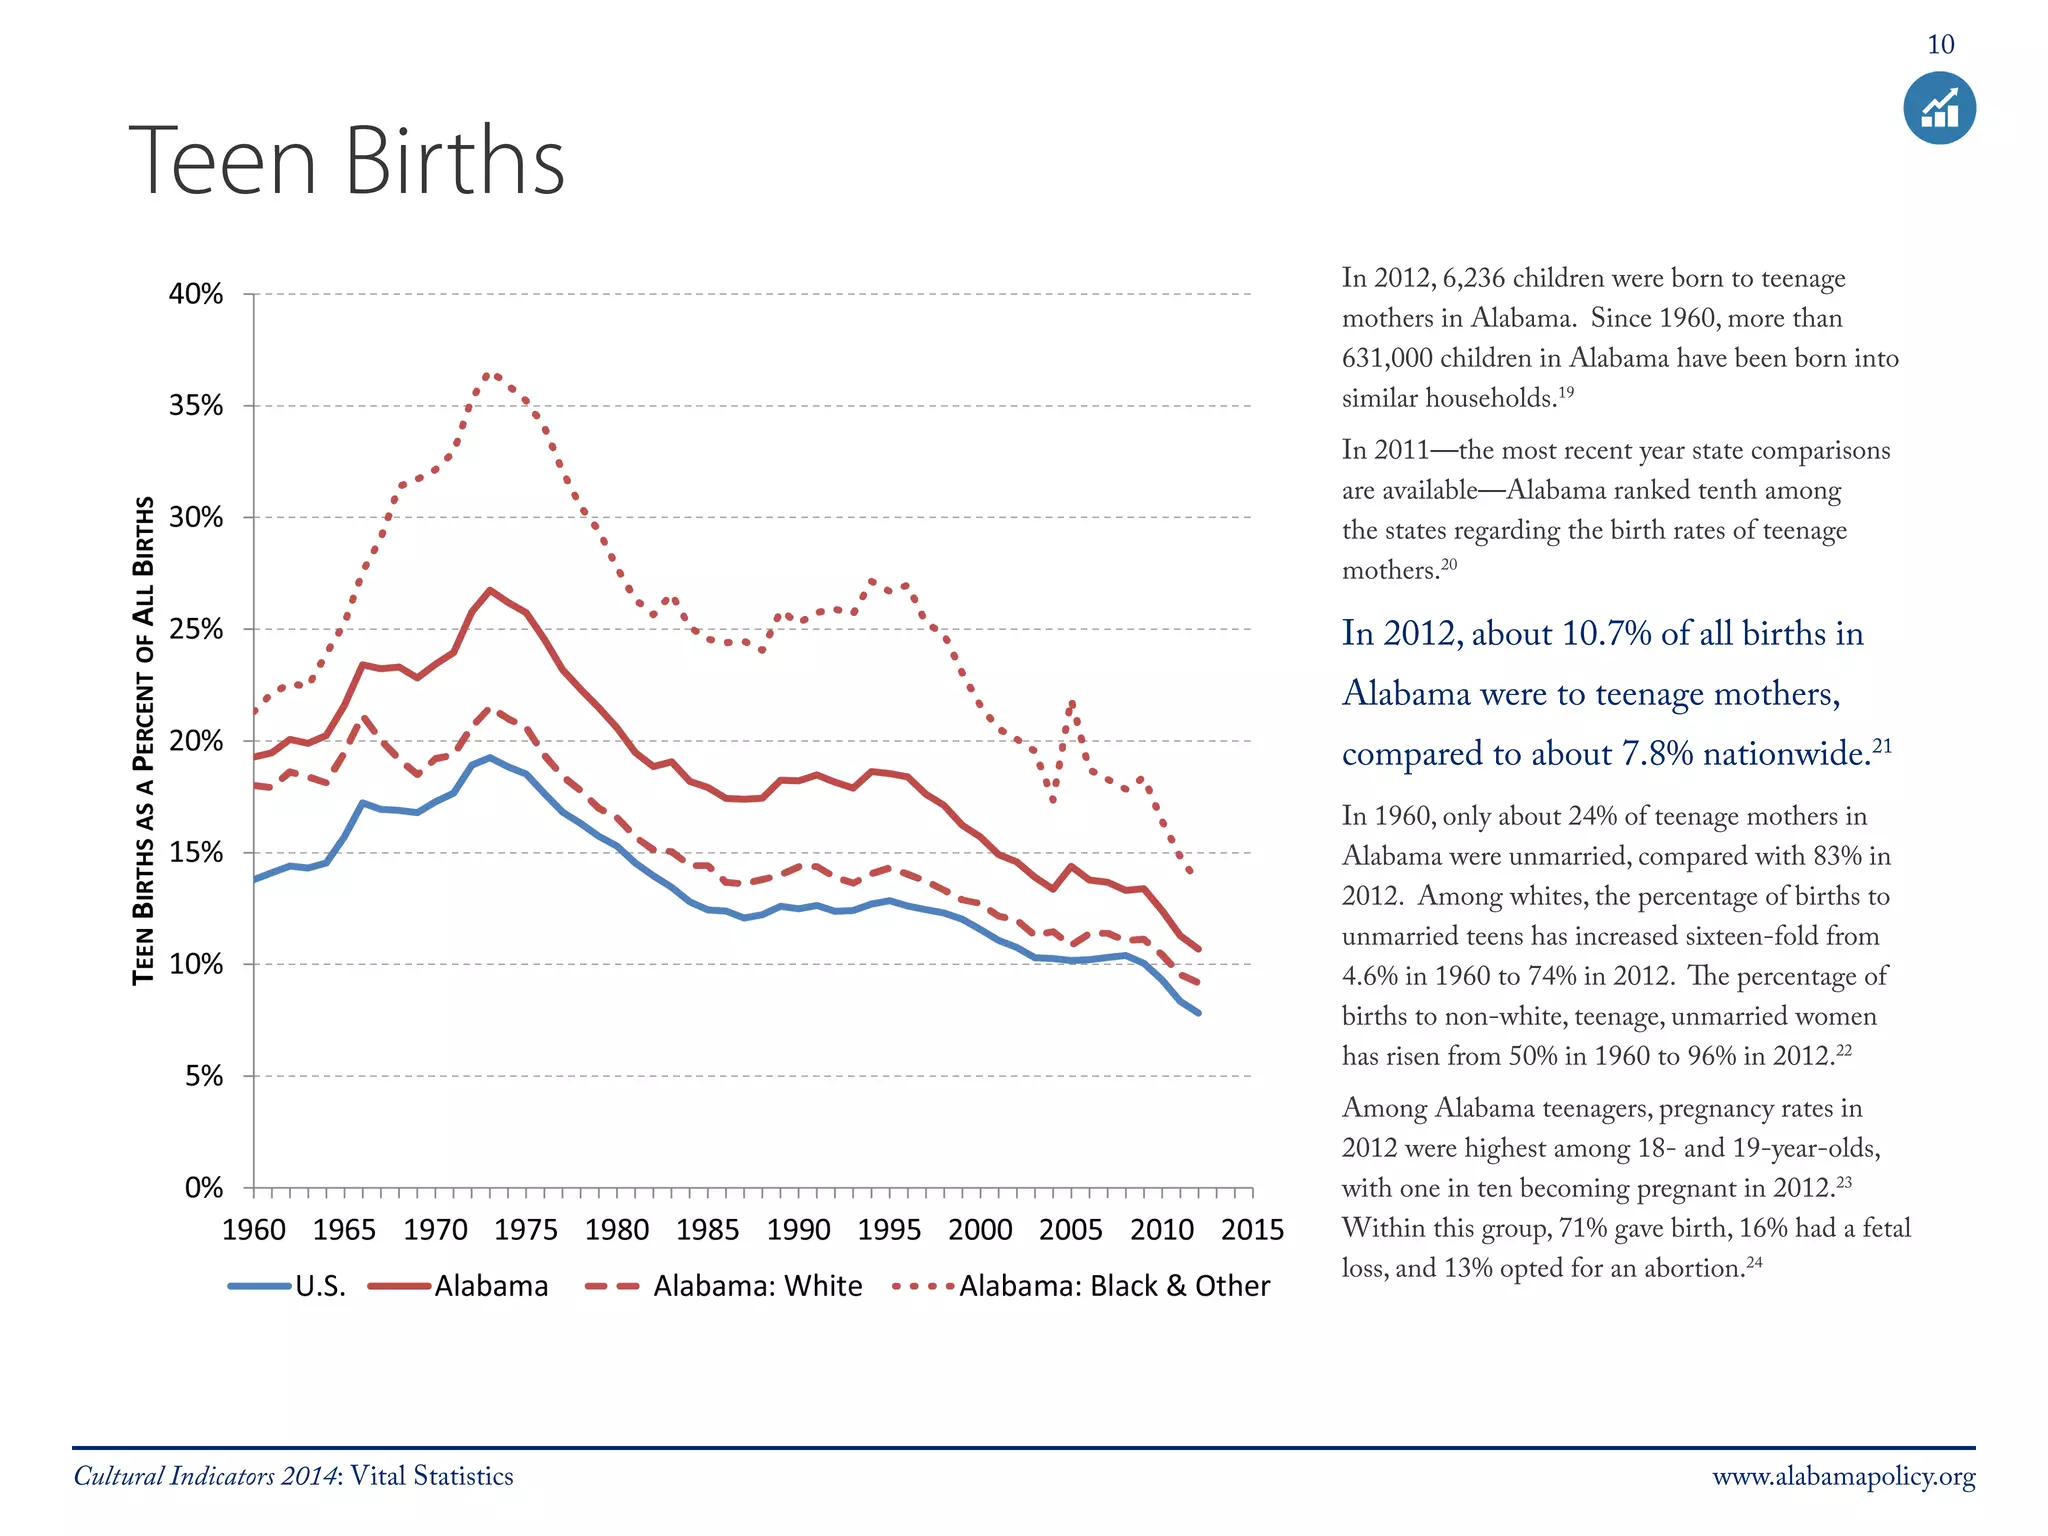
SlideShare a Scribd company logo
1 of 66
Download to read offline
ii 
The Alabama Policy Institute (API) is an independent, non-profit 
research and education organization that is issue-centered 
and solution-oriented. We provide in-depth research 
and analysis of Alabama’s public policy issues to impact policy 
decisions and deepen Alabama citizens’ understanding of 
and appreciation for sound economic, social and governing 
principles. 
Since 1989, API has been on the front lines of critical public 
debates, helping Alabama citizens, lawmakers and business 
leaders better understand and apply principles that maximize 
individual freedom, limit government interference and 
encourage personal responsibility. The Alabama Policy 
Institute is the largest free-market, solution-based policy 
research center in Alabama. 
For additional copies, 
please contact: 
Alabama Policy Institute 
402 Office Park Drive, Suite 300 
Birmingham, AL 35223 
P: 205.870.9900 
info@alabamapolicy.org 
www.alabamapolicy.org 
Cultural Indicators 2014 www.alabamapolicy.org
iii 
Cultural Indicators 2014 
for Alabama and the U.S. 
by John R. Hill, Ph.D. 
Senior Research Analyst 
Copyright © 2014 by Alabama Policy Institute 
Birmingham, Alabama 
Permission to reprint in whole or in part is hereby granted, provided that the 
Alabama Policy Institute and the author are properly cited. 
Cultural Indicators 2014 www.alabamapolicy.org
iv 
About the Author 
Dr. John Hill is the Senior Research Analyst at the Alabama Policy Institute. 
While on staff at API, he has authored more than thirty publications on 
education, energy, the state of the environment, family studies, gambling, 
and government growth. He is the primary author of three of API’s 
signature serial publications—Cultural Indicators for Alabama and the United 
States, Environmental Indicators, and How Business Friendly are Alabama’s 50 
Largest Cities?. As president of American Indicators, a statistical consulting 
service, Dr. Hill has partnered with think tanks in eight other states to 
produce custom reports on policy issues and cultural trends. He is also 
an adjunct instructor at Faulkner University, where he teaches statistics, 
research methods, and interpersonal communication. 
Dr. Hill holds a Ph.D. in Mass Communication from the University of Alabama 
and a M.A. in Speech from the University of Memphis. 
Cultural Indicators 2014 www.alabamapolicy.org
Contents 
Executive Summary..........................................................................................................................................1 
Vital Statistics........................................................................................................................................................3 
Crime.........................................................................................................................................................................11 
Education................................................................................................................................................................18 
Family........................................................................................................................................................................25 
Health........................................................................................................................................................................35 
Poverty & Welfare...............................................................................................................................................42 
Business & Government.................................................................................................................................53 
References..............................................................................................................................................................57 
v 
Cultural Indicators 2014 www.alabamapolicy.org
1 
Executive Summary 
The Alabama Policy Institute is pleased to present 
Cultural Indicators 2014 for Alabama and the United 
States. This study tracks various Alabama-specific and 
national measures of societal well-being dating back to 
1960, as statistics are available. Chapters are devoted to 
vital statistics; crime; education; family; health; poverty 
and welfare; and business and government. Some 
highlights of the study include: 
Vital Statistics 
• Since 1960, Alabama’s population has increased 47% to 4.8 
million in 2013, making it the 23rd largest state in the Union. 
During the same time, the population of the entire United 
States increased 76%. 
• In 2012, one of every ten births in Alabama was a low-weight 
birth. Alabama has the third highest percentage of low-weight 
births in the nation. 
• In 2011, Alabama had the tenth highest percentage of births 
to teenage mothers. 
• Alabama’s 2012 death rate was 26% higher than the national 
average. Heart disease and cancer are the two primary causes 
of death in both Alabama and the rest of the nation. 
• Since 1960, infant mortality rates in Alabama have fallen 
72%, but the state still has the third highest rate in the nation. 
Crime 
• Over the past 52 years, Alabama’s crime rate has 
increased 208%. The state’s crime rate has averaged 
about 7% above the national average since 1999. 
• After peaking in 1991, Alabama’s overall crime rate has 
fallen 30%. During the same time, the state’s violent 
crime rate decreased 49%. 
• Since 2010, Alabama’s violent crime rate has averaged 
10% above the national average. 
• One of every 148 Alabamians was in a state or federal 
prison in 2012, giving the state the third highest 
incarceration rate in the nation. 
• Since 1991, the inflation-adjusted cost per inmate in 
Alabama has increased by 24%. 
Education 
• Since 1960, the percentage of Alabamians age 25 and 
older with at least a high school diploma has doubled, 
and the percentage of adults with at least a four-year 
college degree has almost tripled. 
• Between 1970 and 2012, the percentage of blacks with 
at least a high school diploma has increased from 22% 
to 80%. 
• Despite these gain, Alabama ranks 46th in the nation in 
the percentage of adults age 25 and older with at least a 
high school diploma or its equivalent and 45th for adults 
holding at least a bachelor’s degree. 
• ACT scores in Alabama have been flat since 1990. 
Cultural Indicators 2014: Executive Summary www.alabamapolicy.org
2 
• Alabama’s national test scores for both math and reading have 
ranked near the bottom for more than ten years. 
• From 1960 to 2014, inflation-adjusted, per-student spending 
on public education in Alabama has increased 182%, 
compared to 147% for the nation as a whole. 
Family 
• In 2012, Alabama had the seventh highest marriage rate and 
the ninth highest divorce rate in the nation. Both rates have 
been above the national average for more than 50 years. 
• Over the past 44 years, about 23,500 couples have divorced 
in Alabama each year, splitting the homes of about 19,100 
children annually. 
• Since 1960, the percentage of births to unwed mothers in 
Alabama has increased from 11% to 43% in 2012. 
• For every 6.4 births in Alabama in 2011, there was one 
abortion. 
Health 
• Since 1970, the number of Medicaid recipients in Alabama 
has increased from 324,000 to almost 931,000. 
• From 1966 to 2012, enrollment in Medicare has risen from 
nine percent of the state’s population to almost 19%. 
• Alabama has the third highest rates of chlamydia and 
gonorrhea in the nation, and the 12th highest rate of HIV 
infection. 
Poverty and Welfare 
• In 2012, the typical Alabama household earned about $10,000 
less than the national average. 
• Compared to households led by a single female, married-couple 
families are one-fourth as likely to be in poverty. 
• In 2013, about one of every five Alabamians received some 
support from food stamps. 
• The total cost of payments for Supplemental Security Income in 
Alabama in 2013 was $1.1 billion. 
• During the 2013 school year, almost 91 million free and reduced-cost 
meals were served to Alabama students. 
Business and Government 
• Since 1975, the number of state and local government employees 
has increased by 67% and 77%, respectively. 
• About one of every 17 Alabamians is either a state or local 
government employee. 
• Since 1992, Alabama’s inflation-adjusted total state and local 
expenditures have increased 78%. 
Cultural Indicators 2014: Executive Summary www.alabamapolicy.org
Chapter 1 
VITAL STATISTICS
4 
Population 
From 1960 to 2013, Alabama’s population increased 
47%, from 3,267,000 to 4,833,7221 making it the 
23rd largest state in the Union.2 
At the same time, the population of the entire 
United States increased 76%, from 179.3 million to 
316 million.3 
In 2012, the largest age group in 
Alabama was 50-59 years old (14% of 
the population), followed by those 20-29 
years old (13.8%), the 10-19 age group 
(13.2%) and those between 40-49 years 
of age (13.1%).4 
In 2013, Alabama’s population composition was about 
69% white (3.2 million), 28% black (1.3 million), and 
2% Asian (74,000). Hispanics of any race comprised 
4% (193,000) of the states’ population.5 
After accounting for births and deaths, 
approximately one-third of the population growth 
in Alabama from 2010 to 2013 was the result of 
international migration.6 
As of 2010, Alabama’s population density of 94 
persons per square mile is 8% greater than the 
national average (87.4 persons per square mile).7 
Cultural Indicators 2014: Vital Statistics www.alabamapolicy.org
5 
Birth Rates 
Since 1960, Alabama’s birth rate has 
fallen from 24.7 per 1,000 persons in 
1960 to 12.1 per 1,000 in 2012, a drop 
of 51%. Nationally, the birth rate fell 
from 23.7 per 1,000 persons in 1960 to 
12.6 in 2012, a decline of 46%.8 
In 2012, there were 58,381 live births in Alabama. 
Sixty-six percent of these were to white mothers 
(38,637), while 34% (19,744) were to blacks and 
other races. The resident birth rate for whites was 
11.5 births per 1,000 population and 13.6 births 
per 1,000 population for blacks and other races.9 
In 2012, approximately 10% of all births in 
Alabama were low-weight births (birth weights 
of less than 2,500 grams / 5 pounds, 8 ounces), up 
slightly from 9.7% in 2000. In 2012, Alabama had 
the third highest ranking in low-weight births in 
the nation.10 
30 
25 
20 
BIRTH RATE PER 1,000 PERSONS 
15 
10 
5 
0 
1960 1965 1970 1975 1980 1985 1990 1995 2000 2005 2010 2015 
Alabama United States 
Cultural Indicators 2014: Vital Statistics www.alabamapolicy.org
6 
Death Rates 
16 
14 
12 
10 
8 
6 
4 
2 
0 
1960 1965 1970 1975 1980 1985 1990 1995 2000 2005 2010 2015 
DEATHSP ER 1,000 POPULATION 
Alabama U.S. Alabama: Age-Adjusted U.S.: Age-Adjusted 
In 2012, there were 49,212 deaths in Alabama, for 
an average death rate of 10.2 persons per 100,000 
population. Since 1960, Alabama’s death rate has 
increased 10%. From 1960 to 2011, the national 
death rate has fallen 15%, from 9.5 to 8.1 persons 
per 1,000 population.11 
Heart disease is the primary cause of 
death in both Alabama and the nation 
as a whole. 
In 2011—the most recent year in which detailed 
information is available—Alabama’s death rate 
from heart disease was 3.2 per 1,000 population, 
about 28% higher than the national average (2.5). 
The second leading cause of death in Alabama 
and the United States is cancer. In 2011, 
Alabama’s death rate from cancer was 2.1 per 
1,000 population, which was 10% higher than the 
national average (1.9). 
Cultural Indicators 2014: Vital Statistics www.alabamapolicy.org
7 
Age-adjusting a rate is a way to make fairer 
comparisons between groups with different age 
distributions. For example, a county having a 
higher percentage of elderly people may have 
a higher rate of death or hospitalization than a 
county with a younger population, merely because 
the elderly are more likely to die or be hospitalized. 
The same distortion can happen when comparisons 
are made between races, genders, or time periods. 
Age adjustment can make the different groups 
more comparable.12 
When the death rates for Alabama and 
the nation as a whole are age-adjusted, 
Alabama’s death rate in 2011 dropped 
to 9.3 per 1,000 population, while the 
national rate dropped to 7.4.13 
In 2011, the death rate for whites in Alabama was 
26% higher than that of blacks (10.9 versus 8.7, 
respectively). However, when age-adjusted death 
rates are compared, blacks died at a higher rate 
(10.3) than whites (9.1).14 
Cultural Indicators 2014: Vital Statistics www.alabamapolicy.org
8 
Infant Mortality 
Since 1960, infant mortality rates in 
Alabama have fallen 72%. In 1960, 32 
of every 1,000 babies born in Alabama 
died within the first year of their life. 
By 2012, that number had dropped to 
only 8.9 of every 1,000 babies. 
Despite this progress, Alabama’s infant mortality 
rate remains above the national average. For 
2011, Alabama (8.9 deaths per 1,000 live births) 
had the third highest infant mortality rate in the 
nation. Compared to neighboring states, Alabama 
had higher mortality than all of them, except 
Mississippi (9.38).15 
Cultural Indicators 2014: Vital Statistics www.alabamapolicy.org
9 
The infant death rate in Alabama in 2012 for 
blacks and other races (13.5 per 1,000 live births) 
is more than double that of whites (6.5). Even 
though there were almost twice as many births to 
white women in Alabama (38,637) than to non-white 
women (19,744), there were slightly more 
infant deaths among black and other non-white 
women (253) than whites (266).16 
In 2012, the top four leading causes 
of infant deaths in Alabama were: 
perinatal period conditions (241); 
congenital malformations (97); Sudden 
Infant Death Syndrome or SIDS (39), 
and accidents (25). 
These causes accounted for about 77% of 519 
infant deaths.17 Sixty-four percent of these deaths 
occurred within the first 27 days after birth, and 
33% occurred within the first 24 hours after birth.18 
Cultural Indicators 2014: Vital Statistics www.alabamapolicy.org
10 
Teen Births 
In 2012, 6,236 children were born to teenage 
mothers in Alabama. Since 1960, more than 
631,000 children in Alabama have been born into 
similar households.19 
In 2011—the most recent year state comparisons 
are available—Alabama ranked tenth among 
the states regarding the birth rates of teenage 
mothers.20 
In 2012, about 10.7% of all births in 
Alabama were to teenage mothers, 
compared to about 7.8% nationwide.21 
In 1960, only about 24% of teenage mothers in 
Alabama were unmarried, compared with 83% in 
2012. Among whites, the percentage of births to 
unmarried teens has increased sixteen-fold from 
4.6% in 1960 to 74% in 2012. The percentage of 
births to non-white, teenage, unmarried women 
has risen from 50% in 1960 to 96% in 2012.22 
Among Alabama teenagers, pregnancy rates in 
2012 were highest among 18- and 19-year-olds, 
with one in ten becoming pregnant in 2012.23 
Within this group, 71% gave birth, 16% had a fetal 
loss, and 13% opted for an abortion.24 
Cultural Indicators 2014: Vital Statistics www.alabamapolicy.org
Chapter 2 
CRIME
12 
Crime Rates 
Since 1960, Alabama’s crime rate, which takes into 
account population changes, increased 208%, from 
1,222 crimes per 100,000 residents to 3,598 in 
2012. In 2012, Alabama reported 173,916 Type I 
crimes—murder, rape, robbery, aggravated assault, 
burglary, larceny, and motor vehicle theft.25 This is 
down from the 1991 peak of 209,800 crimes, but 
about 38% more than in 1975 (125,488).26 
From 1960 to 1999, Alabama’s crime 
rate remained below the national 
average. Since 1999, the state’s crime 
rate has averaged about 7% above the 
national average.27 
In 2012, there were almost 10.2 million crimes 
reported in the United States. This is down from 
the 1991 peak, when there were almost 14.9 
million crimes. In 2012, Alabama’s share of all 
crimes in the United States (1.7%) was slightly 
higher than its representative population (1.5%).28 
Cultural Indicators 2014: Crime www.alabamapolicy.org
13 
Violent Crime 
There were 20,222 violent crimes—murder, rape, 
robbery, and aggravated assault—reported in 
Alabama in 2012. This is down 49% from the peak 
of 33,888 in 1992, but it is 124% higher than in 
1960.29 
In 2013, Alabama’s violent crime rate was 432.7 
crimes per 100,000 population, down 3% from 
2012. Between 1994 and 2010, Alabama’s violent 
crime rate was, on average, about 8% lower than 
national average. Since then, it has averaged 10% 
above the national average.30 
In 2012, about 12% of all the crimes 
committed in Alabama were of a 
violent nature, the same as the nation as 
a whole. 
Compared to neighboring states, the percentage 
of violent crimes in Alabama was higher than 
Georgia (10%) and Mississippi (8%), but lower 
than Florida (13%) and Tennessee (16%).31 
Since 1960, the national violent crime rate jumped 
371% to its peak in 1992, before descending 
49% to its 2012 level of 386.9 violent crimes per 
100,000 population.32 
Cultural Indicators 2014: Crime www.alabamapolicy.org
14 
Prison Population 
In 2012, one of every 148 persons (0.7%) of 
Alabama’s population was in a state or federal 
prison serving a sentence of at least one year, 
compared to one in every 200 (0.5%) of the 
national population. 
Alabama’s incarceration rate—the 
number of sentenced prisoners per 
100,000 populations—is the third 
highest in the nation.33 
Of the 31,437 prisoners in Alabama as of 
December 31, 2012, 92% (28,915) were male. 
Since 2000, the number of female prisoners has 
increased from 1,783 from to 2,522.34 One percent 
of all prisoners were under the age of 18.35 
Since 1980, the sentenced adult prison populations 
of Alabama and the nation as a whole both 
increased by 380%. In 1980, Alabama had 6,543 
inmates; at the end of fiscal year 2012 it had 
32,574. Nationwide, the number of prisoners 
increased from 316,000 to 1.57 million.36 
800 
700 
600 
500 
400 
300 
200 
100 
- 
1980 1985 1990 1995 2000 2005 2010 2015 
PRISONERS PER 100,000 POPULATION 
US Alabama 
Cultural Indicators 2014: Crime www.alabamapolicy.org
15 
According to the Alabama Department of 
Corrections, of the sentenced prisoners in 2012, 
23% were incarcerated for drug offenses, 21% for 
burglary or theft, and 14% each for murder and 
robbery.37 
The percentage of inmates serving 
time for violent offenses in Alabama’s 
correctional system has increased from 
39% (10,182 prisoners) in 2000 to 47% 
(15,212) in 2012.38 
In 2012, 28% of the inmates in Alabama’s prisons 
(9,124) were held under the Habitual Offender 
Act. This percentage has remained relatively flat 
since 1991.39 
Cultural Indicators 2014: Crime www.alabamapolicy.org
16 
Cost of Imprisonment 
In 2012, Alabama taxpayers spent an 
inflation-adjusted $15,527 for each of 
the inmates in the state’s prison system. 
This is about 4% less than the $16,117 
spent per inmate in 2011. Since 1991, 
Alabama’s cost per inmate has risen 
19% after rising and falling several 
times.40 
In fiscal 2012, expenditures for corrections totaled 
$437.3 million, down $7.5 million from 2011. 
Of this amount, 54% ($238 million) was for 
personnel costs and employee benefits, 27% ($118 
million) was for medical and professional services, 
8% ($33 million) was for supplies and operating 
expenses, and 4% ($16 million) was for utilities and 
communications. Only 3% ($13 million) was spent 
on repairs, maintenance, or capital outlays.41 
For fiscal year 2014, corrections expenditures 
constitute $425 million, or 24% of the entire 
General Fund budget. Only Medicaid ($615 
million) has a larger share of the budget..42 
Cultural Indicators 2014: Crime www.alabamapolicy.org
17 
Child Abuse 
Since 1990, the rate of substantiated cases of child 
abuse in Alabama has declined by 43% and by 32% 
nationally.43 
In 2012, there were 20,599 reports 
of child abuse in Alabama involving 
30,400 children. 
Not every report of child abuse or neglect is 
authentic; each report must be investigated to 
determine whether enough evidence exists to 
conclude that maltreatment occurred.44 
Of the child abuse cases reported in 2012, 
9,573 were identified as actual victims—about 
one in three. Specifically, about one in every 
37 children in Alabama was the subject of a 
child abuse investigation, but only one in 117 
was actually substantiated as a victim.45 By 
comparison, about one in every 19 children 
nationwide was the subject of an investigation, 
and one in every 109 was actually substantiated 
as a victim.46 
In 2012, 59% of Alabama child abuse victims 
were white, 29% were black, and 4% were 
Hispanic.47 By comparison, Alabama’s total 
youth population in 2012 (1,124,000) was 59% 
white, 30% black, and 4% Hispanic.48 
25 
20 
15 
10 
5 
0 
1990 1992 1994 1996 1998 2000 2002 2004 2006 2008 2010 2012 
VICTIM RATE PER 1,000 CHILDREN 
Alabama U.S. Average 
Cultural Indicators 2014: Crime www.alabamapolicy.org
Chapter 3 
Education
19 
Academic Achievement 
Since 1970, the percentage of Alabama residents age 
25 and older with a high school diploma has doubled 
(103% gain), while the percentage of adults with at 
least a four-year college degree has almost tripled 
(196%). By comparison, the percentage of adults 
nationwide with at least a high school diploma or a 
college degree has risen 56% and 172%, respectively.49 
In Alabama, academic gains have been greatest among 
blacks. Between 1970 and 2012, the percentage of 
blacks with at least a high school diploma increased 
from 22% to 80%, a gain of 263%. By comparison, 
the percentage of whites with at least a high school 
diploma rose by 83%, from 47% to 86%.50 
In 2012, Alabama ranked 46th in the 
nation in the percentage of adults age 
25 and older with at least a high school 
diploma or its equivalent51 and 45th for 
adults holding at least a bachelor’s degree.52 
The more diplomas an adult holds, the greater their 
earning potential. According to data collected 
in 2012 by the U.S. Census Bureau, possessing a 
high school diploma raises personal income for 
Alabama residents by almost $7,000 ($25,485) and 
a bachelor’s degree by almost $26,500 ($45,124).53 
Cultural Indicators 2014: Education www.alabamapolicy.org
20 
ACT Scores 
In 2013, 79% (38,122) of all graduating high 
school seniors in Alabama took the ACT. Of 
these, the average composite score was 20.4, the 
36th highest in the nation.54 Of the 26 states in 
which most students took the ACT in 2013, 
Alabama was in 15th place.55 
Seventy-nine percent (30,233) of Alabama high 
school students taking the ACT in 2013 were 
core course completers—that is, they had taken at 
least four years of English and three years of math 
(algebra and higher), social sciences, and natural 
sciences. Of these, their composite average was 
21, compared to a national average of 21.7 for core 
course completers and 18.2 for Alabama students 
who were not core course completers.56 
Since 1990, Alabama students’ scores on 
the Enhanced ACT have been stagnant, 
with students typically scoring about 0.8 of 
a point below the national average.57 
Cultural Indicators 2014: Education www.alabamapolicy.org
21 
Male test takers in Alabama in 2013 had higher 
average composite (20.6), math (20.0), and science 
(20.7) scores than females (20.3, 19.1, and 19.7, 
respectively). In the categories of English and 
reading, females scored better (20.7 and 21.0) than 
males (20.3 and 20.9).58 
Ethnicity is a significant predictor of ACT 
scores in Alabama. 
For reading, Asian students had the highest 
average score (23.5), followed by whites (22.4) 
and native Hawaiians or other Pacific Islanders 
(21.2). By comparison, blacks scored lowest 
(17.5), followed by Hispanics (20.1) and Native 
Americans (20.6). A similar relationship was 
found for math: Asians scored highest (25.0), 
followed by whites (21.9) and native Hawaiians 
or other Pacific Islanders (20.1). Again, blacks’ 
scores were the lowest (17.2), followed by Native 
Americans (18.2) and Hispanics (18.3).59 
Cultural Indicators 2014: Education www.alabamapolicy.org
22 
NAEP Scores 
The National Assessment of Education Progress 
(NAEP) was mandated by Congress in 1969 to 
monitor the knowledge, skills, and performance 
of the nation’s school children. One form of 
monitoring has been national, standardized tests in 
mathematics, science, reading, geography, and other 
subjects. In 2013, every state and the District of 
Columbia participated in the mathematics and 
reading exams.60 
NAEP uses a scale of 0 to 500 for its mathematics 
and reading tests. 
In 2013, Alabama’s 4th grade math 
students ranked 46th in the nation with 
an average score of 233, eight points 
below the national average.61 Twenty-nine 
percent of Alabama’s 4th graders scored at 
or above proficiency, 13 points below the 
national average.62 
Cultural Indicators 2014: Education www.alabamapolicy.org
23 
In the same year, Alabama’s 8th grade math 
students ranked 50th in the nation with an 
average NAEP score of 269, with 19% at or above 
proficiency. By comparison, the national average 
was 284, with 34% at or above proficiency.63 
In 2013, Alabama’s 4th grade students 
ranked 35th in the nation in reading with 
an average score of 219, two points lower 
than the national average. Thirty percent 
of Alabama’s students scored at or above 
proficiency, compared to 34% of students 
nationwide.64 
During the same year, Alabama’s 8th grade 
students ranked 47th in the nation in reading with 
an average score of 257, nine points below the 
national average. Twenty-five percent of Alabama’s 
students scored at or above proficiency, compared 
to 35% of students nationwide.65 
Cultural Indicators 2014: Education www.alabamapolicy.org
24 
K-12 Spending Per Pupil 
In the 2013-14 school year, public schools 
in Alabama spent an average of $8,841 per 
student. This is a 2% decrease from the inflation-adjusted 
amount spent in 2012-2013 ($8,998). 
By comparison, national spending per student 
increased 2% from $11,170 to $11,373. 66 
Despite occasional proration and income 
shortfalls, Alabama’s public elementary 
and secondary schools have received a 
large increase in revenue in the past 50 
years. 
Since 1970, inflation-adjusted spending per 
student in Alabama has increased 182%, compared 
to 147% for the nation as a whole.67 
In the 1969-70 school year, Alabama’s per-student 
outlays for K-12 public education ($3,139 in 
inflation-adjusted dollars) were 31% less than the 
national average ($4,605). By the 2013-14 school 
year, this gap had narrowed to 22%.68 
In the 2010-11 school year, 37.8% of funding 
for all public education in Alabama came from 
state and local government expenditures. By 
comparison, the national average was 33.3%.69 
$14,000 
$12,000 
$10,000 
$8,000 
$6,000 
$4,000 
$2,000 
$- 
1970 1975 1980 1985 1990 1995 2000 2005 2010 2015 
Alabama U.S. 
Cultural Indicators 2014: Education www.alabamapolicy.org
Chapter 4 
Family
26 
Marriage 
In 1960, married couples made up about 75% of 
all households in the United States. By 2010, that 
number had fallen to 49.7%.70 
In 2012, there were 38,489 marriages in Alabama, 
a 5% decline from 40,523 marriages in 2011. This 
translates to a marriage rate of 8.0 marriages per 
1,000 population.71 
Between 1960 and 2012, Alabama’s 
highest marriage rate of 14.1 marriages per 
1,000 population was achieved in 1972. 
Since then, the state’s marriage rate has 
fallen by 43%.72 
In 2009—the most recent year for which national 
figures are available—Alabama’s marriage rate 
was 23% higher than the national average of 
6.8 marriages per 1,000 population. Alabama’s 
marriage was the 7th highest in the nation,73 
and the state’s marriage rate has been above the 
national average since before 1960. 
16 
14 
12 
10 
8 
6 
4 
2 
0 
1960 1965 1970 1975 1980 1985 1990 1995 2000 2005 2010 2015 
MARRIAGE RATE PER 1,000 POPULATION 
U.S. Alabama 
Cultural Indicators 2014: Family www.alabamapolicy.org
27 
Divorce 
In 2012, Alabama had 17,193 divorces, for a divorce 
rate of 3.6 per 1,000 population. This is down about 
16% from 2011, when there were 20,550 divorces in 
the state.74 
In 2011—the most recent year national figures are 
available—the state’s divorce rate (4.3 in 2011) was 
19% above the national average of 3.6. Alabama’s 
divorce rate has been above the national average for 
more than 50 years.75 
In 2009—the most recent year comparable 
state figures are available—Alabama had 
the ninth highest divorce rate in the nation. 
Alabama’s divorce rate was also higher than at least 
three neighboring states that reported divorce rates: 
Florida (4.3); Mississippi (4.1); and Tennessee (4.1) 
(Georgia does not publish its annual divorce rates).76 
Between 1960 and 1966, Alabama’s divorce rate 
fell from 5.3 per 1,000 population to a low of 3.2 in 
1966 before rising to a record high of 6.9 in both 
1979 and 1980.77 
In 2012, the median length of marriage before 
divorce in Alabama was between five and nine years. 
Ninety-eight percent of these divorces were on the 
grounds of either “incompatibility” or “irretrievable 
breakdown” also known as “no-fault divorce.” 78 
8 
7 
6 
5 
4 
3 
2 
1 
0 
1960 1965 1970 1975 1980 1985 1990 1995 2000 2005 2010 2015 
DIVORCE RATE PER 1,000 POPULATION 
U.S. Alabama 
Cultural Indicators 2014: Family www.alabamapolicy.org
28 
Children Affected by Divorce 
Perhaps the greatest tragedy of divorce is its effect 
on the children involved. 
For the past 44 years, about 23,500 
couples have divorced in Alabama each 
year, splitting the homes of about 19,100 
children annually.79 
Even if none of these divorces involved a 
subsequent divorce (or more than one) for one of 
the parents, almost 825,000 children in Alabama 
have been directly affected by divorce since 1970.80 
The number of children affected by divorce in 
Alabama closely mirrors the state’s divorce rate. 
During the initial surge in divorces following the 
legalization of no-fault divorce in Alabama in 
1971, the number of children affected grew at a 
rate of about 400 per year until reaching a historic 
peak in the late 1970s. Since then, it has fallen by 
about 160 per year. 
30,000 
25,000 
20,000 
15,000 
10,000 
5,000 
- 
1970 1975 1980 1985 1990 1995 2000 2005 2010 2015 
Cultural Indicators 2014: Family www.alabamapolicy.org
29 
Index of Belonging & Rejection 
In February 2014, Patrick Fagan of the Family 
Research Council published the fourth annual 
Index of Family Belonging and Rejection to 
measure the social health of American children. 
“Belonging” was defined as the percentage of 
children ages 15-17 who had grown up “with 
both their birth mother and their biological 
father legally married to one another since before 
or around the time of the teenager’s birth,” 
and “rejection” as the percentage of children in 
households where at least one of their biological 
parents was no longer in the home. 
Of the 13.1 million teens in the United States 
at the time of the study (2008-2011), more than 
7 million—54% —had spent their childhood 
without at least one of their biological parents in 
an intact family.81 
Despite having a reputation for strong 
families, the southeastern United States— 
including Alabama—fared poorly: its 
score of 38% means that 62% of teens in 
Alabama (119,000 of 192,000) had not 
grown up with both biological parents.82 
Cultural Indicators 2014: Family www.alabamapolicy.org
30 
Nevertheless, three other southern states and the 
District of Columbia (17%) scored the same or 
lower than Alabama.83 
The most recent version of the Index also 
includes race-specific measures of belonging. 
Intact biological families among whites were less 
common in Alabama (48%) than the nation as a 
whole (54%), while the state’s Hispanic population 
was better off (49%) than the national average 
(41%). The percentage of intact biological families 
in Alabama’s black population was about the same 
as the national average (17%).84 
Cultural Indicators 2014: Family www.alabamapolicy.org
31 
Births to Unwed Mothers 
Since 1960, the number of births in Alabama that 
were out of wedlock jumped 272%, from 11% to 
43% in 2012.85 Nationwide, the percentage of out-of-wedlock 
births has increased 673%, from 5% to 41%.86 
Over the past 50 years, 863,000 children 
in Alabama and more than 48 million 
children nationwide have been born to an 
unmarried mother.88 
In 1960, 2% of births to white mothers in Alabama 
were out of wedlock. That number rose to 28% 
in 2012, an eleven-fold increase (1,171%).89 By 
comparison, the percentage of births to unwed, non-white 
women has leveled out after growing for more 
than 30 years. In 2012, 71% of all children born in 
Alabama to non-white mothers were born out of 
wedlock, compared to 28% in 1660, a 153% increase.90 
While the problem of unwed parents is usually 
discussed as it pertains to teenagers, adult out-of- 
wedlock births in Alabama are increasing at a 
faster rate than teens. Since 2000, the percentage 
of out-of-wedlock births to mothers ages 15-19 has 
increased from 71% of all births to 83% in 2012. 
By comparison, the percentages of out-of-wedlock 
births to mothers between the ages of 20-24 has 
increased from 45% in 2000 to 60% in 2012; and the 
percentage for women ages 25-29 increased from 
12% in 2000 to 22% in 2012.91 
Cultural Indicators 2014: Family www.alabamapolicy.org
32 
Abortion Rates 
Half of the pregnancies among American women 
are unintended, and about four in 10 of these 
are terminated by abortion. From 1973 to 2011, 
nearly 53 million legal abortions were performed in 
America. Forty-five percent of all abortions since 
1973 have been for women who were not married 
at the time of the procedure.92 
According to Alabama’s Department 
of Public Health, there were 9,076 
abortions performed in the state in 
2012, or about one abortion for every 
6.4 births. Fourteen percent of all 
abortions in Alabama were performed 
on teenagers.93 
In 2011—the most recent year for which national 
figures are available—Alabama ranked 33rd in the 
nation in abortions. The state’s abortion rate (10 
abortions per 1,000 women ages 15-44) was lower 
than the rates of Florida (23.7), Georgia (16.8), 
and Tennessee (13.1), but higher than that of 
Mississippi (3.7).94 
Cultural Indicators 2014: Family www.alabamapolicy.org
33 
Nationally, an estimated 1.06 million abortions 
were performed in 2011, according to the 
Guttmacher Institute, a New York-based 
organization that gathers voluntary reports from 
abortion providers. The numbers of abortions 
performed in Alabama from 1986 to 1991 are 
estimates because it was not until 1992 that the 
state law required full reporting from the providers 
of abortion services.95 
More than 533,000 abortions have been 
performed in the state since the Roe v. 
Wade decision in 1973.96 This number is 
equal to almost half the population of 
the Birmingham-Hoover Metropolitan 
Statistical Area (1,140,300 in 2013).97 
Cultural Indicators 2014: Family www.alabamapolicy.org
34 
Single-Parent Families 
In 2012, 36% of all Alabama families with children 
under the age of 18 were single-parent homes, 
compared to about 33% nationwide.98 
Since 1980, the percentage of families 
headed by a single parent in Alabama 
and the nation as a whole has increased 
by 88% and 70%, respectively.99 
National data from the 1960 census shows the 
extent to which family composition has changed: 
91% of all families with children were married 
couples, 8% were single-parent, female-headed 
households, and 1% were male-headed, single-parent 
households. By 2012, only 67% of 
American families with children were married 
couples, 25% were headed by a single, female 
parent, and 8% were single-parent, male-headed 
households.100 
40% 
35% 
30% 
25% 
20% 
15% 
10% 
5% 
0% 
1980 1985 1990 1995 2000 2005 2010 2015 
Alabama U.S. 
Cultural Indicators 2014: Family www.alabamapolicy.org
Chapter 5 
Health
36 
Medicaid 
Begun in 1970, Medicaid pays for medical care 
and nursing home care for the poor. Since 1980, 
inflation-adjusted Medicaid spending in Alabama 
has increased 481% from $759 million to $4.4 
billion in 2010. At the same time, the number of 
Medicaid recipients increased 187%, from 324,000 
to almost 931,000.101 
Much of the growth in Medicaid has been in the 
last 10 years. From 2000 to 2010, the number of 
recipients increased 50% in Alabama and 53% 
nationwide. At the same time, inflation-adjusted 
spending on Medicaid increased 34% in Alabama 
and 59% for the rest of the nation.102 
In 2010, approximately 65.5 million 
Americans received some level 
of Medicaid assistance, the total, 
inflation-adjusted cost of which was 
approximately $369.6 billion. 
Of this amount, $49 billion was spent on nursing 
home care, $38 billion was spent on inpatient 
hospital expenses, and $26 billion was spent on 
prescription drugs.103 
Cultural Indicators 2014: Health www.alabamapolicy.org
37 
Medicare 
Medicare was established in 1965 as a means of 
establishing a health insurance program for aged 
persons to complement the retirement, survivors, 
and disability insurance benefits under Title II of 
the Social Security Act. When it was implemented 
in 1966, Medicare covered most persons aged 65 or 
older. Since then, it has expanded to include persons 
entitled to Social Security or Railroad Retirement 
disability cash benefits, most persons with end-stage 
renal disease, and those with Lou Gehrig’s disease.104 
Since 1966, enrollment in Medicare 
in Alabama has risen from 9% of the 
state’s population (285,000) to almost 
19% (896,000) in 2012, an increase of 
118%.105 Nationally, enrollment has risen 
from 10% to 16%, an increase of 67%.106 
In 1999, the Social Security Administration 
changed the way in which it reported data on 
recipients of its medical care programs, making 
some comparisons between earlier and later data 
impossible. Nevertheless, national data show that 
Medicare payments have rapidly increased. Since 
1967, the national amount of Medicare payments 
has risen from an inflation-adjusted $30 billion in 
1967 to almost $358 billion in 2012, a more than 
ten-fold increase (1,085%).107 
Cultural Indicators 2014: Health www.alabamapolicy.org
38 
Sexually Transmitted Diseases 
In women, chlamydial infections, which usually 
have no symptoms, may result in damage to a 
woman’s reproductive organs, including pelvic 
inflammatory disease (PID)—a major cause of 
infertility—ectopic pregnancy, and chronic pelvic 
pain.108 
Since 1990, Alabama’s chlamydia 
infection rate has increased from almost 
none to 638 per 100,000 population 
in 2012, while the national rate has 
increased 185%, from 160 per 100,000 
population to 457.109 
One of the reasons for these large increases appears 
to be because of improvements in screening 
techniques.110 In 2012, Alabama had the third 
highest rate of reported cases of chlamydia in the 
nation.111 
While chlamydia has become the new leader in 
sexually transmitted diseases in both Alabama and 
the United States, gonorrhea and syphilis are on 
the decline. As with chlamydia, gonorrhea and 
syphilis produce PID, abdominal pain, and ectopic 
pregnancies.112 
Cultural Indicators 2014: Health www.alabamapolicy.org
39 
Since 1984, the gonorrhea infection 
rate in Alabama and the United 
States has decreased by 58% and 71%, 
respectively.113 In 2012, Alabama had 
the third highest rate of reported cases 
of gonorrhea in the nation (193 per 
100,000 population).114 
Syphilis is a bacterial infection that is particularly 
dangerous to unborn children. If untreated, many 
children of mothers with syphilis are stillborn or 
die shortly after birth.115 The reported rate of cases 
of syphilis has fallen by 58% in Alabama and by 
46% nationwide since 1984. In 2012, Alabama had 
the 14th highest rate of reported cases of syphilis in 
the nation (14.7 per 100,000 population).116 
Cultural Indicators 2014: Health www.alabamapolicy.org
40 
HIV/AIDS 
Human Immunodeficiency Virus infection (HIV) 
is a disease of the immune system. While the 
disease can be managed through antiretroviral 
therapy, which can help patients achieve near-normal 
life expectancies, there is no cure for HIV. 
If left untreated, about half of all persons with HIV 
eventually develop Acquired Immune Deficiency 
Syndrome (AIDS) within 10 years of infection. 
In 2011, there were 49,273 diagnoses of HIV 
infection in the 50 states and the District of 
Columbia. Of these, 843 were reported in 
Alabama.118 
The rate of HIV infection in 2011 was 
17.6 diagnoses per 100,000 population 
nationally and 17.6 in Alabama, giving 
the state the 12th highest infection rate 
in the nation. Since 1996, the HIV 
infection rate has increased 247% 
nationwide and only 58% in Alabama.119 
Cultural Indicators 2014: Health www.alabamapolicy.org
41 
In 2011, the most common age for new diagnoses 
of AIDS was 20-24 years old (36.4 per 100,000 
population), followed by 25-29 year olds (35.2).120 
At the end of 2010, there were 
870,096 persons living with HIV in 
the United States. Of these, 11,539 
lived in Alabama. 
Nationwide, the plurality of those living with HIV 
are black (43%), followed by whites (34%) and 
Hispanics (19%).121 
Among males, most came into contact with HIV 
via male-to-male sexual contact (78%), injection 
drug use (6%), or both (4%). For females, the 
primary sources of contact were heterosexual 
contact (86%) and injection drug use (14%).122 
The reason for the increase in AIDS rates in 1993 
is because the Centers for Disease Control and 
Prevention (CDC) revised its AIDS surveillance 
case definition to include adolescents and 
adults with low CD4 (T-cell) counts, but no 
manifestation of any signs of illness.123 
Cultural Indicators 2014: Health www.alabamapolicy.org
Chapter 6 
Poverty & Welfare
43 
Median Household Income 
Since 1970, the inflation-adjusted, 
median household income for 
Alabama residents has actually 
decreased 22%, while the national 
median has decreased 16%. In 2012, 
the typical Alabama household earned 
an inflation-adjusted $43,078, while 
the typical American household 
earned $53,229.124 
In both Alabama and the nation as a whole, 
improvements in earnings were greatest among 
married-couple families. In 2012, the average 
married-couple family in Alabama earned $69,052, 
39% more than in 1970. By comparison, American 
married-couple families nationwide earned an 
average of $78,786, about 13% more than in 1970 
(after adjusting for inflation).125 
Cultural Indicators 2014: Poverty & Welfare www.alabamapolicy.org
44 
In general, the gap between Alabama’s 
median household income and that 
of the nation as a whole has widened 
since 1970, from an inflation-adjusted 
15% in 1970 ($8,314) to almost 24% 
($10,151) in 2012. 
Married-couple families in Alabama, however, 
have narrowed the gap from 41% (a gap of $20,222 
in 1970) to 14% in 2012 ($9,734). Male-headed 
households in Alabama have had similar success, 
reducing the gap from 42% in 1989—the first year 
state-specific data is available—to 15% in 2012.126 
On the other hand, female-headed households 
in both Alabama and the rest of the nation have 
become poorer over the past four decades. After 
adjusting for inflation, female-headed households 
in Alabama saw their earnings drop by 13% 
between 1970 and 2012, from $28,600 to $25,067. 
Nationwide, median female-headed household 
income fell 6%, from $33,692 to $31,589.127 
Cultural Indicators 2014: Poverty & Welfare www.alabamapolicy.org
45 
Adequate Housing 
Every two years, the U.S. Census Bureau conducts 
a survey of housing units across the country and in 
selected metropolitan areas. 
According to the most recent national 
survey of housing in 2011, almost 
96% of homes have a fully equipped 
kitchen (including a sink, refrigerator, 
and oven or burner), 93% have at least 
one working smoke detector, 42% have 
at least one working carbon monoxide 
detector, and 90% have a furnace, hot 
water or steam system, or built-in 
electric heat pump or heater.128 
Another way to measure the adequacy of housing 
is by rating the quality and safety of their 
surroundings. In 2009, more than 80% of all homes 
in the United States were not near vandalized 
buildings (87%), free of trash or junk on the streets 
(89%), or not near buildings with bars on their 
windows (83%). On the other hand, almost 40% 
noted that the streets near their home were in need 
of at least minor repairs.129 
Cultural Indicators 2014: Poverty & Welfare www.alabamapolicy.org
46 
Families in Poverty 
The U.S. Census Bureau updates its estimates of 
poverty annually using the Consumer Price Index 
(CPI-U). The Bureau’s definition of poverty 
counts money income before taxes and does not 
include capital gains and non-cash benefits, such as 
public housing, Medicaid, and food stamps.130 
In 2012, about one in every 5.3 
American households with children was 
in poverty. Since 1960, the percentage 
of families with children in poverty has 
fallen by 5% nationwide. 131 
Since 1974—the first year detailed figures are 
available for married couples and male-headed 
households—the percentage of all families in 
poverty has risen by 55%, from 12% to about 19% 
in 2012. For married couples, the increase was large 
(43%), but less severe than the national average 
(55%). Married couples have the lowest percentage 
of poverty of all household types, making their jump 
from an already-low 6% in 1974 to almost 9% in 
2012 appear larger than it actually is.132 
Male-Headed Households 
FMeamlea-lHe-eHaedaedde Hd oHuosuesheohldoslds 
Cultural Indicators 2014: Poverty & Welfare www.alabamapolicy.org
47 
Male-headed households had a 58% increase in 
poverty from 1974 to 2012. While male-headed 
homes tend to earn more than those headed by 
a female, both single-parent household types are 
more susceptible to the risk of going from one 
income to no income than in homes where there 
are or could be dual earners.133 
The percentage of households headed by a single 
female declined by a fraction of a point (-0.2%). 
Female-headed households have 
traditionally been the most likely to 
be in poverty, with an average poverty 
rate of 42% since 1974. 
Moreover, female-headed households had a 
poverty rate nine percentage points lower (33%) 
as recently as 2000 before returning to its steady 
climb.134 
Cultural Indicators 2014: Poverty & Welfare www.alabamapolicy.org
48 
AFDC/TANF Recipients 
Aid to Families with Dependent Children (AFDC) 
was a cash assistance program primarily intended for 
women with children in their household. In most 
circumstances, if recipients married, they would 
lose their benefits. Created in 1935 and originally 
called Aid to Dependent Children, this program 
was originally created under the New Deal to 
assist widows (or wives of disabled men) and their 
children. It was a federal-state program, in which 
the Federal government generally paid about 80% of 
the cost for state recipients.135 
With the advent of the Welfare Reform Act in 
1996, AFDC was replaced with TANF (Temporary 
Assistance to Needy Families), which gives states the 
flexibility to structure the program as they see fit.136 
After peaking in 1980, the total number 
of individual recipients and children 
receiving benefits in Alabama dropped 
74% and 73%, respectively.137 
Nationally, there were about 3.8 million TANF 
recipients in 2013. This is 73% lower than the 14.2 
million individuals on AFDC in 1993.138 
Prior to 1993, the number of families receiving 
AFDC was not published on a state-to-state level. 
Since then, the number of families, individual 
recipients, and children on TANF in Alabama has 
dropped by 63%, 67%, and 65%, respectively.139 
Cultural Indicators 2014: Poverty & Welfare www.alabamapolicy.org
49 
Food Stamps 
The current food stamp program began as a pilot 
program in 1961; was made a permanent program 
(operated at states’ option) in 1964; and a mandatory 
program for all states in 1974. 
Since 1970, the inflation-adjusted cost 
of the program in Alabama and the 
nation as a whole has increased 1,400% 
and 2,200%, respectively.140 
In fiscal year 2013, 47.6 million Americans received 
food stamps, at a cost of more than $76 billion. Of 
these, 915,000 were Alabama residents, at a cost of 
$1.4 billion. Since 1970, the number of program 
participants in Alabama has increased 674%, while 
national participation has increased 821%.142 
The number of food stamp recipients in Alabama 
decreased substantially at two points: between 1983 
and 1988, and between 1993 and 2000. Since 2000, 
the number of participants has more than doubled, 
from 396,000 to 915,000 in 2013, when about one 
in every five Alabamians received some support 
from food stamps.143 
Between 2000 and 2013, the number of program 
participants nationwide has increased 177%, from 
17.2 million in 2000 to 47.6 million in 2013.144 The 
number of Americans on food stamps has increased 
during this thirteen-year period from one in 16 to 
about one in seven.145 
$1,800 
$1,600 
$1,400 
$1,200 
$1,000 
$800 
$600 
$400 
$200 
$- 
1,000,000 
800,000 
600,000 
400,000 
200,000 
0 
1970 1975 1980 1985 1990 1995 2000 2005 2010 2015 
CURRENT BENEFITS (MILLIONS) 
RECIPIENTS 
Recipients Current Benefits 
Cultural Indicators 2014: Poverty & Welfare www.alabamapolicy.org
50 
SSI Benefits 
The Supplemental Security Income (SSI) program 
provides payments to the aged, blind, and disabled 
who are poor. Prior to its implementation as a 
federal program in the mid-1970s, individual 
states operated programs to assist people in these 
categories.146 
During the last 30 years, SSI has 
changed from mainly serving elderly 
individuals to being a disability 
program. In 2012, the largest 
categories of SSI payments in Alabama 
were to persons claiming blindness or 
disability (166,172; 94%).147 
Since 1975, the inflation-adjusted total of SSI 
payments Alabama residents has increased 613%. 
In 2013, payments to the 176,000 recipients of SSI 
in Alabama totaled about $1.1 billion.148 
Cultural Indicators 2014: Poverty & Welfare www.alabamapolicy.org
51 
School Lunches 
The National School Lunch Program began as 
a Depression-era program to provide surplus 
agricultural commodities to schools with needy 
children. In 1946, it was made a permanent federal 
program, and in 1962, funds were authorized for 
free and reduced price meals.149 
During the 2013 school year, 
approximately 539,000 Alabama public 
school students qualified for almost 91 
million free and reduced-priced meals. 
Nationally, almost 5.1 billion meals were 
served during the same school year.150 
Since 1989, the number of meals served in 
Alabama has decreased by about 1%, while 
increasing about 27% nationally.151 
For the 2013 school year, estimates of the total 
cost of the school lunch program in Alabama are 
$198 million and $11 billion nationwide. Since 
1989, the total, inflation-adjusted amount spent 
on school lunches in Alabama and nationwide has 
increased 41% and 94%.152 
Cultural Indicators 2014: Poverty & Welfare www.alabamapolicy.org
52 
SCHIP Benefits 
The State Children’s Health Insurance Program 
(SCHIP), also known as the Children’s Health 
Insurance Program or (CHIP), is administered by 
the U.S. Department of Health and Human Services 
to provide matching funds to help provide health 
insurance to families with children. It was created in 
1997 to assist children in families with incomes that 
are low, but too high to qualify for Medicaid.153 
In 2012, approximately 113,000 children 
in Alabama were enrolled in SCHIP, 
compared to more than 8.1 million 
nationwide.154 The total (inflation-adjusted) 
cost of SCHIP in Alabama 
was $201 million, compared to $8.6 
billion for the nation as a whole.155 
Since 1999—the earliest year data is available for 
both Alabama and the nation—SCHIP enrollment 
in Alabama rose 158%. Nationally, enrollment 
rose 143%, from almost 2 million to more than 8.1 
million in 2012.156 
Cultural Indicators 2014: Poverty & Welfare www.alabamapolicy.org
Chapter 7 
Business & Government
54 
State & Local Employees 
Since 1975, Alabama’s population has 
increased by about 31%. At the same 
time, the number of state and local 
government employees has increased by 
67% and 77%, respectively.157 
In 2012, Alabama had a total of 281,798 state and 
local government workers. Of these, 86,976 were 
state and 194,822 were local. Local government 
employees include teachers and other public 
education employees.158 
Cultural Indicators 2014: Business & Government www.alabamapolicy.org
55 
State Budget 
In fiscal year 2014, Alabama’s combined state and 
local expenditures totaled $41.7 billion, up $26.7 
since 1992 ($20.1 billion in inflation-adjusted 
dollars). Since 1992, Alabama’s total state and 
local expenditures have increased 177% (78% after 
adjusting for inflation).159 
In 1992, Alabama’s combined state and 
local budget of $15.1 billion equaled 
about 19% of the state’s gross domestic 
product (GDP) of $81.3 billion. By 
2013, the estimated budget of $41.7 
billion was 21% of the state’s GDP of 
$198 billion.160 
In 2014, the three largest components of Alabama’s 
state and local budgets were education (31%), 
health care (28%), and pensions (8%).161 
Cultural Indicators 2014: Business & Government www.alabamapolicy.org
56 
Unemployment 
Since 1976, the unemployment rates for the 
United States and Alabama have closely mirrored 
each other. As of June 2014, preliminary data 
showed Alabama with an unemployment rate 
of 6.8%, 0.7 percentage points higher than the 
national average of 6.1%.162 
Since April 2007—when Alabama’s 
employment rate was 3.3%—the rate 
has climbed 106% at the state level and 
36% at the national level.163 
Between July 2013 and July 2014, preliminary 
data show that Alabama lost 12,500 total non-farm 
jobs, for a total of 1.99 million jobs.164 The 
sectors with the greatest gains were mining and 
logging (3.4%), leisure and hospitality (2.6%), and 
education and health services (2.6%), while the 
largest loss was in government (-1.9%).165 
16 
14 
12 
10 
8 
6 
4 
2 
0 
1976 1980 1984 1988 1992 1996 2000 2004 2008 2012 
UNEMPLOYMENT RATE (PERCENT) 
Alabama U.S. 
Cultural Indicators 2014: Business & Government www.alabamapolicy.org
57 
References 
1 U.S. Census Bureau, State & County Quick Facts: Ala-bama 
(last updated July 8, 2014), http://quickfacts.census. 
gov/qfd/states/01000.html, and earlier data. 
2 Id. 
3 U.S. Census Bureau, State & County Quick Facts: Ala-bama, 
supra note 1. 
4 American Fact Finder, U.S. Census Bureau, Annual Esti-mates 
of the Resident Population for Selected Age Groups 
by Sex for the United States, States, Counties, and Puerto 
Rico Commonwealth and Municipios: April 1, 2010 to July 
1, 2013, Table PEPAGESEX, http://factfinder2.census.gov/ 
faces/tableservices/jsf/pages/productview.xhtml?pid=- 
PEP_2013_PEPAGESEX&prodType=table (last viewed Aug. 
20, 2014). 
5 American Fact Finder, U.S. Census Bureau, Annual 
Estimates of the Resident Population by Sex, Age, Race 
Alone or in Combination, and Hispanic Origin for the Unit-ed 
States and States: April 1, 2010 to July 1, 2013, Table 
PEPASR5H, http://factfinder2.census.gov/faces/tableser-vices/ 
jsf/pages/productview.xhtml?pid=PEP_2013_PEPAS-R5H& 
prodType=table (last viewed Aug. 21, 2014). 
6 American Fact Finder, U.S. Census Bureau, Estimates of 
the Components of Resident Population Change: April 1, 
2010 to July 1, 2013, Table PEPTCOMP, http://factfinder2. 
census.gov/faces/tableservices/jsf/pages/productview.xht-ml? 
src=bkmk (last viewed Aug. 21, 2014). 
7 U.S. Census Bureau, State & County Quick Facts: Ala-bama, 
supra note 1. 
8 Center for Health Statistics, Alabama Department of 
Public Health, Alabama Vital Statistics 2012 3 (Jan. 13, 
2014), available at www.adph.org/healthstats/assets/ 
AVS12.pdf. 
9 Id. 
10 Brady E. Hamilton et al., Births: Preliminary Data for 
2012, 62.3 National Vital Statistics Reports 5, (Sept. 6, 
2013), available at www.cdc.gov/nchs/data/nvsr/nvsr62/ 
nvsr62_03_tables.pdf. 
11 Center for Health Statistics, Alabama Department of 
Public Health, Alabama Vital Statistics 2012, supra note 8 
at 36. 
12 Department of Health and Human Services, State of 
Missouri, Age-Adjusted Rate, http://health.mo.gov/data/ 
mica/CDP_MICA/AARate.html (last viewed Aug. 21, 2014). 
13 U.S. Centers for Disease Control and Prevention, CDC 
Wonder: Compressed Mortality, 1999-2011 Request, won-der. 
cdc.gov/controller/datarequest/D98 (last viewed Aug. 
21, 2014). 
14 Id. 
15 Deaths: Final Data for 2011, 63.3 National Vital Sta-tistics 
Reports 83, www.cdc.gov/nchs/data/nvsr/nvsr63/ 
nvsr63_03.pdf (last viewed Aug. 22, 2014). 
16 Center for Health Statistics, Alabama Department of 
Public Health, Alabama Vital Statistics 2012, supra note 8 
at 68. 
17 Id., at 73-75. 
18 Id., at 72. 
19 Id., at 20. 
20 Joyce A. Martin et al., Births: Final Data for 2011, 
62.1 National Vital Statistics Reports (June 28, 2012), 
available at www.cdc.gov/nchs/data/nvsr/nvsr62/ 
nvsr62_01.pdf. 
21 Brady E. Hamilton et al., Births: Preliminary Data for 
2012, supra note 10. 
22 Center for Health Statistics, Alabama Department of 
Public Health, Alabama Vital Statistics 2012, supra note 8 
at 23. 
23 Id., at 30. 
24 Id., at 31. 
25 Alabama Criminal Justice Information Center, Crime 
in Alabama 2013, www.acjic.alabama.gov/file-2013_cia. 
pdf (last viewed Aug. 22, 2014). 
26 Id., and earlier editions. 
27 Id. 
28 Florida Department of Law Enforcement, UCR Offense 
Data: Crime in the U.S., 1972-2012 (Dec. 6, 2013), 
available at www.fdle.state.fl.us/Content/getdoc/ 
d75b9423-91ea-4704-86c8-5beb8c50f b61/1971_fwd_ 
totalcrime.aspx. 
29 Alabama Criminal Justice Information Center, Crime 
in Alabama 2013, supra note 25, and earlier editions. 
30 Id. 
31 Federal Bureau of Investigation, U.S. Department of 
Justice, Uniform Crime Reporting Statistics, www.ucrdata-tool. 
gov/Search/Crime/State/StateCrime.cfm (last viewed 
Aug. 22, 2014). 
32 Id. 
33 E. Ann Carson and Daniela Golinelli, U.S. Department 
of Justice, Prisoners in 2012: Advance Counts, NCJ 242467 
(July 2013), available at www.bjs.gov/content/pub/pdf/ 
p12ac.pdf. 
34 Id., and earlier reports. 
35 Id., at 40. 
36 Id. 
37 Alabama Department of Corrections, Fiscal Year 2012 
Annual Report 42, available at www.doc.state.al.us/docs/ 
AnnualRpts/2012AnnualReport.pdf. 
38 Id., at 44. 
39 Id., at 42. 
40 Id., at 17. 
41 Id. 
42 Legislative Fiscal Office, State of Alabama, Budget 
Fact Book 58, available at www.lfo.state.al.us/pdfs/Bud-get% 
20Fact%20Book/2014%20Budget%20Fact%20Book. 
pdf. 
43 Administration on Children, Youth and Families, U.S. 
Department of Health and Human Services, Child Mal-treatment 
2012 (Dec. 17, 2013), available at www.acf.hhs. 
gov/sites/default/files/cb/cm2012.pdf (last viewed Aug. 
27, 2014), and earlier editions. 
Cultural Indicators 2014: References www.alabamapolicy.org
58 
Comparisons, http://nces.ed.gov/nationsreportcard/ 
statecomparisons/Default.aspx?usrSelections=0%2c- 
MAT%2c0%2c0%2cwithin%2c0%2c0 (last viewed Aug. 24, 
2014). 
62 National Center for Education Statistics, The Na-tion’s 
Report Card: Mathematics—2013 State Snapshot 
Report (Alabama Grade 4 Public Schools), http://nces. 
ed.gov/nationsreportcard/subject/publications/stt2013/ 
pdf/2014465AL4.pdf (last viewed Aug. 25, 2014). 
63 National Center for Education Statistics, The Na-tion’s 
Report Card: Mathematics—2013 State Snapshot 
Report (Alabama Grade 8 Public Schools), http://nces. 
ed.gov/nationsreportcard/subject/publications/stt2013/ 
pdf/2014465AL8.pdf (last viewed Aug. 25, 2014). 
64 National Center for Education Statistics, The Na-tion’s 
Report Card: Reading—2013 State Snapshot Report 
(Alabama Grade 4 Public Schools), http://nces.ed.gov/ 
nationsreportcard/subject/publications/stt2013/pd-f/ 
2014464AL4.pdf (last viewed Aug. 25, 2014). 
65 National Center for Education Statistics, The Na-tion’s 
Report Card: Reading—2013 State Snapshot Report 
(Alabama Grade 8 Public Schools), http://nces.ed.gov/ 
nationsreportcard/subject/publications/stt2013/pd-f/ 
2014464AL8.pdf (last viewed Aug. 25, 2014). 
66 National Education Association, Rankings & Esti-mates: 
Rankings of the States 2013 and 
Estimates of School Statistics 2014 (Mar. 2014), www.nea. 
org/assets/docs/NEA-Rankings-and-Estimates-2013-2014. 
pdf, and earlier editions. 
67 Id. 
68 Id. 
69 Id., at 53. 
70 U.S. Census Bureau, Households, Families, Subfamilies, 
and Married Couples: 1980 to 2010, Table 59, in Statistical 
Abstract of the United States: 2012 54 (131st ed. 2001), 
available at www.census.gov/prod/2011pubs/12statab/ 
pop.pdf. 
71 Center for Health Statistics, Alabama Department of 
Public Health, Alabama Vital Statistics 2012, supra note 8 
at 78. 
72 Id. 
73 National Vital Statistics Reports, 58 Births, Marriages, 
Sex by Educational Attainment for the Population 25 Years 
and Over (White Alone), Table B15002A, in 2012 American 
Community Survey 1-Year Estimates, http://factfinder2. 
census.gov/faces/tableservices/jsf/pages/productview. 
xhtml?pid=ACS_12_1YR_B15002A&prodType=table (last 
viewed Aug. 25, 2014). Data for black population from Sex 
by Educational Attainment for the Population 25 Years and 
Over (Black or African American Alone), Table B15002B, 
in 2012 American Community Survey 1-Year Estimates, 
http://factfinder2.census.gov/faces/tableservices/ 
jsf/pages/productview.xhtml?pid=ACS_12_1YR_ 
B15002B&prodType=table (last viewed Aug. 25, 2014). 
51 U.S. Census Bureau, Percent of People 25 Years and 
Over Who Have Completed High School (Includes Equiva-lency), 
supra note 49. 
52 U.S. Census Bureau, Percent of People 25 Years and 
Over Who Have Completed a Bachelor’s Degree, supra 
note 49. 
53 U.S. Census Bureau, Median Earnings in the Past 
12 Months (In 2012 Inflation-Adjusted Dollars) by Sex 
of Educational Attainment for the Population 25 Years 
and Over, Table B20004, in 2012 American Communi-ty 
Survey 1-Year Estimates, http://factfinder2.census. 
gov/faces/tableservices/jsf/pages/productview.xhtm-l? 
pid=ACS_12_1YR_B20004&prodType=table (last viewed 
Aug. 25, 2014). 
54 ACT, 2013 ACT National and State Scores: Averaged 
Scores by State, www.act.org/newsroom/data/2013/ 
states.html (last viewed Aug. 25, 2014). 
55 ACT, 2013 ACT National and State Scores: ACT Profile Re-ports, 
www.act.org/newsroom/data/2013/profilereports. 
html (last viewed Aug. 25, 2014). 
56 ACT, ACT Profile Report – State: Graduating Class 
2013, Alabama (July 12, 2013), www.act.org/newsroom/ 
data/2013/pdf/profile/Alabama.pdf. 
57 Id., and earlier reports. 
58 Id., at 15. 
59 Id., at 14. 
60 National Center for Education Statistics, NAEP Data 
Explorer, http://nces.ed.gov/nationsreportcard/naepdata/ 
dataset.aspx (last viewed Aug. 24, 2014). 
61 National Center for Education Statistics, NAEP State 
44 Id. 
45 Id. 
46 Id. 
47 Id. 
48 White population estimates from American Fact Find-er, 
U.S. Census Bureau, Sex by Age (White Alone)—Uni-verse: 
People Who are White Alone, 2012 American Com-munity 
Survey 1-Year Estimates, Table B01001A, http:// 
factfinder2.census.gov/faces/tableservices/jsf/pages/ 
productview.xhtml?pid=ACS_12_1YR_B01001A&prod- 
Type=table (last viewed Aug. 20, 2014). Black population 
estimates from American Fact Finder, U.S. Census Bu-reau, 
Sex by Age (Black Alone)—Universe: People Who are 
Black or African-American Alone, Table B01001B, http:// 
factfinder2.census.gov/faces/tableservices/jsf/pages/ 
productview.xhtml?pid=ACS_12_1YR_B01001B&prod- 
Type=table (last viewed Aug. 20, 2014). Hispanic popula-tion 
estimates from American Fact Finder, U.S. Census 
Bureau, Sex by Age (Hispanic or Latino)—Universe: People 
Who are Hispanic or Latino, 2012 American Community 
Survey 1-Year Estimates, Table B01001I, http://factfinder2. 
census.gov/faces/tableservices/jsf/pages/productview. 
xhtml?pid=ACS_12_1YR_B01001I&prodType=table (last 
viewed Aug. 20, 2014). 
49 U.S. Census Bureau, Percent of People 25 Years 
and Over Who Have Completed High School (Includes 
Equivalency), Table R1501, in 2012 American Community 
Survey 1-Year Estimates, http://factfinder2.census. 
gov/faces/tableservices/jsf/pages/productview. 
xhtml?pid=ACS_12_1YR_R1501.US01PRF&prodType=table 
(last viewed Aug. 25, 2014); and U.S. Census Bureau, 
Percent of People 25 Years and Over Who Have Completed 
a Bachelor’s Degree, Table R1502, in 2012 American 
Community Survey 1-Year Estimates, http://factfinder2. 
census.gov/faces/tableservices/jsf/pages/productview. 
xhtml?pid=ACS_12_1YR_R1502.US01PRF&prodType=table 
(last viewed Aug. 25, 2014). Earlier data from U.S. Census 
Bureau, Statistical Abstract of the United States: 2000 
(119th ed. 2001). 
50 U.S. Census Bureau, 1970 Census of Population: 
Vol. I—Characteristics of the Population 2-154 
(Feb. 1973), www2.census.gov/prod2/decennial/ 
documents/1970a_al.zip. Data for white population from 
Cultural Indicators 2014: References www.alabamapolicy.org
59 
Divorces, and Deaths: Provisional Data for 2009 5 (Aug. 27, 
2010), available at www.cdc.gov/nchs/data/nvsr/nvsr58/ 
nvsr58_25.htm. 
74 Center for Health Statistics, Alabama Department of 
Public Health, Alabama Vital Statistics 2012, supra note 8 
at 82. 
75 Id. 
76 National Vital Statistics Reports, 58 Births, Marriag-es, 
Divorces, and Deaths: Provisional Data for 2009, supra 
note 73. 
77 Center for Health Statistics, Alabama Department of 
Public Health, Alabama Vital Statistics 2012, supra note 8 
at 82. 
78 Id., at 85. 
79 Id., at 84. 
80 Id. 
81 Pat Fagan, Marriage & Religion Research Institute, 
The Fourth Annual Index of Belonging and Rejection, Fam-ily 
Research Council (2014), available at http://down-loads. 
frc.org/EF/EF14B32.pdf. Estimates of 15-17-year-olds 
from U.S. Census Bureau, 2009-2011 and 2010-2012 
American Community Survey 3-Year Estimates, Table 
S0101, http://factfinder2.census.gov/faces/tableservices/ 
jsf/pages/productview.xhtml?pid=ACS_11_3YR_ 
S0101&prodType=table (last viewed Feb. 18, 2014). 
82 Id. 
83 Fagan, The Fourth Annual Index of Belonging and Rejec-tion, 
supra note 81. 
84 Id. 
85 Center for Health Statistics, Alabama Department of 
Public Health, Alabama Vital Statistics 2012, supra note 8 
at 9. 
86 Brady E. Hamilton et al., Births: Preliminary Data for 
2013, 63.2 National Vital Statistics Reports, supra note 
10 at 14. 
87 Center for Health Statistics, Alabama Department of 
Public Health, Alabama Vital Statistics 2012, supra note 8 
at 9. 
88 Joyce A. Martin et al., Births: Final Data for 2012, 62.9 
National Vital Statistics Reports (Dec. 30, 2013), avail-able 
at www.cdc.gov/nchs/data/nvsr/nvsr62/nvsr62_09_ 
tables.pdf. 
89 Center for Health Statistics, Alabama Department of 
Public Health, Alabama Vital Statistics 2012, supra note 8 
at 9. 
90 Id. 
91 Id., at 8. 
92 Guttmacher Institute, Fact Sheet: Induced Abortion 
in the United States (July 2014), www.guttmacher.org/ 
pubs/fb_induced_abortion.pdf. National data and earlier 
state data from U.S. Census Bureau, Abortions—Number 
and Rate by Race: 1990 to 2007, Table 101, in Statistical 
Abstract of the United States: 2012 75 (131st ed. 2012), 
available at www.census.gov/prod/2011pubs/12statab/ 
vitstat.pdf. 
93 Center for Health Statistics, Alabama Department of 
Public Health, Alabama Vital Statistics 2012, supra note 8 
at 31. 
94 Guttmacher Institute, State Facts about Abortion (July 
2, 2014), www.guttmacher.org/statecenter/sfaa.html. 
95 Guttmacher Institute, Fact Sheet: Induced Abortion in 
the United States (July 2014), www.guttmacher.org/pubs/ 
fb_induced_abortion.html. 
96 Id., and earlier editions. 
97 American Fact Finder, U.S. Census Bureau, Annual Es-timates 
of the Resident Population: April 1, 2010 to July 1, 
2013 - United States -- Metropolitan Statistical Area; and 
for Puerto Rico, Table GCT-PEPANNRES (Mar. 2014), http:// 
factfinder2.census.gov/faces/tableservices/jsf/pages/pro-ductview. 
xhtml?src=bkmk. 
Data for white population from Sex by Educational Attain-ment 
for the Population 25 Years and Over (White Alone), 
supra note 50. 
98 American Fact Finder, U.S. Census Bureau, Family 
Type by Presence and Age of Own Children Under 18 Year, 
Table B11003, http://factfinder2.census.gov/faces/table-services/ 
jsf/pages/productview.xhtml?pid=ACS_12_1YR_ 
B11003&prodType=table (last viewed Aug. 28, 2014), and 
earlier editions. 
99 Id. 
100 U.S. Census Bureau, Families by Presence of Own 
Children under 18: 1950 to Present, Table FM-1 (Nov. 
2013), www.census.gov/hhes/families/data/families.html 
(last viewed Aug. 28, 2014). 
101 Social Security Administration, Number of 
Recipients, Total Payments, and Average 
Payment, by State, Fiscal Year 2010, Table 8.H1, in Annual 
Statistical Supplement to the Social Security Bulletin, 
2012 (Feb. 2013), available at www.ssa.gov/policy/docs/ 
statcomps/supplement/2012/8h.pdf, and earlier reports. 
102 Id. 
103 Id. 
104 Social Security Administration, Medicare, in Annual 
Statistical Supplement to the Social Security Bulletin, 
2012 36 (Feb. 2013), available at www. 
ssa.gov/policy/docs/statcomps/supplement/2012/medi-care. 
pdf. 
105 Centers for Medicare & Medicaid Services, Medicare 
Enrollment: Hospital Insurance and/or Supplementary 
Medical Insurance for Aged and Disabled Enrollees and To-tal 
Resident 
Population by State of Residence as of July 1, 2012, 
Table 2.8, in Medicare & Medicaid Statistical Supple-ment, 
2013 Edition (Jan. 2, 2014), available at www. 
cms.gov/Research-Statistics-Data-and-Systems/Statis-tics- 
Trends-and-Reports/MedicareMedicaidStatSupp/ 
Downloads/2013_Section2.pdf#Table2.8, and earlier re-ports. 
106 Id. 
107 Centers for Medicare & Medicaid Services, Medicare 
Program Payments, by Type of 
Coverage, and Type of Entitlement: Calendar Years 1967- 
2011, Table 3.2, in Medicare & Medicaid Statistical 
Supplement, 2012 Edition (Mar. 12, 2013), available at 
www.cms.gov/Research-Statistics-Data-and-Systems/Sta-tistics- 
Trends-and-Reports/MedicareMedicaidStatSupp/ 
Downloads/2012ProgPayments.zip. 
108 Centers for Disease Control and Prevention, Chla-mydia: 
CDC Fact Sheet, www. 
cdc.gov/std/chlamydia/STDFact-Chlamydia.htm (last up-dated 
June 30, 2014). 
109 Centers for Disease Control and Prevention, Sexual-ly 
Transmitted Disease Surveillance 2012 79-80 (Jan. 2014), 
Cultural Indicators 2014: References www.alabamapolicy.org
60 
www.cdc.gov/std/stats12/Surv2012.pdf, and earlier data. 
110 Remedy Health Media, Sexually Transmitted Diseases 
and Infections (May 31, 2011), 
www.healthcommunities.com/std/sexuallytransmitted-disease- 
overview.shtml (last viewed 
Jan. 3, 2014). 
111 Centers for Disease Control and Prevention, Sexual-ly 
Transmitted Disease Surveillance 2012, supra note 109 
at 81. 
112 Centers for Disease Control and Prevention, 
Gonorrhea: CDC Fact Sheet, www.cdc.gov/std/gonorrhea/ 
STDFact-gonorrhea.htm (last updated July 1, 2014). 
113 Centers for Disease Control and Prevention, Sexual-ly 
Transmitted Disease Surveillance 2012, supra note 109 
at 94. 
114 Id., at 93. 
115 Centers for Disease Control and Prevention, 
Syphilis: CDC Fact Sheet, www.cdc.gov/std/syphilis/STD-Fact- 
Syphilis.htm (last updated July 8, 2014). 
116 Centers for Disease Control and Prevention, Sexual-ly 
Transmitted Disease Surveillance 2012, supra note 109 
at 105. 
117 Margaret T. Kay & Suzanne M. Ingle, Life Expectancy of 
HIV-Positive Adults: A Review. 8 
Sexual Health (2011), 526-533 
118 Gerald L. Mandell et al., eds., Mandell, Douglas, and 
Bennett’s Principles and Practice of Infectious Diseases 
(7th ed. 2010). 
119 Centers for Disease Control and Prevention, 
23 HIV Surveillance Report, 2011 68 (Feb. 2013), 
available at www.cdc.gov/hiv/surveillance/resources/ 
reports/2011report/pdf/2011_HIV_Surveillance_ 
Report_vol_23.pdf#Page=68, and earlier reports. 
120 Id., at 17. 
121 Id., at 71-72. 
122 Id., at 17-18. 
123 Centers for Disease Control and Prevention, Techni-cal 
Notes, in 19 HIV/AIDS Surveillance Report, 2007 (2009), 
available at www.cdc.gov/hiv/surveillance/resources/re-ports/ 
2007report/pdf/technicalnotes.pdf. 
124 American Fact Finder, U.S. Census Bureau, Selected 
Population Profile in the United States: 2012 American 
Community Survey 1-Year Estimates, Table S0201, 
http://factfinder2.census.gov/faces/tableservices/ 
jsf/pages/productview.xhtml?pid=ACS_12_1YR_ 
S0201&prodType=table (last viewed Jan. 3, 2014), and 
earlier data. Other data from Carmen Denavas-Walt et 
al., U.S. Census Bureau, Income, Poverty, and Health 
Insurance Coverage in the United States: 2011 (Sept. 
2012), available at www.census.gov/prod/2012pubs/ 
p60-243.pdf; and Carmen Denavas-Walt & Robert W. 
Cleveland, U.S. Census Bureau, Money Income in the 
United States: 2001 (Sept. 2002), available at www.census. 
gov/prod/2002pubs/p60-218.pdf. 
125 Id. 
126 Id. 
127 Id. 
128 U.S. Census Bureau, American Housing Survey 2011 
AHS National and Metropolitan Area Summary Data, 
www.census.gov/housing/ahs/data/national.html (last 
viewed Aug. 25, 2014). 
129 Office of Policy Development and Research, U.S. 
Department of Housing and Urban Development, 
American Housing Survey for the United States: 2009 (Mar. 
2011), available at www.census.gov/prod/2011pubs/ 
h150-09.pdf. 
130 U.S. Census Bureau, Poverty: How the Census Bureau 
Measures Poverty (Dec. 3, 2013), www.census.gov/hhes/ 
www/poverty/about/overview/measure.html. 
131 American Fact Finder, U.S. Census Bureau, Poverty 
Status in the Past 12 Months of Families by Household Type 
by Presence of Own Children Under 18 Years, 2012 Amer-ican 
Community Survey 1-Year Estimates, Table C17023, 
http://factfinder2.census.gov/faces/tableservices/jsf/pag-es/ 
productview.xhtml?pid=ACS_12_1YR_C17023&prod- 
Type=table (last viewed Aug. 29, 2014), and earlier data. 
132 Id. 
133 Id. 
134 Id. 
135 Social Welfare History Project, Aid to Dependent 
Children: The Legal History, www.socialwelfarehistory. 
com/programs/aid-to-dependent-children-the-legal-histo-ry/ 
(last viewed Sept. 4, 2014). 
136 Child Trends, Child Recipients of Welfare (AFDC/TANF), 
www.childtrends.org/?indicators=child-recipients-of-wel-fareafdctanf 
(last updated Aug. 2014). 
137 Office of Family Assistance, U.S. Department of 
Health & Human Services, Caseload Data 2013 (May 23, 
2014), www.acf.hhs.gov/programs/ofa/resource/case-load- 
data-2013. 
138 Id., and Administration for Children & Families, U.S. 
Department of Health & Human Services, Archives: 1993, 
http://archive.acf.hhs.gov/programs/ofa/data-reports/ 
caseload/afdc/1993/fycytotal93_ek.htm (last updated Dec. 
19, 2004). 
139 Office of Family Assistance, U.S. Department of 
Health & Human Services, Caseload Data 2013, supra note 
137. 
140 All federal and state data (2009-2013) from Food and 
Nutrition Service, U.S. Department of Agriculture, 
Program Data: Supplemental Nutrition Assistance Program 
(Dec. 6, 2013), www.fns.usda.gov/pd/supplemental-nutrition- 
assistance-program-snap. Earlier state data 
from Nadine Nichols, Food and Nutrition Service, U.S. 
Department of Agriculture, custom data request, Mar. 14, 
2013 
141 Id. 
142 Id. 
143 Id. 
144 Id. 
145 Id. 
146 Social Security Administration, Supplemental Secu-rity 
Income Program Description and Legislative History, 
in Annual Statistical Supplement to the Social Security 
Bulletin, 2012, www.ssa.gov/policy/docs/statcomps/sup-plement/ 
2012/ssi.html (last viewed Sept. 4, 2014) 
147 Id. 
148 Social Security Administration, Number of Recipients 
of Federally Administered Payments, December 2012, and 
Total Payments for Calendar Year 2012, by State and Other 
Area and Eligibility Category, Table 7.B1, in Annual Statis-tical 
Supplement to the Social Security Bulletin, (Feb. 
2014), available at www.ssa.gov/policy/docs/statcomps/ 
supplement/2013/7b.pdf, and earlier data. Other data 
Cultural Indicators 2014: References www.alabamapolicy.org
61 
from U.S. Census Bureau, Supplemental Security Income 
(SSI)—Recipients and Payments by State and Other Area: 
2000 to 2009, Table 564, in Statistical Abstract of the Unit-ed 
States: 2012 364 (131st ed. 2012), available at www. 
census.gov/prod/2011pubs/12statab/socins.pdf, and earli-er 
editions. 
149 Food and Nutrition Service, U.S. Department of Ag-riculture, 
National School Lunch Program (NSLP): Back-ground 
and Development, www.fns.usda.gov/nslp/history 
(last modified June 17, 2014). 
150 Recent data (2009-13) from Food and Nutrition Ser-vice, 
U.S. Department of Agriculture, Program Data: 
Child Nutrition Tables, www.fns.usda.gov/pd/cnpmain. 
htm (last viewed Jan. 3, 2014). Earlier data from Food and 
Nutrition Service, U.S. Department of Agriculture, Office of 
Research and Analysis, custom data request, Jan. 4, 2013. 
151 Id. 
152 Id. 
153 Centers for Medicare and Medicaid Services, U.S. 
Department of Health and Human Services, Children’s 
Health Insurance Program (CHIP), www.medicaid.gov/ 
Medicaid-CHIP-Program-Information/By-Topics/Childrens- 
Health-Insurance-Program-CHIP/Childrens-Health- 
Insurance-Program-CHIP.html#TopOfPage (last viewed Aug. 
30, 2013). 
154 Henry J. Kaiser Family Foundation, Number of 
Children Ever Enrolled in the Children’s Health Insurance 
Program (CHIP), Family Facts, http://kff.org/other/ 
state-indicator/annual-chipenrollment/(last viewed Jan. 
4, 2013); and U.S. Census Bureau, Children’s Health 
Insurance Program (CHIP)—Enrollment and Expenditures 
by State: 2000 and 2010, Table 145, in Statistical Abstract 
of the United States: 2012 106 (131st ed. 2012), available 
at www.census.gov/prod/2011pubs/12statab/health.pdf, 
and earlier editions. 
155 Center for Children and Families, Georgetown 
University Health Policy Institute, Federal and State 
Share of CHIP Spending, FY 2012 (millions), (Apr. 12, 2013), 
http://ccf.georgetown.edu/wp-content/uploads/2012/04/ 
CHIP-Spending1.pdf. 
156 Henry J. Kaiser Family Foundation, supra note 154. 
157 State employee data from U.S. Census Bureau, 2012 
Public Employment and Payroll Data: State Governments— 
Alabama, www2.census.gov/govs/apes/12stal.txt (last 
viewed Aug. 30, 2014). Local public employee data from 
U.S. Census Bureau, 2012 Public Employment and Payroll 
Data: Local Governments—Alabama, www2.census.gov/ 
govs/apes/12local.txt (last viewed Aug. 30, 2014). 
158 Id. 
159 Christopher Chantrill, Florida Government 
Spending Chart, USGovernmentSpending.com, www. 
usgovernmentspending.com/spending_chart_2000_2014 
ALt_15s2li011mcn__US_Real_Gross_Domestic_Product_ 
History (last viewed Jan. 1, 2014). 
160 Id. 
161 Id. 
162 State unemployment data from Bureau of Labor 
Statistics, U.S. Department of Labor, Local Area 
Unemployment Statistics, www.bls.gov/lau/ (last 
viewed Aug. 30, 2014), (in “Databases” menu, follow 
“Multi-Screen Data Search”; then “01 Alabama”; then 
“A Statewide”; then “ST010000 Florida”; then “03 
Unemployment Rate”; then “Seasonally Adjusted”; and 
then “Retrieve Data”). National unemployment data 
from Bureau of Labor Statistics, U.S. Department of 
Labor, Employment Status of the Civilian Noninstitutional 
Population 16 Years and Over, 1978 to Date, Table A-1, 
www.bls.gov/web/empsit/cpseea01.htm (last updated 
Aug. 1, 2014). 
163 Id. 
164 Bureau of Labor Statistics, U.S. Department of La-bor, 
Local Area Unemployment Statistics, http://data.bls. 
gov/timeseries/LASST010000000000005?data_tool=XG-table 
(last viewed Aug. 30, 2014). 
165 Bureau of Labor Statistics, U.S. Department of La-bor, 
Economy at a Glance: Alabama (Aug. 27, 2014), ww-w. 
bls.gov/eag/eag.al.htm. 
Cultural Indicators 2014: References www.alabamapolicy.org

More Related Content

What's hot

Underage Dirnking-Harding et al
Underage Dirnking-Harding et alUnderage Dirnking-Harding et al
Underage Dirnking-Harding et alRob Vincent
 
Registering Harm - How sex offense registries fail youth and communities
Registering Harm - How sex offense registries fail youth and communitiesRegistering Harm - How sex offense registries fail youth and communities
Registering Harm - How sex offense registries fail youth and communitiessoissues
 
Report Card on American Education 20th Edition
Report Card on American Education 20th EditionReport Card on American Education 20th Edition
Report Card on American Education 20th EditionALEC
 
04.pinpoint protect child watch workshop
04.pinpoint protect child watch workshop04.pinpoint protect child watch workshop
04.pinpoint protect child watch workshopforensicsnation
 
State of America's Fathers 2016
State of America's  Fathers 2016State of America's  Fathers 2016
State of America's Fathers 2016Ameya Ashok Naik
 
First Nations and Metis Youth Suicide in Saskatchewan
First Nations and Metis Youth Suicide in SaskatchewanFirst Nations and Metis Youth Suicide in Saskatchewan
First Nations and Metis Youth Suicide in SaskatchewanKelly C. Patrick
 
Left Out, Left Behind
Left Out, Left BehindLeft Out, Left Behind
Left Out, Left Behindrhccweb
 
Confronting Challenges of Diversity 7-7-15_final version
Confronting Challenges of Diversity 7-7-15_final versionConfronting Challenges of Diversity 7-7-15_final version
Confronting Challenges of Diversity 7-7-15_final versionCarlotta Brantley Paige
 
Neat Document-Coppin Changing Lives One Note At A Time - Baltimore Maryland N...
Neat Document-Coppin Changing Lives One Note At A Time - Baltimore Maryland N...Neat Document-Coppin Changing Lives One Note At A Time - Baltimore Maryland N...
Neat Document-Coppin Changing Lives One Note At A Time - Baltimore Maryland N...Hugh W. Barnes, Jr.
 
2017 Year of Homeless Youth Resolution
2017 Year of Homeless Youth Resolution2017 Year of Homeless Youth Resolution
2017 Year of Homeless Youth ResolutionCris Plunkett
 
Education 6305 afterschool
Education 6305  afterschoolEducation 6305  afterschool
Education 6305 afterschoolrkellar
 
The_Economics_of_Same-Sex_Parenting _ Reporting_Texas
The_Economics_of_Same-Sex_Parenting _ Reporting_TexasThe_Economics_of_Same-Sex_Parenting _ Reporting_Texas
The_Economics_of_Same-Sex_Parenting _ Reporting_TexasYimou Lee
 
Education Funding, a State Lottery, and Morality Policy- Can Time Heal All Wo...
Education Funding, a State Lottery, and Morality Policy- Can Time Heal All Wo...Education Funding, a State Lottery, and Morality Policy- Can Time Heal All Wo...
Education Funding, a State Lottery, and Morality Policy- Can Time Heal All Wo...Brett Snider
 

What's hot (20)

Lgbt final
Lgbt finalLgbt final
Lgbt final
 
Underage Dirnking-Harding et al
Underage Dirnking-Harding et alUnderage Dirnking-Harding et al
Underage Dirnking-Harding et al
 
orange
orangeorange
orange
 
Registering Harm - How sex offense registries fail youth and communities
Registering Harm - How sex offense registries fail youth and communitiesRegistering Harm - How sex offense registries fail youth and communities
Registering Harm - How sex offense registries fail youth and communities
 
KCCD AAPI Immigration Reform Data
KCCD AAPI Immigration Reform DataKCCD AAPI Immigration Reform Data
KCCD AAPI Immigration Reform Data
 
Report Card on American Education 20th Edition
Report Card on American Education 20th EditionReport Card on American Education 20th Edition
Report Card on American Education 20th Edition
 
04.pinpoint protect child watch workshop
04.pinpoint protect child watch workshop04.pinpoint protect child watch workshop
04.pinpoint protect child watch workshop
 
Ryi stats 10
Ryi stats 10Ryi stats 10
Ryi stats 10
 
LDC 2016 Fact Book
LDC 2016 Fact BookLDC 2016 Fact Book
LDC 2016 Fact Book
 
State of America's Fathers 2016
State of America's  Fathers 2016State of America's  Fathers 2016
State of America's Fathers 2016
 
First Nations and Metis Youth Suicide in Saskatchewan
First Nations and Metis Youth Suicide in SaskatchewanFirst Nations and Metis Youth Suicide in Saskatchewan
First Nations and Metis Youth Suicide in Saskatchewan
 
Left Out, Left Behind
Left Out, Left BehindLeft Out, Left Behind
Left Out, Left Behind
 
Confronting Challenges of Diversity 7-7-15_final version
Confronting Challenges of Diversity 7-7-15_final versionConfronting Challenges of Diversity 7-7-15_final version
Confronting Challenges of Diversity 7-7-15_final version
 
FInaldraft
FInaldraftFInaldraft
FInaldraft
 
AAPI Housing Data
AAPI Housing Data AAPI Housing Data
AAPI Housing Data
 
Neat Document-Coppin Changing Lives One Note At A Time - Baltimore Maryland N...
Neat Document-Coppin Changing Lives One Note At A Time - Baltimore Maryland N...Neat Document-Coppin Changing Lives One Note At A Time - Baltimore Maryland N...
Neat Document-Coppin Changing Lives One Note At A Time - Baltimore Maryland N...
 
2017 Year of Homeless Youth Resolution
2017 Year of Homeless Youth Resolution2017 Year of Homeless Youth Resolution
2017 Year of Homeless Youth Resolution
 
Education 6305 afterschool
Education 6305  afterschoolEducation 6305  afterschool
Education 6305 afterschool
 
The_Economics_of_Same-Sex_Parenting _ Reporting_Texas
The_Economics_of_Same-Sex_Parenting _ Reporting_TexasThe_Economics_of_Same-Sex_Parenting _ Reporting_Texas
The_Economics_of_Same-Sex_Parenting _ Reporting_Texas
 
Education Funding, a State Lottery, and Morality Policy- Can Time Heal All Wo...
Education Funding, a State Lottery, and Morality Policy- Can Time Heal All Wo...Education Funding, a State Lottery, and Morality Policy- Can Time Heal All Wo...
Education Funding, a State Lottery, and Morality Policy- Can Time Heal All Wo...
 

Viewers also liked

Development revision ppt
Development revision pptDevelopment revision ppt
Development revision pptSBrooker
 
Power point from poverty to potential
Power point from poverty to potentialPower point from poverty to potential
Power point from poverty to potentialallysonschoenlein
 
Education in poverty stricken areas
Education in poverty stricken areasEducation in poverty stricken areas
Education in poverty stricken areasmsthomson24
 
Foreign Aid and Higher Education in Africa: With a Special Focus on the Role ...
Foreign Aid and Higher Education in Africa: With a Special Focus on the Role ...Foreign Aid and Higher Education in Africa: With a Special Focus on the Role ...
Foreign Aid and Higher Education in Africa: With a Special Focus on the Role ...elegantbrain
 
Social Justice: Culture & Poverty
Social Justice: Culture & PovertySocial Justice: Culture & Poverty
Social Justice: Culture & PovertyDouglas Strahler
 
Debt Relief for Poorer Countries
Debt Relief for Poorer CountriesDebt Relief for Poorer Countries
Debt Relief for Poorer Countriestutor2u
 
Eradication of poverty
Eradication of povertyEradication of poverty
Eradication of povertyShahzad Khan
 
A Closer Look to the Educational Sytems of the World
A Closer Look to the Educational Sytems of the WorldA Closer Look to the Educational Sytems of the World
A Closer Look to the Educational Sytems of the Worldghostfreak09
 
Social Work and Social Development in Nigeria - Issues & Challenges
Social Work and Social Development in Nigeria  -  Issues & ChallengesSocial Work and Social Development in Nigeria  -  Issues & Challenges
Social Work and Social Development in Nigeria - Issues & Challengesguestdfeaacd
 
International Trade
International TradeInternational Trade
International TradeEthel
 
International trade ppt
International trade pptInternational trade ppt
International trade pptAndrea Mendoza
 
Society, Culture and Family Planning with Population Education
Society, Culture and Family Planning with Population EducationSociety, Culture and Family Planning with Population Education
Society, Culture and Family Planning with Population EducationMylene Almario
 
SOCIO-CULTURAL IMPACTS OF TOURISM
SOCIO-CULTURAL IMPACTS OF TOURISMSOCIO-CULTURAL IMPACTS OF TOURISM
SOCIO-CULTURAL IMPACTS OF TOURISMEjay Samson
 

Viewers also liked (17)

Development revision ppt
Development revision pptDevelopment revision ppt
Development revision ppt
 
Power point from poverty to potential
Power point from poverty to potentialPower point from poverty to potential
Power point from poverty to potential
 
Education in poverty stricken areas
Education in poverty stricken areasEducation in poverty stricken areas
Education in poverty stricken areas
 
Foreign Aid and Higher Education in Africa: With a Special Focus on the Role ...
Foreign Aid and Higher Education in Africa: With a Special Focus on the Role ...Foreign Aid and Higher Education in Africa: With a Special Focus on the Role ...
Foreign Aid and Higher Education in Africa: With a Special Focus on the Role ...
 
Social Justice: Culture & Poverty
Social Justice: Culture & PovertySocial Justice: Culture & Poverty
Social Justice: Culture & Poverty
 
Debt Relief for Poorer Countries
Debt Relief for Poorer CountriesDebt Relief for Poorer Countries
Debt Relief for Poorer Countries
 
Social development
Social developmentSocial development
Social development
 
Eradication of poverty
Eradication of povertyEradication of poverty
Eradication of poverty
 
A Closer Look to the Educational Sytems of the World
A Closer Look to the Educational Sytems of the WorldA Closer Look to the Educational Sytems of the World
A Closer Look to the Educational Sytems of the World
 
Social development
Social developmentSocial development
Social development
 
Social Work and Social Development in Nigeria - Issues & Challenges
Social Work and Social Development in Nigeria  -  Issues & ChallengesSocial Work and Social Development in Nigeria  -  Issues & Challenges
Social Work and Social Development in Nigeria - Issues & Challenges
 
Understanding Poverty Through Social Media
Understanding Poverty Through Social MediaUnderstanding Poverty Through Social Media
Understanding Poverty Through Social Media
 
International Trade
International TradeInternational Trade
International Trade
 
International trade ppt
International trade pptInternational trade ppt
International trade ppt
 
Elearning.ppt
Elearning.pptElearning.ppt
Elearning.ppt
 
Society, Culture and Family Planning with Population Education
Society, Culture and Family Planning with Population EducationSociety, Culture and Family Planning with Population Education
Society, Culture and Family Planning with Population Education
 
SOCIO-CULTURAL IMPACTS OF TOURISM
SOCIO-CULTURAL IMPACTS OF TOURISMSOCIO-CULTURAL IMPACTS OF TOURISM
SOCIO-CULTURAL IMPACTS OF TOURISM
 

Similar to Cultural indicators 2014 (final)

Dale Quinney Transforming Rural AL
Dale Quinney   Transforming Rural ALDale Quinney   Transforming Rural AL
Dale Quinney Transforming Rural ALSamantha Haas
 
Community mapping presentation: Tk’emlups te Secwepemc
Community mapping presentation: Tk’emlups te SecwepemcCommunity mapping presentation: Tk’emlups te Secwepemc
Community mapping presentation: Tk’emlups te SecwepemcJoelaab
 
Gen X and Y? Because we like them!
Gen X and Y? Because we like them!Gen X and Y? Because we like them!
Gen X and Y? Because we like them!MesaPublicLibrary
 
United South End Settlements Environmental Scan 2014
United South End Settlements Environmental Scan 2014United South End Settlements Environmental Scan 2014
United South End Settlements Environmental Scan 2014Kimberly Dinehart
 
Ethnicity and Democracy Findings from Afrobarometer:Round 6 Survey in Zambia
Ethnicity and Democracy Findings from Afrobarometer:Round 6 Survey in ZambiaEthnicity and Democracy Findings from Afrobarometer:Round 6 Survey in Zambia
Ethnicity and Democracy Findings from Afrobarometer:Round 6 Survey in ZambiaAfrobarometer
 
African american-consumer-untold-story-sept-2015
African american-consumer-untold-story-sept-2015African american-consumer-untold-story-sept-2015
African american-consumer-untold-story-sept-2015Loyalty Consultants FZ
 
Roxyanne C. Burrus for Ohio Senate-District 3
Roxyanne C. Burrus for Ohio Senate-District 3Roxyanne C. Burrus for Ohio Senate-District 3
Roxyanne C. Burrus for Ohio Senate-District 3247Interactive
 
Bcop pam final
Bcop pam  finalBcop pam  final
Bcop pam finalrcason01
 
nutritionprofiles_california_101916
nutritionprofiles_california_101916nutritionprofiles_california_101916
nutritionprofiles_california_101916David Thomsen
 
C ommentariesEnding Childhood Poverty in America 0c—Mari.docx
C ommentariesEnding Childhood Poverty in America 0c—Mari.docxC ommentariesEnding Childhood Poverty in America 0c—Mari.docx
C ommentariesEnding Childhood Poverty in America 0c—Mari.docxjasoninnes20
 
Exploring Public Health in Georgia and Metro Atlanta
Exploring Public Health in Georgia and Metro AtlantaExploring Public Health in Georgia and Metro Atlanta
Exploring Public Health in Georgia and Metro AtlantaARCResearch
 
Women of Liberia
Women of LiberiaWomen of Liberia
Women of Liberiacarla
 

Similar to Cultural indicators 2014 (final) (20)

Dale Quinney Transforming Rural AL
Dale Quinney   Transforming Rural ALDale Quinney   Transforming Rural AL
Dale Quinney Transforming Rural AL
 
Literacy Fact Sheet
Literacy Fact SheetLiteracy Fact Sheet
Literacy Fact Sheet
 
Community mapping presentation: Tk’emlups te Secwepemc
Community mapping presentation: Tk’emlups te SecwepemcCommunity mapping presentation: Tk’emlups te Secwepemc
Community mapping presentation: Tk’emlups te Secwepemc
 
Gen X and Y? Because we like them!
Gen X and Y? Because we like them!Gen X and Y? Because we like them!
Gen X and Y? Because we like them!
 
United South End Settlements Environmental Scan 2014
United South End Settlements Environmental Scan 2014United South End Settlements Environmental Scan 2014
United South End Settlements Environmental Scan 2014
 
Ethnicity and Democracy Findings from Afrobarometer:Round 6 Survey in Zambia
Ethnicity and Democracy Findings from Afrobarometer:Round 6 Survey in ZambiaEthnicity and Democracy Findings from Afrobarometer:Round 6 Survey in Zambia
Ethnicity and Democracy Findings from Afrobarometer:Round 6 Survey in Zambia
 
Hawaii Census data by county
Hawaii Census data by countyHawaii Census data by county
Hawaii Census data by county
 
African american-consumer-untold-story-sept-2015
African american-consumer-untold-story-sept-2015African american-consumer-untold-story-sept-2015
African american-consumer-untold-story-sept-2015
 
Roxyanne C. Burrus for Ohio Senate-District 3
Roxyanne C. Burrus for Ohio Senate-District 3Roxyanne C. Burrus for Ohio Senate-District 3
Roxyanne C. Burrus for Ohio Senate-District 3
 
pie chart.pptx
pie chart.pptxpie chart.pptx
pie chart.pptx
 
Racial wealth gap
Racial wealth gapRacial wealth gap
Racial wealth gap
 
Racial Wealth Gap
Racial Wealth GapRacial Wealth Gap
Racial Wealth Gap
 
Health and Socioeconomic Status
Health and Socioeconomic StatusHealth and Socioeconomic Status
Health and Socioeconomic Status
 
Bcop pam final
Bcop pam  finalBcop pam  final
Bcop pam final
 
11:11 Print Ready
11:11 Print Ready11:11 Print Ready
11:11 Print Ready
 
PovertyInAmerica.ppt
PovertyInAmerica.pptPovertyInAmerica.ppt
PovertyInAmerica.ppt
 
nutritionprofiles_california_101916
nutritionprofiles_california_101916nutritionprofiles_california_101916
nutritionprofiles_california_101916
 
C ommentariesEnding Childhood Poverty in America 0c—Mari.docx
C ommentariesEnding Childhood Poverty in America 0c—Mari.docxC ommentariesEnding Childhood Poverty in America 0c—Mari.docx
C ommentariesEnding Childhood Poverty in America 0c—Mari.docx
 
Exploring Public Health in Georgia and Metro Atlanta
Exploring Public Health in Georgia and Metro AtlantaExploring Public Health in Georgia and Metro Atlanta
Exploring Public Health in Georgia and Metro Atlanta
 
Women of Liberia
Women of LiberiaWomen of Liberia
Women of Liberia
 

Recently uploaded

25042024_First India Newspaper Jaipur.pdf
25042024_First India Newspaper Jaipur.pdf25042024_First India Newspaper Jaipur.pdf
25042024_First India Newspaper Jaipur.pdfFIRST INDIA
 
2024 03 13 AZ GOP LD4 Gen Meeting Minutes_FINAL.docx
2024 03 13 AZ GOP LD4 Gen Meeting Minutes_FINAL.docx2024 03 13 AZ GOP LD4 Gen Meeting Minutes_FINAL.docx
2024 03 13 AZ GOP LD4 Gen Meeting Minutes_FINAL.docxkfjstone13
 
2024 02 15 AZ GOP LD4 Gen Meeting Minutes_FINAL_20240228.docx
2024 02 15 AZ GOP LD4 Gen Meeting Minutes_FINAL_20240228.docx2024 02 15 AZ GOP LD4 Gen Meeting Minutes_FINAL_20240228.docx
2024 02 15 AZ GOP LD4 Gen Meeting Minutes_FINAL_20240228.docxkfjstone13
 
Minto-Morley Reforms 1909 (constitution).pptx
Minto-Morley Reforms 1909 (constitution).pptxMinto-Morley Reforms 1909 (constitution).pptx
Minto-Morley Reforms 1909 (constitution).pptxAwaiskhalid96
 
TDP As the Party of Hope For AP Youth Under N Chandrababu Naidu’s Leadership
TDP As the Party of Hope For AP Youth Under N Chandrababu Naidu’s LeadershipTDP As the Party of Hope For AP Youth Under N Chandrababu Naidu’s Leadership
TDP As the Party of Hope For AP Youth Under N Chandrababu Naidu’s Leadershipanjanibaddipudi1
 
KAHULUGAN AT KAHALAGAHAN NG GAWAING PANSIBIKO.pptx
KAHULUGAN AT KAHALAGAHAN NG GAWAING PANSIBIKO.pptxKAHULUGAN AT KAHALAGAHAN NG GAWAING PANSIBIKO.pptx
KAHULUGAN AT KAHALAGAHAN NG GAWAING PANSIBIKO.pptxjohnandrewcarlos
 
Referendum Party 2024 Election Manifesto
Referendum Party 2024 Election ManifestoReferendum Party 2024 Election Manifesto
Referendum Party 2024 Election ManifestoSABC News
 
Beyond Afrocentrism: Prerequisites for Somalia to lead African de-colonizatio...
Beyond Afrocentrism: Prerequisites for Somalia to lead African de-colonizatio...Beyond Afrocentrism: Prerequisites for Somalia to lead African de-colonizatio...
Beyond Afrocentrism: Prerequisites for Somalia to lead African de-colonizatio...Muhammad Shamsaddin Megalommatis
 
Dynamics of Destructive Polarisation in Mainstream and Social Media: The Case...
Dynamics of Destructive Polarisation in Mainstream and Social Media: The Case...Dynamics of Destructive Polarisation in Mainstream and Social Media: The Case...
Dynamics of Destructive Polarisation in Mainstream and Social Media: The Case...Axel Bruns
 
Defensa de JOH insiste que testimonio de analista de la DEA es falso y solici...
Defensa de JOH insiste que testimonio de analista de la DEA es falso y solici...Defensa de JOH insiste que testimonio de analista de la DEA es falso y solici...
Defensa de JOH insiste que testimonio de analista de la DEA es falso y solici...AlexisTorres963861
 
AI as Research Assistant: Upscaling Content Analysis to Identify Patterns of ...
AI as Research Assistant: Upscaling Content Analysis to Identify Patterns of ...AI as Research Assistant: Upscaling Content Analysis to Identify Patterns of ...
AI as Research Assistant: Upscaling Content Analysis to Identify Patterns of ...Axel Bruns
 
Different Frontiers of Social Media War in Indonesia Elections 2024
Different Frontiers of Social Media War in Indonesia Elections 2024Different Frontiers of Social Media War in Indonesia Elections 2024
Different Frontiers of Social Media War in Indonesia Elections 2024Ismail Fahmi
 
26042024_First India Newspaper Jaipur.pdf
26042024_First India Newspaper Jaipur.pdf26042024_First India Newspaper Jaipur.pdf
26042024_First India Newspaper Jaipur.pdfFIRST INDIA
 
Call Girls in Mira Road Mumbai ( Neha 09892124323 ) College Escorts Service i...
Call Girls in Mira Road Mumbai ( Neha 09892124323 ) College Escorts Service i...Call Girls in Mira Road Mumbai ( Neha 09892124323 ) College Escorts Service i...
Call Girls in Mira Road Mumbai ( Neha 09892124323 ) College Escorts Service i...Pooja Nehwal
 
HARNESSING AI FOR ENHANCED MEDIA ANALYSIS A CASE STUDY ON CHATGPT AT DRONE EM...
HARNESSING AI FOR ENHANCED MEDIA ANALYSIS A CASE STUDY ON CHATGPT AT DRONE EM...HARNESSING AI FOR ENHANCED MEDIA ANALYSIS A CASE STUDY ON CHATGPT AT DRONE EM...
HARNESSING AI FOR ENHANCED MEDIA ANALYSIS A CASE STUDY ON CHATGPT AT DRONE EM...Ismail Fahmi
 
₹5.5k {Cash Payment} Independent Greater Noida Call Girls In [Delhi INAYA] 🔝|...
₹5.5k {Cash Payment} Independent Greater Noida Call Girls In [Delhi INAYA] 🔝|...₹5.5k {Cash Payment} Independent Greater Noida Call Girls In [Delhi INAYA] 🔝|...
₹5.5k {Cash Payment} Independent Greater Noida Call Girls In [Delhi INAYA] 🔝|...Diya Sharma
 
Enjoy Night⚡Call Girls Iffco Chowk Gurgaon >༒8448380779 Escort Service
Enjoy Night⚡Call Girls Iffco Chowk Gurgaon >༒8448380779 Escort ServiceEnjoy Night⚡Call Girls Iffco Chowk Gurgaon >༒8448380779 Escort Service
Enjoy Night⚡Call Girls Iffco Chowk Gurgaon >༒8448380779 Escort ServiceDelhi Call girls
 
Kishan Reddy Report To People (2019-24).pdf
Kishan Reddy Report To People (2019-24).pdfKishan Reddy Report To People (2019-24).pdf
Kishan Reddy Report To People (2019-24).pdfKISHAN REDDY OFFICE
 
Nurturing Families, Empowering Lives: TDP's Vision for Family Welfare in Andh...
Nurturing Families, Empowering Lives: TDP's Vision for Family Welfare in Andh...Nurturing Families, Empowering Lives: TDP's Vision for Family Welfare in Andh...
Nurturing Families, Empowering Lives: TDP's Vision for Family Welfare in Andh...narsireddynannuri1
 
Roberts Rules Cheat Sheet for LD4 Precinct Commiteemen
Roberts Rules Cheat Sheet for LD4 Precinct CommiteemenRoberts Rules Cheat Sheet for LD4 Precinct Commiteemen
Roberts Rules Cheat Sheet for LD4 Precinct Commiteemenkfjstone13
 

Recently uploaded (20)

25042024_First India Newspaper Jaipur.pdf
25042024_First India Newspaper Jaipur.pdf25042024_First India Newspaper Jaipur.pdf
25042024_First India Newspaper Jaipur.pdf
 
2024 03 13 AZ GOP LD4 Gen Meeting Minutes_FINAL.docx
2024 03 13 AZ GOP LD4 Gen Meeting Minutes_FINAL.docx2024 03 13 AZ GOP LD4 Gen Meeting Minutes_FINAL.docx
2024 03 13 AZ GOP LD4 Gen Meeting Minutes_FINAL.docx
 
2024 02 15 AZ GOP LD4 Gen Meeting Minutes_FINAL_20240228.docx
2024 02 15 AZ GOP LD4 Gen Meeting Minutes_FINAL_20240228.docx2024 02 15 AZ GOP LD4 Gen Meeting Minutes_FINAL_20240228.docx
2024 02 15 AZ GOP LD4 Gen Meeting Minutes_FINAL_20240228.docx
 
Minto-Morley Reforms 1909 (constitution).pptx
Minto-Morley Reforms 1909 (constitution).pptxMinto-Morley Reforms 1909 (constitution).pptx
Minto-Morley Reforms 1909 (constitution).pptx
 
TDP As the Party of Hope For AP Youth Under N Chandrababu Naidu’s Leadership
TDP As the Party of Hope For AP Youth Under N Chandrababu Naidu’s LeadershipTDP As the Party of Hope For AP Youth Under N Chandrababu Naidu’s Leadership
TDP As the Party of Hope For AP Youth Under N Chandrababu Naidu’s Leadership
 
KAHULUGAN AT KAHALAGAHAN NG GAWAING PANSIBIKO.pptx
KAHULUGAN AT KAHALAGAHAN NG GAWAING PANSIBIKO.pptxKAHULUGAN AT KAHALAGAHAN NG GAWAING PANSIBIKO.pptx
KAHULUGAN AT KAHALAGAHAN NG GAWAING PANSIBIKO.pptx
 
Referendum Party 2024 Election Manifesto
Referendum Party 2024 Election ManifestoReferendum Party 2024 Election Manifesto
Referendum Party 2024 Election Manifesto
 
Beyond Afrocentrism: Prerequisites for Somalia to lead African de-colonizatio...
Beyond Afrocentrism: Prerequisites for Somalia to lead African de-colonizatio...Beyond Afrocentrism: Prerequisites for Somalia to lead African de-colonizatio...
Beyond Afrocentrism: Prerequisites for Somalia to lead African de-colonizatio...
 
Dynamics of Destructive Polarisation in Mainstream and Social Media: The Case...
Dynamics of Destructive Polarisation in Mainstream and Social Media: The Case...Dynamics of Destructive Polarisation in Mainstream and Social Media: The Case...
Dynamics of Destructive Polarisation in Mainstream and Social Media: The Case...
 
Defensa de JOH insiste que testimonio de analista de la DEA es falso y solici...
Defensa de JOH insiste que testimonio de analista de la DEA es falso y solici...Defensa de JOH insiste que testimonio de analista de la DEA es falso y solici...
Defensa de JOH insiste que testimonio de analista de la DEA es falso y solici...
 
AI as Research Assistant: Upscaling Content Analysis to Identify Patterns of ...
AI as Research Assistant: Upscaling Content Analysis to Identify Patterns of ...AI as Research Assistant: Upscaling Content Analysis to Identify Patterns of ...
AI as Research Assistant: Upscaling Content Analysis to Identify Patterns of ...
 
Different Frontiers of Social Media War in Indonesia Elections 2024
Different Frontiers of Social Media War in Indonesia Elections 2024Different Frontiers of Social Media War in Indonesia Elections 2024
Different Frontiers of Social Media War in Indonesia Elections 2024
 
26042024_First India Newspaper Jaipur.pdf
26042024_First India Newspaper Jaipur.pdf26042024_First India Newspaper Jaipur.pdf
26042024_First India Newspaper Jaipur.pdf
 
Call Girls in Mira Road Mumbai ( Neha 09892124323 ) College Escorts Service i...
Call Girls in Mira Road Mumbai ( Neha 09892124323 ) College Escorts Service i...Call Girls in Mira Road Mumbai ( Neha 09892124323 ) College Escorts Service i...
Call Girls in Mira Road Mumbai ( Neha 09892124323 ) College Escorts Service i...
 
HARNESSING AI FOR ENHANCED MEDIA ANALYSIS A CASE STUDY ON CHATGPT AT DRONE EM...
HARNESSING AI FOR ENHANCED MEDIA ANALYSIS A CASE STUDY ON CHATGPT AT DRONE EM...HARNESSING AI FOR ENHANCED MEDIA ANALYSIS A CASE STUDY ON CHATGPT AT DRONE EM...
HARNESSING AI FOR ENHANCED MEDIA ANALYSIS A CASE STUDY ON CHATGPT AT DRONE EM...
 
₹5.5k {Cash Payment} Independent Greater Noida Call Girls In [Delhi INAYA] 🔝|...
₹5.5k {Cash Payment} Independent Greater Noida Call Girls In [Delhi INAYA] 🔝|...₹5.5k {Cash Payment} Independent Greater Noida Call Girls In [Delhi INAYA] 🔝|...
₹5.5k {Cash Payment} Independent Greater Noida Call Girls In [Delhi INAYA] 🔝|...
 
Enjoy Night⚡Call Girls Iffco Chowk Gurgaon >༒8448380779 Escort Service
Enjoy Night⚡Call Girls Iffco Chowk Gurgaon >༒8448380779 Escort ServiceEnjoy Night⚡Call Girls Iffco Chowk Gurgaon >༒8448380779 Escort Service
Enjoy Night⚡Call Girls Iffco Chowk Gurgaon >༒8448380779 Escort Service
 
Kishan Reddy Report To People (2019-24).pdf
Kishan Reddy Report To People (2019-24).pdfKishan Reddy Report To People (2019-24).pdf
Kishan Reddy Report To People (2019-24).pdf
 
Nurturing Families, Empowering Lives: TDP's Vision for Family Welfare in Andh...
Nurturing Families, Empowering Lives: TDP's Vision for Family Welfare in Andh...Nurturing Families, Empowering Lives: TDP's Vision for Family Welfare in Andh...
Nurturing Families, Empowering Lives: TDP's Vision for Family Welfare in Andh...
 
Roberts Rules Cheat Sheet for LD4 Precinct Commiteemen
Roberts Rules Cheat Sheet for LD4 Precinct CommiteemenRoberts Rules Cheat Sheet for LD4 Precinct Commiteemen
Roberts Rules Cheat Sheet for LD4 Precinct Commiteemen
 

Cultural indicators 2014 (final)

  • 1.
  • 2. ii The Alabama Policy Institute (API) is an independent, non-profit research and education organization that is issue-centered and solution-oriented. We provide in-depth research and analysis of Alabama’s public policy issues to impact policy decisions and deepen Alabama citizens’ understanding of and appreciation for sound economic, social and governing principles. Since 1989, API has been on the front lines of critical public debates, helping Alabama citizens, lawmakers and business leaders better understand and apply principles that maximize individual freedom, limit government interference and encourage personal responsibility. The Alabama Policy Institute is the largest free-market, solution-based policy research center in Alabama. For additional copies, please contact: Alabama Policy Institute 402 Office Park Drive, Suite 300 Birmingham, AL 35223 P: 205.870.9900 info@alabamapolicy.org www.alabamapolicy.org Cultural Indicators 2014 www.alabamapolicy.org
  • 3. iii Cultural Indicators 2014 for Alabama and the U.S. by John R. Hill, Ph.D. Senior Research Analyst Copyright © 2014 by Alabama Policy Institute Birmingham, Alabama Permission to reprint in whole or in part is hereby granted, provided that the Alabama Policy Institute and the author are properly cited. Cultural Indicators 2014 www.alabamapolicy.org
  • 4. iv About the Author Dr. John Hill is the Senior Research Analyst at the Alabama Policy Institute. While on staff at API, he has authored more than thirty publications on education, energy, the state of the environment, family studies, gambling, and government growth. He is the primary author of three of API’s signature serial publications—Cultural Indicators for Alabama and the United States, Environmental Indicators, and How Business Friendly are Alabama’s 50 Largest Cities?. As president of American Indicators, a statistical consulting service, Dr. Hill has partnered with think tanks in eight other states to produce custom reports on policy issues and cultural trends. He is also an adjunct instructor at Faulkner University, where he teaches statistics, research methods, and interpersonal communication. Dr. Hill holds a Ph.D. in Mass Communication from the University of Alabama and a M.A. in Speech from the University of Memphis. Cultural Indicators 2014 www.alabamapolicy.org
  • 5. Contents Executive Summary..........................................................................................................................................1 Vital Statistics........................................................................................................................................................3 Crime.........................................................................................................................................................................11 Education................................................................................................................................................................18 Family........................................................................................................................................................................25 Health........................................................................................................................................................................35 Poverty & Welfare...............................................................................................................................................42 Business & Government.................................................................................................................................53 References..............................................................................................................................................................57 v Cultural Indicators 2014 www.alabamapolicy.org
  • 6. 1 Executive Summary The Alabama Policy Institute is pleased to present Cultural Indicators 2014 for Alabama and the United States. This study tracks various Alabama-specific and national measures of societal well-being dating back to 1960, as statistics are available. Chapters are devoted to vital statistics; crime; education; family; health; poverty and welfare; and business and government. Some highlights of the study include: Vital Statistics • Since 1960, Alabama’s population has increased 47% to 4.8 million in 2013, making it the 23rd largest state in the Union. During the same time, the population of the entire United States increased 76%. • In 2012, one of every ten births in Alabama was a low-weight birth. Alabama has the third highest percentage of low-weight births in the nation. • In 2011, Alabama had the tenth highest percentage of births to teenage mothers. • Alabama’s 2012 death rate was 26% higher than the national average. Heart disease and cancer are the two primary causes of death in both Alabama and the rest of the nation. • Since 1960, infant mortality rates in Alabama have fallen 72%, but the state still has the third highest rate in the nation. Crime • Over the past 52 years, Alabama’s crime rate has increased 208%. The state’s crime rate has averaged about 7% above the national average since 1999. • After peaking in 1991, Alabama’s overall crime rate has fallen 30%. During the same time, the state’s violent crime rate decreased 49%. • Since 2010, Alabama’s violent crime rate has averaged 10% above the national average. • One of every 148 Alabamians was in a state or federal prison in 2012, giving the state the third highest incarceration rate in the nation. • Since 1991, the inflation-adjusted cost per inmate in Alabama has increased by 24%. Education • Since 1960, the percentage of Alabamians age 25 and older with at least a high school diploma has doubled, and the percentage of adults with at least a four-year college degree has almost tripled. • Between 1970 and 2012, the percentage of blacks with at least a high school diploma has increased from 22% to 80%. • Despite these gain, Alabama ranks 46th in the nation in the percentage of adults age 25 and older with at least a high school diploma or its equivalent and 45th for adults holding at least a bachelor’s degree. • ACT scores in Alabama have been flat since 1990. Cultural Indicators 2014: Executive Summary www.alabamapolicy.org
  • 7. 2 • Alabama’s national test scores for both math and reading have ranked near the bottom for more than ten years. • From 1960 to 2014, inflation-adjusted, per-student spending on public education in Alabama has increased 182%, compared to 147% for the nation as a whole. Family • In 2012, Alabama had the seventh highest marriage rate and the ninth highest divorce rate in the nation. Both rates have been above the national average for more than 50 years. • Over the past 44 years, about 23,500 couples have divorced in Alabama each year, splitting the homes of about 19,100 children annually. • Since 1960, the percentage of births to unwed mothers in Alabama has increased from 11% to 43% in 2012. • For every 6.4 births in Alabama in 2011, there was one abortion. Health • Since 1970, the number of Medicaid recipients in Alabama has increased from 324,000 to almost 931,000. • From 1966 to 2012, enrollment in Medicare has risen from nine percent of the state’s population to almost 19%. • Alabama has the third highest rates of chlamydia and gonorrhea in the nation, and the 12th highest rate of HIV infection. Poverty and Welfare • In 2012, the typical Alabama household earned about $10,000 less than the national average. • Compared to households led by a single female, married-couple families are one-fourth as likely to be in poverty. • In 2013, about one of every five Alabamians received some support from food stamps. • The total cost of payments for Supplemental Security Income in Alabama in 2013 was $1.1 billion. • During the 2013 school year, almost 91 million free and reduced-cost meals were served to Alabama students. Business and Government • Since 1975, the number of state and local government employees has increased by 67% and 77%, respectively. • About one of every 17 Alabamians is either a state or local government employee. • Since 1992, Alabama’s inflation-adjusted total state and local expenditures have increased 78%. Cultural Indicators 2014: Executive Summary www.alabamapolicy.org
  • 8. Chapter 1 VITAL STATISTICS
  • 9. 4 Population From 1960 to 2013, Alabama’s population increased 47%, from 3,267,000 to 4,833,7221 making it the 23rd largest state in the Union.2 At the same time, the population of the entire United States increased 76%, from 179.3 million to 316 million.3 In 2012, the largest age group in Alabama was 50-59 years old (14% of the population), followed by those 20-29 years old (13.8%), the 10-19 age group (13.2%) and those between 40-49 years of age (13.1%).4 In 2013, Alabama’s population composition was about 69% white (3.2 million), 28% black (1.3 million), and 2% Asian (74,000). Hispanics of any race comprised 4% (193,000) of the states’ population.5 After accounting for births and deaths, approximately one-third of the population growth in Alabama from 2010 to 2013 was the result of international migration.6 As of 2010, Alabama’s population density of 94 persons per square mile is 8% greater than the national average (87.4 persons per square mile).7 Cultural Indicators 2014: Vital Statistics www.alabamapolicy.org
  • 10. 5 Birth Rates Since 1960, Alabama’s birth rate has fallen from 24.7 per 1,000 persons in 1960 to 12.1 per 1,000 in 2012, a drop of 51%. Nationally, the birth rate fell from 23.7 per 1,000 persons in 1960 to 12.6 in 2012, a decline of 46%.8 In 2012, there were 58,381 live births in Alabama. Sixty-six percent of these were to white mothers (38,637), while 34% (19,744) were to blacks and other races. The resident birth rate for whites was 11.5 births per 1,000 population and 13.6 births per 1,000 population for blacks and other races.9 In 2012, approximately 10% of all births in Alabama were low-weight births (birth weights of less than 2,500 grams / 5 pounds, 8 ounces), up slightly from 9.7% in 2000. In 2012, Alabama had the third highest ranking in low-weight births in the nation.10 30 25 20 BIRTH RATE PER 1,000 PERSONS 15 10 5 0 1960 1965 1970 1975 1980 1985 1990 1995 2000 2005 2010 2015 Alabama United States Cultural Indicators 2014: Vital Statistics www.alabamapolicy.org
  • 11. 6 Death Rates 16 14 12 10 8 6 4 2 0 1960 1965 1970 1975 1980 1985 1990 1995 2000 2005 2010 2015 DEATHSP ER 1,000 POPULATION Alabama U.S. Alabama: Age-Adjusted U.S.: Age-Adjusted In 2012, there were 49,212 deaths in Alabama, for an average death rate of 10.2 persons per 100,000 population. Since 1960, Alabama’s death rate has increased 10%. From 1960 to 2011, the national death rate has fallen 15%, from 9.5 to 8.1 persons per 1,000 population.11 Heart disease is the primary cause of death in both Alabama and the nation as a whole. In 2011—the most recent year in which detailed information is available—Alabama’s death rate from heart disease was 3.2 per 1,000 population, about 28% higher than the national average (2.5). The second leading cause of death in Alabama and the United States is cancer. In 2011, Alabama’s death rate from cancer was 2.1 per 1,000 population, which was 10% higher than the national average (1.9). Cultural Indicators 2014: Vital Statistics www.alabamapolicy.org
  • 12. 7 Age-adjusting a rate is a way to make fairer comparisons between groups with different age distributions. For example, a county having a higher percentage of elderly people may have a higher rate of death or hospitalization than a county with a younger population, merely because the elderly are more likely to die or be hospitalized. The same distortion can happen when comparisons are made between races, genders, or time periods. Age adjustment can make the different groups more comparable.12 When the death rates for Alabama and the nation as a whole are age-adjusted, Alabama’s death rate in 2011 dropped to 9.3 per 1,000 population, while the national rate dropped to 7.4.13 In 2011, the death rate for whites in Alabama was 26% higher than that of blacks (10.9 versus 8.7, respectively). However, when age-adjusted death rates are compared, blacks died at a higher rate (10.3) than whites (9.1).14 Cultural Indicators 2014: Vital Statistics www.alabamapolicy.org
  • 13. 8 Infant Mortality Since 1960, infant mortality rates in Alabama have fallen 72%. In 1960, 32 of every 1,000 babies born in Alabama died within the first year of their life. By 2012, that number had dropped to only 8.9 of every 1,000 babies. Despite this progress, Alabama’s infant mortality rate remains above the national average. For 2011, Alabama (8.9 deaths per 1,000 live births) had the third highest infant mortality rate in the nation. Compared to neighboring states, Alabama had higher mortality than all of them, except Mississippi (9.38).15 Cultural Indicators 2014: Vital Statistics www.alabamapolicy.org
  • 14. 9 The infant death rate in Alabama in 2012 for blacks and other races (13.5 per 1,000 live births) is more than double that of whites (6.5). Even though there were almost twice as many births to white women in Alabama (38,637) than to non-white women (19,744), there were slightly more infant deaths among black and other non-white women (253) than whites (266).16 In 2012, the top four leading causes of infant deaths in Alabama were: perinatal period conditions (241); congenital malformations (97); Sudden Infant Death Syndrome or SIDS (39), and accidents (25). These causes accounted for about 77% of 519 infant deaths.17 Sixty-four percent of these deaths occurred within the first 27 days after birth, and 33% occurred within the first 24 hours after birth.18 Cultural Indicators 2014: Vital Statistics www.alabamapolicy.org
  • 15. 10 Teen Births In 2012, 6,236 children were born to teenage mothers in Alabama. Since 1960, more than 631,000 children in Alabama have been born into similar households.19 In 2011—the most recent year state comparisons are available—Alabama ranked tenth among the states regarding the birth rates of teenage mothers.20 In 2012, about 10.7% of all births in Alabama were to teenage mothers, compared to about 7.8% nationwide.21 In 1960, only about 24% of teenage mothers in Alabama were unmarried, compared with 83% in 2012. Among whites, the percentage of births to unmarried teens has increased sixteen-fold from 4.6% in 1960 to 74% in 2012. The percentage of births to non-white, teenage, unmarried women has risen from 50% in 1960 to 96% in 2012.22 Among Alabama teenagers, pregnancy rates in 2012 were highest among 18- and 19-year-olds, with one in ten becoming pregnant in 2012.23 Within this group, 71% gave birth, 16% had a fetal loss, and 13% opted for an abortion.24 Cultural Indicators 2014: Vital Statistics www.alabamapolicy.org
  • 17. 12 Crime Rates Since 1960, Alabama’s crime rate, which takes into account population changes, increased 208%, from 1,222 crimes per 100,000 residents to 3,598 in 2012. In 2012, Alabama reported 173,916 Type I crimes—murder, rape, robbery, aggravated assault, burglary, larceny, and motor vehicle theft.25 This is down from the 1991 peak of 209,800 crimes, but about 38% more than in 1975 (125,488).26 From 1960 to 1999, Alabama’s crime rate remained below the national average. Since 1999, the state’s crime rate has averaged about 7% above the national average.27 In 2012, there were almost 10.2 million crimes reported in the United States. This is down from the 1991 peak, when there were almost 14.9 million crimes. In 2012, Alabama’s share of all crimes in the United States (1.7%) was slightly higher than its representative population (1.5%).28 Cultural Indicators 2014: Crime www.alabamapolicy.org
  • 18. 13 Violent Crime There were 20,222 violent crimes—murder, rape, robbery, and aggravated assault—reported in Alabama in 2012. This is down 49% from the peak of 33,888 in 1992, but it is 124% higher than in 1960.29 In 2013, Alabama’s violent crime rate was 432.7 crimes per 100,000 population, down 3% from 2012. Between 1994 and 2010, Alabama’s violent crime rate was, on average, about 8% lower than national average. Since then, it has averaged 10% above the national average.30 In 2012, about 12% of all the crimes committed in Alabama were of a violent nature, the same as the nation as a whole. Compared to neighboring states, the percentage of violent crimes in Alabama was higher than Georgia (10%) and Mississippi (8%), but lower than Florida (13%) and Tennessee (16%).31 Since 1960, the national violent crime rate jumped 371% to its peak in 1992, before descending 49% to its 2012 level of 386.9 violent crimes per 100,000 population.32 Cultural Indicators 2014: Crime www.alabamapolicy.org
  • 19. 14 Prison Population In 2012, one of every 148 persons (0.7%) of Alabama’s population was in a state or federal prison serving a sentence of at least one year, compared to one in every 200 (0.5%) of the national population. Alabama’s incarceration rate—the number of sentenced prisoners per 100,000 populations—is the third highest in the nation.33 Of the 31,437 prisoners in Alabama as of December 31, 2012, 92% (28,915) were male. Since 2000, the number of female prisoners has increased from 1,783 from to 2,522.34 One percent of all prisoners were under the age of 18.35 Since 1980, the sentenced adult prison populations of Alabama and the nation as a whole both increased by 380%. In 1980, Alabama had 6,543 inmates; at the end of fiscal year 2012 it had 32,574. Nationwide, the number of prisoners increased from 316,000 to 1.57 million.36 800 700 600 500 400 300 200 100 - 1980 1985 1990 1995 2000 2005 2010 2015 PRISONERS PER 100,000 POPULATION US Alabama Cultural Indicators 2014: Crime www.alabamapolicy.org
  • 20. 15 According to the Alabama Department of Corrections, of the sentenced prisoners in 2012, 23% were incarcerated for drug offenses, 21% for burglary or theft, and 14% each for murder and robbery.37 The percentage of inmates serving time for violent offenses in Alabama’s correctional system has increased from 39% (10,182 prisoners) in 2000 to 47% (15,212) in 2012.38 In 2012, 28% of the inmates in Alabama’s prisons (9,124) were held under the Habitual Offender Act. This percentage has remained relatively flat since 1991.39 Cultural Indicators 2014: Crime www.alabamapolicy.org
  • 21. 16 Cost of Imprisonment In 2012, Alabama taxpayers spent an inflation-adjusted $15,527 for each of the inmates in the state’s prison system. This is about 4% less than the $16,117 spent per inmate in 2011. Since 1991, Alabama’s cost per inmate has risen 19% after rising and falling several times.40 In fiscal 2012, expenditures for corrections totaled $437.3 million, down $7.5 million from 2011. Of this amount, 54% ($238 million) was for personnel costs and employee benefits, 27% ($118 million) was for medical and professional services, 8% ($33 million) was for supplies and operating expenses, and 4% ($16 million) was for utilities and communications. Only 3% ($13 million) was spent on repairs, maintenance, or capital outlays.41 For fiscal year 2014, corrections expenditures constitute $425 million, or 24% of the entire General Fund budget. Only Medicaid ($615 million) has a larger share of the budget..42 Cultural Indicators 2014: Crime www.alabamapolicy.org
  • 22. 17 Child Abuse Since 1990, the rate of substantiated cases of child abuse in Alabama has declined by 43% and by 32% nationally.43 In 2012, there were 20,599 reports of child abuse in Alabama involving 30,400 children. Not every report of child abuse or neglect is authentic; each report must be investigated to determine whether enough evidence exists to conclude that maltreatment occurred.44 Of the child abuse cases reported in 2012, 9,573 were identified as actual victims—about one in three. Specifically, about one in every 37 children in Alabama was the subject of a child abuse investigation, but only one in 117 was actually substantiated as a victim.45 By comparison, about one in every 19 children nationwide was the subject of an investigation, and one in every 109 was actually substantiated as a victim.46 In 2012, 59% of Alabama child abuse victims were white, 29% were black, and 4% were Hispanic.47 By comparison, Alabama’s total youth population in 2012 (1,124,000) was 59% white, 30% black, and 4% Hispanic.48 25 20 15 10 5 0 1990 1992 1994 1996 1998 2000 2002 2004 2006 2008 2010 2012 VICTIM RATE PER 1,000 CHILDREN Alabama U.S. Average Cultural Indicators 2014: Crime www.alabamapolicy.org
  • 24. 19 Academic Achievement Since 1970, the percentage of Alabama residents age 25 and older with a high school diploma has doubled (103% gain), while the percentage of adults with at least a four-year college degree has almost tripled (196%). By comparison, the percentage of adults nationwide with at least a high school diploma or a college degree has risen 56% and 172%, respectively.49 In Alabama, academic gains have been greatest among blacks. Between 1970 and 2012, the percentage of blacks with at least a high school diploma increased from 22% to 80%, a gain of 263%. By comparison, the percentage of whites with at least a high school diploma rose by 83%, from 47% to 86%.50 In 2012, Alabama ranked 46th in the nation in the percentage of adults age 25 and older with at least a high school diploma or its equivalent51 and 45th for adults holding at least a bachelor’s degree.52 The more diplomas an adult holds, the greater their earning potential. According to data collected in 2012 by the U.S. Census Bureau, possessing a high school diploma raises personal income for Alabama residents by almost $7,000 ($25,485) and a bachelor’s degree by almost $26,500 ($45,124).53 Cultural Indicators 2014: Education www.alabamapolicy.org
  • 25. 20 ACT Scores In 2013, 79% (38,122) of all graduating high school seniors in Alabama took the ACT. Of these, the average composite score was 20.4, the 36th highest in the nation.54 Of the 26 states in which most students took the ACT in 2013, Alabama was in 15th place.55 Seventy-nine percent (30,233) of Alabama high school students taking the ACT in 2013 were core course completers—that is, they had taken at least four years of English and three years of math (algebra and higher), social sciences, and natural sciences. Of these, their composite average was 21, compared to a national average of 21.7 for core course completers and 18.2 for Alabama students who were not core course completers.56 Since 1990, Alabama students’ scores on the Enhanced ACT have been stagnant, with students typically scoring about 0.8 of a point below the national average.57 Cultural Indicators 2014: Education www.alabamapolicy.org
  • 26. 21 Male test takers in Alabama in 2013 had higher average composite (20.6), math (20.0), and science (20.7) scores than females (20.3, 19.1, and 19.7, respectively). In the categories of English and reading, females scored better (20.7 and 21.0) than males (20.3 and 20.9).58 Ethnicity is a significant predictor of ACT scores in Alabama. For reading, Asian students had the highest average score (23.5), followed by whites (22.4) and native Hawaiians or other Pacific Islanders (21.2). By comparison, blacks scored lowest (17.5), followed by Hispanics (20.1) and Native Americans (20.6). A similar relationship was found for math: Asians scored highest (25.0), followed by whites (21.9) and native Hawaiians or other Pacific Islanders (20.1). Again, blacks’ scores were the lowest (17.2), followed by Native Americans (18.2) and Hispanics (18.3).59 Cultural Indicators 2014: Education www.alabamapolicy.org
  • 27. 22 NAEP Scores The National Assessment of Education Progress (NAEP) was mandated by Congress in 1969 to monitor the knowledge, skills, and performance of the nation’s school children. One form of monitoring has been national, standardized tests in mathematics, science, reading, geography, and other subjects. In 2013, every state and the District of Columbia participated in the mathematics and reading exams.60 NAEP uses a scale of 0 to 500 for its mathematics and reading tests. In 2013, Alabama’s 4th grade math students ranked 46th in the nation with an average score of 233, eight points below the national average.61 Twenty-nine percent of Alabama’s 4th graders scored at or above proficiency, 13 points below the national average.62 Cultural Indicators 2014: Education www.alabamapolicy.org
  • 28. 23 In the same year, Alabama’s 8th grade math students ranked 50th in the nation with an average NAEP score of 269, with 19% at or above proficiency. By comparison, the national average was 284, with 34% at or above proficiency.63 In 2013, Alabama’s 4th grade students ranked 35th in the nation in reading with an average score of 219, two points lower than the national average. Thirty percent of Alabama’s students scored at or above proficiency, compared to 34% of students nationwide.64 During the same year, Alabama’s 8th grade students ranked 47th in the nation in reading with an average score of 257, nine points below the national average. Twenty-five percent of Alabama’s students scored at or above proficiency, compared to 35% of students nationwide.65 Cultural Indicators 2014: Education www.alabamapolicy.org
  • 29. 24 K-12 Spending Per Pupil In the 2013-14 school year, public schools in Alabama spent an average of $8,841 per student. This is a 2% decrease from the inflation-adjusted amount spent in 2012-2013 ($8,998). By comparison, national spending per student increased 2% from $11,170 to $11,373. 66 Despite occasional proration and income shortfalls, Alabama’s public elementary and secondary schools have received a large increase in revenue in the past 50 years. Since 1970, inflation-adjusted spending per student in Alabama has increased 182%, compared to 147% for the nation as a whole.67 In the 1969-70 school year, Alabama’s per-student outlays for K-12 public education ($3,139 in inflation-adjusted dollars) were 31% less than the national average ($4,605). By the 2013-14 school year, this gap had narrowed to 22%.68 In the 2010-11 school year, 37.8% of funding for all public education in Alabama came from state and local government expenditures. By comparison, the national average was 33.3%.69 $14,000 $12,000 $10,000 $8,000 $6,000 $4,000 $2,000 $- 1970 1975 1980 1985 1990 1995 2000 2005 2010 2015 Alabama U.S. Cultural Indicators 2014: Education www.alabamapolicy.org
  • 31. 26 Marriage In 1960, married couples made up about 75% of all households in the United States. By 2010, that number had fallen to 49.7%.70 In 2012, there were 38,489 marriages in Alabama, a 5% decline from 40,523 marriages in 2011. This translates to a marriage rate of 8.0 marriages per 1,000 population.71 Between 1960 and 2012, Alabama’s highest marriage rate of 14.1 marriages per 1,000 population was achieved in 1972. Since then, the state’s marriage rate has fallen by 43%.72 In 2009—the most recent year for which national figures are available—Alabama’s marriage rate was 23% higher than the national average of 6.8 marriages per 1,000 population. Alabama’s marriage was the 7th highest in the nation,73 and the state’s marriage rate has been above the national average since before 1960. 16 14 12 10 8 6 4 2 0 1960 1965 1970 1975 1980 1985 1990 1995 2000 2005 2010 2015 MARRIAGE RATE PER 1,000 POPULATION U.S. Alabama Cultural Indicators 2014: Family www.alabamapolicy.org
  • 32. 27 Divorce In 2012, Alabama had 17,193 divorces, for a divorce rate of 3.6 per 1,000 population. This is down about 16% from 2011, when there were 20,550 divorces in the state.74 In 2011—the most recent year national figures are available—the state’s divorce rate (4.3 in 2011) was 19% above the national average of 3.6. Alabama’s divorce rate has been above the national average for more than 50 years.75 In 2009—the most recent year comparable state figures are available—Alabama had the ninth highest divorce rate in the nation. Alabama’s divorce rate was also higher than at least three neighboring states that reported divorce rates: Florida (4.3); Mississippi (4.1); and Tennessee (4.1) (Georgia does not publish its annual divorce rates).76 Between 1960 and 1966, Alabama’s divorce rate fell from 5.3 per 1,000 population to a low of 3.2 in 1966 before rising to a record high of 6.9 in both 1979 and 1980.77 In 2012, the median length of marriage before divorce in Alabama was between five and nine years. Ninety-eight percent of these divorces were on the grounds of either “incompatibility” or “irretrievable breakdown” also known as “no-fault divorce.” 78 8 7 6 5 4 3 2 1 0 1960 1965 1970 1975 1980 1985 1990 1995 2000 2005 2010 2015 DIVORCE RATE PER 1,000 POPULATION U.S. Alabama Cultural Indicators 2014: Family www.alabamapolicy.org
  • 33. 28 Children Affected by Divorce Perhaps the greatest tragedy of divorce is its effect on the children involved. For the past 44 years, about 23,500 couples have divorced in Alabama each year, splitting the homes of about 19,100 children annually.79 Even if none of these divorces involved a subsequent divorce (or more than one) for one of the parents, almost 825,000 children in Alabama have been directly affected by divorce since 1970.80 The number of children affected by divorce in Alabama closely mirrors the state’s divorce rate. During the initial surge in divorces following the legalization of no-fault divorce in Alabama in 1971, the number of children affected grew at a rate of about 400 per year until reaching a historic peak in the late 1970s. Since then, it has fallen by about 160 per year. 30,000 25,000 20,000 15,000 10,000 5,000 - 1970 1975 1980 1985 1990 1995 2000 2005 2010 2015 Cultural Indicators 2014: Family www.alabamapolicy.org
  • 34. 29 Index of Belonging & Rejection In February 2014, Patrick Fagan of the Family Research Council published the fourth annual Index of Family Belonging and Rejection to measure the social health of American children. “Belonging” was defined as the percentage of children ages 15-17 who had grown up “with both their birth mother and their biological father legally married to one another since before or around the time of the teenager’s birth,” and “rejection” as the percentage of children in households where at least one of their biological parents was no longer in the home. Of the 13.1 million teens in the United States at the time of the study (2008-2011), more than 7 million—54% —had spent their childhood without at least one of their biological parents in an intact family.81 Despite having a reputation for strong families, the southeastern United States— including Alabama—fared poorly: its score of 38% means that 62% of teens in Alabama (119,000 of 192,000) had not grown up with both biological parents.82 Cultural Indicators 2014: Family www.alabamapolicy.org
  • 35. 30 Nevertheless, three other southern states and the District of Columbia (17%) scored the same or lower than Alabama.83 The most recent version of the Index also includes race-specific measures of belonging. Intact biological families among whites were less common in Alabama (48%) than the nation as a whole (54%), while the state’s Hispanic population was better off (49%) than the national average (41%). The percentage of intact biological families in Alabama’s black population was about the same as the national average (17%).84 Cultural Indicators 2014: Family www.alabamapolicy.org
  • 36. 31 Births to Unwed Mothers Since 1960, the number of births in Alabama that were out of wedlock jumped 272%, from 11% to 43% in 2012.85 Nationwide, the percentage of out-of-wedlock births has increased 673%, from 5% to 41%.86 Over the past 50 years, 863,000 children in Alabama and more than 48 million children nationwide have been born to an unmarried mother.88 In 1960, 2% of births to white mothers in Alabama were out of wedlock. That number rose to 28% in 2012, an eleven-fold increase (1,171%).89 By comparison, the percentage of births to unwed, non-white women has leveled out after growing for more than 30 years. In 2012, 71% of all children born in Alabama to non-white mothers were born out of wedlock, compared to 28% in 1660, a 153% increase.90 While the problem of unwed parents is usually discussed as it pertains to teenagers, adult out-of- wedlock births in Alabama are increasing at a faster rate than teens. Since 2000, the percentage of out-of-wedlock births to mothers ages 15-19 has increased from 71% of all births to 83% in 2012. By comparison, the percentages of out-of-wedlock births to mothers between the ages of 20-24 has increased from 45% in 2000 to 60% in 2012; and the percentage for women ages 25-29 increased from 12% in 2000 to 22% in 2012.91 Cultural Indicators 2014: Family www.alabamapolicy.org
  • 37. 32 Abortion Rates Half of the pregnancies among American women are unintended, and about four in 10 of these are terminated by abortion. From 1973 to 2011, nearly 53 million legal abortions were performed in America. Forty-five percent of all abortions since 1973 have been for women who were not married at the time of the procedure.92 According to Alabama’s Department of Public Health, there were 9,076 abortions performed in the state in 2012, or about one abortion for every 6.4 births. Fourteen percent of all abortions in Alabama were performed on teenagers.93 In 2011—the most recent year for which national figures are available—Alabama ranked 33rd in the nation in abortions. The state’s abortion rate (10 abortions per 1,000 women ages 15-44) was lower than the rates of Florida (23.7), Georgia (16.8), and Tennessee (13.1), but higher than that of Mississippi (3.7).94 Cultural Indicators 2014: Family www.alabamapolicy.org
  • 38. 33 Nationally, an estimated 1.06 million abortions were performed in 2011, according to the Guttmacher Institute, a New York-based organization that gathers voluntary reports from abortion providers. The numbers of abortions performed in Alabama from 1986 to 1991 are estimates because it was not until 1992 that the state law required full reporting from the providers of abortion services.95 More than 533,000 abortions have been performed in the state since the Roe v. Wade decision in 1973.96 This number is equal to almost half the population of the Birmingham-Hoover Metropolitan Statistical Area (1,140,300 in 2013).97 Cultural Indicators 2014: Family www.alabamapolicy.org
  • 39. 34 Single-Parent Families In 2012, 36% of all Alabama families with children under the age of 18 were single-parent homes, compared to about 33% nationwide.98 Since 1980, the percentage of families headed by a single parent in Alabama and the nation as a whole has increased by 88% and 70%, respectively.99 National data from the 1960 census shows the extent to which family composition has changed: 91% of all families with children were married couples, 8% were single-parent, female-headed households, and 1% were male-headed, single-parent households. By 2012, only 67% of American families with children were married couples, 25% were headed by a single, female parent, and 8% were single-parent, male-headed households.100 40% 35% 30% 25% 20% 15% 10% 5% 0% 1980 1985 1990 1995 2000 2005 2010 2015 Alabama U.S. Cultural Indicators 2014: Family www.alabamapolicy.org
  • 41. 36 Medicaid Begun in 1970, Medicaid pays for medical care and nursing home care for the poor. Since 1980, inflation-adjusted Medicaid spending in Alabama has increased 481% from $759 million to $4.4 billion in 2010. At the same time, the number of Medicaid recipients increased 187%, from 324,000 to almost 931,000.101 Much of the growth in Medicaid has been in the last 10 years. From 2000 to 2010, the number of recipients increased 50% in Alabama and 53% nationwide. At the same time, inflation-adjusted spending on Medicaid increased 34% in Alabama and 59% for the rest of the nation.102 In 2010, approximately 65.5 million Americans received some level of Medicaid assistance, the total, inflation-adjusted cost of which was approximately $369.6 billion. Of this amount, $49 billion was spent on nursing home care, $38 billion was spent on inpatient hospital expenses, and $26 billion was spent on prescription drugs.103 Cultural Indicators 2014: Health www.alabamapolicy.org
  • 42. 37 Medicare Medicare was established in 1965 as a means of establishing a health insurance program for aged persons to complement the retirement, survivors, and disability insurance benefits under Title II of the Social Security Act. When it was implemented in 1966, Medicare covered most persons aged 65 or older. Since then, it has expanded to include persons entitled to Social Security or Railroad Retirement disability cash benefits, most persons with end-stage renal disease, and those with Lou Gehrig’s disease.104 Since 1966, enrollment in Medicare in Alabama has risen from 9% of the state’s population (285,000) to almost 19% (896,000) in 2012, an increase of 118%.105 Nationally, enrollment has risen from 10% to 16%, an increase of 67%.106 In 1999, the Social Security Administration changed the way in which it reported data on recipients of its medical care programs, making some comparisons between earlier and later data impossible. Nevertheless, national data show that Medicare payments have rapidly increased. Since 1967, the national amount of Medicare payments has risen from an inflation-adjusted $30 billion in 1967 to almost $358 billion in 2012, a more than ten-fold increase (1,085%).107 Cultural Indicators 2014: Health www.alabamapolicy.org
  • 43. 38 Sexually Transmitted Diseases In women, chlamydial infections, which usually have no symptoms, may result in damage to a woman’s reproductive organs, including pelvic inflammatory disease (PID)—a major cause of infertility—ectopic pregnancy, and chronic pelvic pain.108 Since 1990, Alabama’s chlamydia infection rate has increased from almost none to 638 per 100,000 population in 2012, while the national rate has increased 185%, from 160 per 100,000 population to 457.109 One of the reasons for these large increases appears to be because of improvements in screening techniques.110 In 2012, Alabama had the third highest rate of reported cases of chlamydia in the nation.111 While chlamydia has become the new leader in sexually transmitted diseases in both Alabama and the United States, gonorrhea and syphilis are on the decline. As with chlamydia, gonorrhea and syphilis produce PID, abdominal pain, and ectopic pregnancies.112 Cultural Indicators 2014: Health www.alabamapolicy.org
  • 44. 39 Since 1984, the gonorrhea infection rate in Alabama and the United States has decreased by 58% and 71%, respectively.113 In 2012, Alabama had the third highest rate of reported cases of gonorrhea in the nation (193 per 100,000 population).114 Syphilis is a bacterial infection that is particularly dangerous to unborn children. If untreated, many children of mothers with syphilis are stillborn or die shortly after birth.115 The reported rate of cases of syphilis has fallen by 58% in Alabama and by 46% nationwide since 1984. In 2012, Alabama had the 14th highest rate of reported cases of syphilis in the nation (14.7 per 100,000 population).116 Cultural Indicators 2014: Health www.alabamapolicy.org
  • 45. 40 HIV/AIDS Human Immunodeficiency Virus infection (HIV) is a disease of the immune system. While the disease can be managed through antiretroviral therapy, which can help patients achieve near-normal life expectancies, there is no cure for HIV. If left untreated, about half of all persons with HIV eventually develop Acquired Immune Deficiency Syndrome (AIDS) within 10 years of infection. In 2011, there were 49,273 diagnoses of HIV infection in the 50 states and the District of Columbia. Of these, 843 were reported in Alabama.118 The rate of HIV infection in 2011 was 17.6 diagnoses per 100,000 population nationally and 17.6 in Alabama, giving the state the 12th highest infection rate in the nation. Since 1996, the HIV infection rate has increased 247% nationwide and only 58% in Alabama.119 Cultural Indicators 2014: Health www.alabamapolicy.org
  • 46. 41 In 2011, the most common age for new diagnoses of AIDS was 20-24 years old (36.4 per 100,000 population), followed by 25-29 year olds (35.2).120 At the end of 2010, there were 870,096 persons living with HIV in the United States. Of these, 11,539 lived in Alabama. Nationwide, the plurality of those living with HIV are black (43%), followed by whites (34%) and Hispanics (19%).121 Among males, most came into contact with HIV via male-to-male sexual contact (78%), injection drug use (6%), or both (4%). For females, the primary sources of contact were heterosexual contact (86%) and injection drug use (14%).122 The reason for the increase in AIDS rates in 1993 is because the Centers for Disease Control and Prevention (CDC) revised its AIDS surveillance case definition to include adolescents and adults with low CD4 (T-cell) counts, but no manifestation of any signs of illness.123 Cultural Indicators 2014: Health www.alabamapolicy.org
  • 47. Chapter 6 Poverty & Welfare
  • 48. 43 Median Household Income Since 1970, the inflation-adjusted, median household income for Alabama residents has actually decreased 22%, while the national median has decreased 16%. In 2012, the typical Alabama household earned an inflation-adjusted $43,078, while the typical American household earned $53,229.124 In both Alabama and the nation as a whole, improvements in earnings were greatest among married-couple families. In 2012, the average married-couple family in Alabama earned $69,052, 39% more than in 1970. By comparison, American married-couple families nationwide earned an average of $78,786, about 13% more than in 1970 (after adjusting for inflation).125 Cultural Indicators 2014: Poverty & Welfare www.alabamapolicy.org
  • 49. 44 In general, the gap between Alabama’s median household income and that of the nation as a whole has widened since 1970, from an inflation-adjusted 15% in 1970 ($8,314) to almost 24% ($10,151) in 2012. Married-couple families in Alabama, however, have narrowed the gap from 41% (a gap of $20,222 in 1970) to 14% in 2012 ($9,734). Male-headed households in Alabama have had similar success, reducing the gap from 42% in 1989—the first year state-specific data is available—to 15% in 2012.126 On the other hand, female-headed households in both Alabama and the rest of the nation have become poorer over the past four decades. After adjusting for inflation, female-headed households in Alabama saw their earnings drop by 13% between 1970 and 2012, from $28,600 to $25,067. Nationwide, median female-headed household income fell 6%, from $33,692 to $31,589.127 Cultural Indicators 2014: Poverty & Welfare www.alabamapolicy.org
  • 50. 45 Adequate Housing Every two years, the U.S. Census Bureau conducts a survey of housing units across the country and in selected metropolitan areas. According to the most recent national survey of housing in 2011, almost 96% of homes have a fully equipped kitchen (including a sink, refrigerator, and oven or burner), 93% have at least one working smoke detector, 42% have at least one working carbon monoxide detector, and 90% have a furnace, hot water or steam system, or built-in electric heat pump or heater.128 Another way to measure the adequacy of housing is by rating the quality and safety of their surroundings. In 2009, more than 80% of all homes in the United States were not near vandalized buildings (87%), free of trash or junk on the streets (89%), or not near buildings with bars on their windows (83%). On the other hand, almost 40% noted that the streets near their home were in need of at least minor repairs.129 Cultural Indicators 2014: Poverty & Welfare www.alabamapolicy.org
  • 51. 46 Families in Poverty The U.S. Census Bureau updates its estimates of poverty annually using the Consumer Price Index (CPI-U). The Bureau’s definition of poverty counts money income before taxes and does not include capital gains and non-cash benefits, such as public housing, Medicaid, and food stamps.130 In 2012, about one in every 5.3 American households with children was in poverty. Since 1960, the percentage of families with children in poverty has fallen by 5% nationwide. 131 Since 1974—the first year detailed figures are available for married couples and male-headed households—the percentage of all families in poverty has risen by 55%, from 12% to about 19% in 2012. For married couples, the increase was large (43%), but less severe than the national average (55%). Married couples have the lowest percentage of poverty of all household types, making their jump from an already-low 6% in 1974 to almost 9% in 2012 appear larger than it actually is.132 Male-Headed Households FMeamlea-lHe-eHaedaedde Hd oHuosuesheohldoslds Cultural Indicators 2014: Poverty & Welfare www.alabamapolicy.org
  • 52. 47 Male-headed households had a 58% increase in poverty from 1974 to 2012. While male-headed homes tend to earn more than those headed by a female, both single-parent household types are more susceptible to the risk of going from one income to no income than in homes where there are or could be dual earners.133 The percentage of households headed by a single female declined by a fraction of a point (-0.2%). Female-headed households have traditionally been the most likely to be in poverty, with an average poverty rate of 42% since 1974. Moreover, female-headed households had a poverty rate nine percentage points lower (33%) as recently as 2000 before returning to its steady climb.134 Cultural Indicators 2014: Poverty & Welfare www.alabamapolicy.org
  • 53. 48 AFDC/TANF Recipients Aid to Families with Dependent Children (AFDC) was a cash assistance program primarily intended for women with children in their household. In most circumstances, if recipients married, they would lose their benefits. Created in 1935 and originally called Aid to Dependent Children, this program was originally created under the New Deal to assist widows (or wives of disabled men) and their children. It was a federal-state program, in which the Federal government generally paid about 80% of the cost for state recipients.135 With the advent of the Welfare Reform Act in 1996, AFDC was replaced with TANF (Temporary Assistance to Needy Families), which gives states the flexibility to structure the program as they see fit.136 After peaking in 1980, the total number of individual recipients and children receiving benefits in Alabama dropped 74% and 73%, respectively.137 Nationally, there were about 3.8 million TANF recipients in 2013. This is 73% lower than the 14.2 million individuals on AFDC in 1993.138 Prior to 1993, the number of families receiving AFDC was not published on a state-to-state level. Since then, the number of families, individual recipients, and children on TANF in Alabama has dropped by 63%, 67%, and 65%, respectively.139 Cultural Indicators 2014: Poverty & Welfare www.alabamapolicy.org
  • 54. 49 Food Stamps The current food stamp program began as a pilot program in 1961; was made a permanent program (operated at states’ option) in 1964; and a mandatory program for all states in 1974. Since 1970, the inflation-adjusted cost of the program in Alabama and the nation as a whole has increased 1,400% and 2,200%, respectively.140 In fiscal year 2013, 47.6 million Americans received food stamps, at a cost of more than $76 billion. Of these, 915,000 were Alabama residents, at a cost of $1.4 billion. Since 1970, the number of program participants in Alabama has increased 674%, while national participation has increased 821%.142 The number of food stamp recipients in Alabama decreased substantially at two points: between 1983 and 1988, and between 1993 and 2000. Since 2000, the number of participants has more than doubled, from 396,000 to 915,000 in 2013, when about one in every five Alabamians received some support from food stamps.143 Between 2000 and 2013, the number of program participants nationwide has increased 177%, from 17.2 million in 2000 to 47.6 million in 2013.144 The number of Americans on food stamps has increased during this thirteen-year period from one in 16 to about one in seven.145 $1,800 $1,600 $1,400 $1,200 $1,000 $800 $600 $400 $200 $- 1,000,000 800,000 600,000 400,000 200,000 0 1970 1975 1980 1985 1990 1995 2000 2005 2010 2015 CURRENT BENEFITS (MILLIONS) RECIPIENTS Recipients Current Benefits Cultural Indicators 2014: Poverty & Welfare www.alabamapolicy.org
  • 55. 50 SSI Benefits The Supplemental Security Income (SSI) program provides payments to the aged, blind, and disabled who are poor. Prior to its implementation as a federal program in the mid-1970s, individual states operated programs to assist people in these categories.146 During the last 30 years, SSI has changed from mainly serving elderly individuals to being a disability program. In 2012, the largest categories of SSI payments in Alabama were to persons claiming blindness or disability (166,172; 94%).147 Since 1975, the inflation-adjusted total of SSI payments Alabama residents has increased 613%. In 2013, payments to the 176,000 recipients of SSI in Alabama totaled about $1.1 billion.148 Cultural Indicators 2014: Poverty & Welfare www.alabamapolicy.org
  • 56. 51 School Lunches The National School Lunch Program began as a Depression-era program to provide surplus agricultural commodities to schools with needy children. In 1946, it was made a permanent federal program, and in 1962, funds were authorized for free and reduced price meals.149 During the 2013 school year, approximately 539,000 Alabama public school students qualified for almost 91 million free and reduced-priced meals. Nationally, almost 5.1 billion meals were served during the same school year.150 Since 1989, the number of meals served in Alabama has decreased by about 1%, while increasing about 27% nationally.151 For the 2013 school year, estimates of the total cost of the school lunch program in Alabama are $198 million and $11 billion nationwide. Since 1989, the total, inflation-adjusted amount spent on school lunches in Alabama and nationwide has increased 41% and 94%.152 Cultural Indicators 2014: Poverty & Welfare www.alabamapolicy.org
  • 57. 52 SCHIP Benefits The State Children’s Health Insurance Program (SCHIP), also known as the Children’s Health Insurance Program or (CHIP), is administered by the U.S. Department of Health and Human Services to provide matching funds to help provide health insurance to families with children. It was created in 1997 to assist children in families with incomes that are low, but too high to qualify for Medicaid.153 In 2012, approximately 113,000 children in Alabama were enrolled in SCHIP, compared to more than 8.1 million nationwide.154 The total (inflation-adjusted) cost of SCHIP in Alabama was $201 million, compared to $8.6 billion for the nation as a whole.155 Since 1999—the earliest year data is available for both Alabama and the nation—SCHIP enrollment in Alabama rose 158%. Nationally, enrollment rose 143%, from almost 2 million to more than 8.1 million in 2012.156 Cultural Indicators 2014: Poverty & Welfare www.alabamapolicy.org
  • 58. Chapter 7 Business & Government
  • 59. 54 State & Local Employees Since 1975, Alabama’s population has increased by about 31%. At the same time, the number of state and local government employees has increased by 67% and 77%, respectively.157 In 2012, Alabama had a total of 281,798 state and local government workers. Of these, 86,976 were state and 194,822 were local. Local government employees include teachers and other public education employees.158 Cultural Indicators 2014: Business & Government www.alabamapolicy.org
  • 60. 55 State Budget In fiscal year 2014, Alabama’s combined state and local expenditures totaled $41.7 billion, up $26.7 since 1992 ($20.1 billion in inflation-adjusted dollars). Since 1992, Alabama’s total state and local expenditures have increased 177% (78% after adjusting for inflation).159 In 1992, Alabama’s combined state and local budget of $15.1 billion equaled about 19% of the state’s gross domestic product (GDP) of $81.3 billion. By 2013, the estimated budget of $41.7 billion was 21% of the state’s GDP of $198 billion.160 In 2014, the three largest components of Alabama’s state and local budgets were education (31%), health care (28%), and pensions (8%).161 Cultural Indicators 2014: Business & Government www.alabamapolicy.org
  • 61. 56 Unemployment Since 1976, the unemployment rates for the United States and Alabama have closely mirrored each other. As of June 2014, preliminary data showed Alabama with an unemployment rate of 6.8%, 0.7 percentage points higher than the national average of 6.1%.162 Since April 2007—when Alabama’s employment rate was 3.3%—the rate has climbed 106% at the state level and 36% at the national level.163 Between July 2013 and July 2014, preliminary data show that Alabama lost 12,500 total non-farm jobs, for a total of 1.99 million jobs.164 The sectors with the greatest gains were mining and logging (3.4%), leisure and hospitality (2.6%), and education and health services (2.6%), while the largest loss was in government (-1.9%).165 16 14 12 10 8 6 4 2 0 1976 1980 1984 1988 1992 1996 2000 2004 2008 2012 UNEMPLOYMENT RATE (PERCENT) Alabama U.S. Cultural Indicators 2014: Business & Government www.alabamapolicy.org
  • 62. 57 References 1 U.S. Census Bureau, State & County Quick Facts: Ala-bama (last updated July 8, 2014), http://quickfacts.census. gov/qfd/states/01000.html, and earlier data. 2 Id. 3 U.S. Census Bureau, State & County Quick Facts: Ala-bama, supra note 1. 4 American Fact Finder, U.S. Census Bureau, Annual Esti-mates of the Resident Population for Selected Age Groups by Sex for the United States, States, Counties, and Puerto Rico Commonwealth and Municipios: April 1, 2010 to July 1, 2013, Table PEPAGESEX, http://factfinder2.census.gov/ faces/tableservices/jsf/pages/productview.xhtml?pid=- PEP_2013_PEPAGESEX&prodType=table (last viewed Aug. 20, 2014). 5 American Fact Finder, U.S. Census Bureau, Annual Estimates of the Resident Population by Sex, Age, Race Alone or in Combination, and Hispanic Origin for the Unit-ed States and States: April 1, 2010 to July 1, 2013, Table PEPASR5H, http://factfinder2.census.gov/faces/tableser-vices/ jsf/pages/productview.xhtml?pid=PEP_2013_PEPAS-R5H& prodType=table (last viewed Aug. 21, 2014). 6 American Fact Finder, U.S. Census Bureau, Estimates of the Components of Resident Population Change: April 1, 2010 to July 1, 2013, Table PEPTCOMP, http://factfinder2. census.gov/faces/tableservices/jsf/pages/productview.xht-ml? src=bkmk (last viewed Aug. 21, 2014). 7 U.S. Census Bureau, State & County Quick Facts: Ala-bama, supra note 1. 8 Center for Health Statistics, Alabama Department of Public Health, Alabama Vital Statistics 2012 3 (Jan. 13, 2014), available at www.adph.org/healthstats/assets/ AVS12.pdf. 9 Id. 10 Brady E. Hamilton et al., Births: Preliminary Data for 2012, 62.3 National Vital Statistics Reports 5, (Sept. 6, 2013), available at www.cdc.gov/nchs/data/nvsr/nvsr62/ nvsr62_03_tables.pdf. 11 Center for Health Statistics, Alabama Department of Public Health, Alabama Vital Statistics 2012, supra note 8 at 36. 12 Department of Health and Human Services, State of Missouri, Age-Adjusted Rate, http://health.mo.gov/data/ mica/CDP_MICA/AARate.html (last viewed Aug. 21, 2014). 13 U.S. Centers for Disease Control and Prevention, CDC Wonder: Compressed Mortality, 1999-2011 Request, won-der. cdc.gov/controller/datarequest/D98 (last viewed Aug. 21, 2014). 14 Id. 15 Deaths: Final Data for 2011, 63.3 National Vital Sta-tistics Reports 83, www.cdc.gov/nchs/data/nvsr/nvsr63/ nvsr63_03.pdf (last viewed Aug. 22, 2014). 16 Center for Health Statistics, Alabama Department of Public Health, Alabama Vital Statistics 2012, supra note 8 at 68. 17 Id., at 73-75. 18 Id., at 72. 19 Id., at 20. 20 Joyce A. Martin et al., Births: Final Data for 2011, 62.1 National Vital Statistics Reports (June 28, 2012), available at www.cdc.gov/nchs/data/nvsr/nvsr62/ nvsr62_01.pdf. 21 Brady E. Hamilton et al., Births: Preliminary Data for 2012, supra note 10. 22 Center for Health Statistics, Alabama Department of Public Health, Alabama Vital Statistics 2012, supra note 8 at 23. 23 Id., at 30. 24 Id., at 31. 25 Alabama Criminal Justice Information Center, Crime in Alabama 2013, www.acjic.alabama.gov/file-2013_cia. pdf (last viewed Aug. 22, 2014). 26 Id., and earlier editions. 27 Id. 28 Florida Department of Law Enforcement, UCR Offense Data: Crime in the U.S., 1972-2012 (Dec. 6, 2013), available at www.fdle.state.fl.us/Content/getdoc/ d75b9423-91ea-4704-86c8-5beb8c50f b61/1971_fwd_ totalcrime.aspx. 29 Alabama Criminal Justice Information Center, Crime in Alabama 2013, supra note 25, and earlier editions. 30 Id. 31 Federal Bureau of Investigation, U.S. Department of Justice, Uniform Crime Reporting Statistics, www.ucrdata-tool. gov/Search/Crime/State/StateCrime.cfm (last viewed Aug. 22, 2014). 32 Id. 33 E. Ann Carson and Daniela Golinelli, U.S. Department of Justice, Prisoners in 2012: Advance Counts, NCJ 242467 (July 2013), available at www.bjs.gov/content/pub/pdf/ p12ac.pdf. 34 Id., and earlier reports. 35 Id., at 40. 36 Id. 37 Alabama Department of Corrections, Fiscal Year 2012 Annual Report 42, available at www.doc.state.al.us/docs/ AnnualRpts/2012AnnualReport.pdf. 38 Id., at 44. 39 Id., at 42. 40 Id., at 17. 41 Id. 42 Legislative Fiscal Office, State of Alabama, Budget Fact Book 58, available at www.lfo.state.al.us/pdfs/Bud-get% 20Fact%20Book/2014%20Budget%20Fact%20Book. pdf. 43 Administration on Children, Youth and Families, U.S. Department of Health and Human Services, Child Mal-treatment 2012 (Dec. 17, 2013), available at www.acf.hhs. gov/sites/default/files/cb/cm2012.pdf (last viewed Aug. 27, 2014), and earlier editions. Cultural Indicators 2014: References www.alabamapolicy.org
  • 63. 58 Comparisons, http://nces.ed.gov/nationsreportcard/ statecomparisons/Default.aspx?usrSelections=0%2c- MAT%2c0%2c0%2cwithin%2c0%2c0 (last viewed Aug. 24, 2014). 62 National Center for Education Statistics, The Na-tion’s Report Card: Mathematics—2013 State Snapshot Report (Alabama Grade 4 Public Schools), http://nces. ed.gov/nationsreportcard/subject/publications/stt2013/ pdf/2014465AL4.pdf (last viewed Aug. 25, 2014). 63 National Center for Education Statistics, The Na-tion’s Report Card: Mathematics—2013 State Snapshot Report (Alabama Grade 8 Public Schools), http://nces. ed.gov/nationsreportcard/subject/publications/stt2013/ pdf/2014465AL8.pdf (last viewed Aug. 25, 2014). 64 National Center for Education Statistics, The Na-tion’s Report Card: Reading—2013 State Snapshot Report (Alabama Grade 4 Public Schools), http://nces.ed.gov/ nationsreportcard/subject/publications/stt2013/pd-f/ 2014464AL4.pdf (last viewed Aug. 25, 2014). 65 National Center for Education Statistics, The Na-tion’s Report Card: Reading—2013 State Snapshot Report (Alabama Grade 8 Public Schools), http://nces.ed.gov/ nationsreportcard/subject/publications/stt2013/pd-f/ 2014464AL8.pdf (last viewed Aug. 25, 2014). 66 National Education Association, Rankings & Esti-mates: Rankings of the States 2013 and Estimates of School Statistics 2014 (Mar. 2014), www.nea. org/assets/docs/NEA-Rankings-and-Estimates-2013-2014. pdf, and earlier editions. 67 Id. 68 Id. 69 Id., at 53. 70 U.S. Census Bureau, Households, Families, Subfamilies, and Married Couples: 1980 to 2010, Table 59, in Statistical Abstract of the United States: 2012 54 (131st ed. 2001), available at www.census.gov/prod/2011pubs/12statab/ pop.pdf. 71 Center for Health Statistics, Alabama Department of Public Health, Alabama Vital Statistics 2012, supra note 8 at 78. 72 Id. 73 National Vital Statistics Reports, 58 Births, Marriages, Sex by Educational Attainment for the Population 25 Years and Over (White Alone), Table B15002A, in 2012 American Community Survey 1-Year Estimates, http://factfinder2. census.gov/faces/tableservices/jsf/pages/productview. xhtml?pid=ACS_12_1YR_B15002A&prodType=table (last viewed Aug. 25, 2014). Data for black population from Sex by Educational Attainment for the Population 25 Years and Over (Black or African American Alone), Table B15002B, in 2012 American Community Survey 1-Year Estimates, http://factfinder2.census.gov/faces/tableservices/ jsf/pages/productview.xhtml?pid=ACS_12_1YR_ B15002B&prodType=table (last viewed Aug. 25, 2014). 51 U.S. Census Bureau, Percent of People 25 Years and Over Who Have Completed High School (Includes Equiva-lency), supra note 49. 52 U.S. Census Bureau, Percent of People 25 Years and Over Who Have Completed a Bachelor’s Degree, supra note 49. 53 U.S. Census Bureau, Median Earnings in the Past 12 Months (In 2012 Inflation-Adjusted Dollars) by Sex of Educational Attainment for the Population 25 Years and Over, Table B20004, in 2012 American Communi-ty Survey 1-Year Estimates, http://factfinder2.census. gov/faces/tableservices/jsf/pages/productview.xhtm-l? pid=ACS_12_1YR_B20004&prodType=table (last viewed Aug. 25, 2014). 54 ACT, 2013 ACT National and State Scores: Averaged Scores by State, www.act.org/newsroom/data/2013/ states.html (last viewed Aug. 25, 2014). 55 ACT, 2013 ACT National and State Scores: ACT Profile Re-ports, www.act.org/newsroom/data/2013/profilereports. html (last viewed Aug. 25, 2014). 56 ACT, ACT Profile Report – State: Graduating Class 2013, Alabama (July 12, 2013), www.act.org/newsroom/ data/2013/pdf/profile/Alabama.pdf. 57 Id., and earlier reports. 58 Id., at 15. 59 Id., at 14. 60 National Center for Education Statistics, NAEP Data Explorer, http://nces.ed.gov/nationsreportcard/naepdata/ dataset.aspx (last viewed Aug. 24, 2014). 61 National Center for Education Statistics, NAEP State 44 Id. 45 Id. 46 Id. 47 Id. 48 White population estimates from American Fact Find-er, U.S. Census Bureau, Sex by Age (White Alone)—Uni-verse: People Who are White Alone, 2012 American Com-munity Survey 1-Year Estimates, Table B01001A, http:// factfinder2.census.gov/faces/tableservices/jsf/pages/ productview.xhtml?pid=ACS_12_1YR_B01001A&prod- Type=table (last viewed Aug. 20, 2014). Black population estimates from American Fact Finder, U.S. Census Bu-reau, Sex by Age (Black Alone)—Universe: People Who are Black or African-American Alone, Table B01001B, http:// factfinder2.census.gov/faces/tableservices/jsf/pages/ productview.xhtml?pid=ACS_12_1YR_B01001B&prod- Type=table (last viewed Aug. 20, 2014). Hispanic popula-tion estimates from American Fact Finder, U.S. Census Bureau, Sex by Age (Hispanic or Latino)—Universe: People Who are Hispanic or Latino, 2012 American Community Survey 1-Year Estimates, Table B01001I, http://factfinder2. census.gov/faces/tableservices/jsf/pages/productview. xhtml?pid=ACS_12_1YR_B01001I&prodType=table (last viewed Aug. 20, 2014). 49 U.S. Census Bureau, Percent of People 25 Years and Over Who Have Completed High School (Includes Equivalency), Table R1501, in 2012 American Community Survey 1-Year Estimates, http://factfinder2.census. gov/faces/tableservices/jsf/pages/productview. xhtml?pid=ACS_12_1YR_R1501.US01PRF&prodType=table (last viewed Aug. 25, 2014); and U.S. Census Bureau, Percent of People 25 Years and Over Who Have Completed a Bachelor’s Degree, Table R1502, in 2012 American Community Survey 1-Year Estimates, http://factfinder2. census.gov/faces/tableservices/jsf/pages/productview. xhtml?pid=ACS_12_1YR_R1502.US01PRF&prodType=table (last viewed Aug. 25, 2014). Earlier data from U.S. Census Bureau, Statistical Abstract of the United States: 2000 (119th ed. 2001). 50 U.S. Census Bureau, 1970 Census of Population: Vol. I—Characteristics of the Population 2-154 (Feb. 1973), www2.census.gov/prod2/decennial/ documents/1970a_al.zip. Data for white population from Cultural Indicators 2014: References www.alabamapolicy.org
  • 64. 59 Divorces, and Deaths: Provisional Data for 2009 5 (Aug. 27, 2010), available at www.cdc.gov/nchs/data/nvsr/nvsr58/ nvsr58_25.htm. 74 Center for Health Statistics, Alabama Department of Public Health, Alabama Vital Statistics 2012, supra note 8 at 82. 75 Id. 76 National Vital Statistics Reports, 58 Births, Marriag-es, Divorces, and Deaths: Provisional Data for 2009, supra note 73. 77 Center for Health Statistics, Alabama Department of Public Health, Alabama Vital Statistics 2012, supra note 8 at 82. 78 Id., at 85. 79 Id., at 84. 80 Id. 81 Pat Fagan, Marriage & Religion Research Institute, The Fourth Annual Index of Belonging and Rejection, Fam-ily Research Council (2014), available at http://down-loads. frc.org/EF/EF14B32.pdf. Estimates of 15-17-year-olds from U.S. Census Bureau, 2009-2011 and 2010-2012 American Community Survey 3-Year Estimates, Table S0101, http://factfinder2.census.gov/faces/tableservices/ jsf/pages/productview.xhtml?pid=ACS_11_3YR_ S0101&prodType=table (last viewed Feb. 18, 2014). 82 Id. 83 Fagan, The Fourth Annual Index of Belonging and Rejec-tion, supra note 81. 84 Id. 85 Center for Health Statistics, Alabama Department of Public Health, Alabama Vital Statistics 2012, supra note 8 at 9. 86 Brady E. Hamilton et al., Births: Preliminary Data for 2013, 63.2 National Vital Statistics Reports, supra note 10 at 14. 87 Center for Health Statistics, Alabama Department of Public Health, Alabama Vital Statistics 2012, supra note 8 at 9. 88 Joyce A. Martin et al., Births: Final Data for 2012, 62.9 National Vital Statistics Reports (Dec. 30, 2013), avail-able at www.cdc.gov/nchs/data/nvsr/nvsr62/nvsr62_09_ tables.pdf. 89 Center for Health Statistics, Alabama Department of Public Health, Alabama Vital Statistics 2012, supra note 8 at 9. 90 Id. 91 Id., at 8. 92 Guttmacher Institute, Fact Sheet: Induced Abortion in the United States (July 2014), www.guttmacher.org/ pubs/fb_induced_abortion.pdf. National data and earlier state data from U.S. Census Bureau, Abortions—Number and Rate by Race: 1990 to 2007, Table 101, in Statistical Abstract of the United States: 2012 75 (131st ed. 2012), available at www.census.gov/prod/2011pubs/12statab/ vitstat.pdf. 93 Center for Health Statistics, Alabama Department of Public Health, Alabama Vital Statistics 2012, supra note 8 at 31. 94 Guttmacher Institute, State Facts about Abortion (July 2, 2014), www.guttmacher.org/statecenter/sfaa.html. 95 Guttmacher Institute, Fact Sheet: Induced Abortion in the United States (July 2014), www.guttmacher.org/pubs/ fb_induced_abortion.html. 96 Id., and earlier editions. 97 American Fact Finder, U.S. Census Bureau, Annual Es-timates of the Resident Population: April 1, 2010 to July 1, 2013 - United States -- Metropolitan Statistical Area; and for Puerto Rico, Table GCT-PEPANNRES (Mar. 2014), http:// factfinder2.census.gov/faces/tableservices/jsf/pages/pro-ductview. xhtml?src=bkmk. Data for white population from Sex by Educational Attain-ment for the Population 25 Years and Over (White Alone), supra note 50. 98 American Fact Finder, U.S. Census Bureau, Family Type by Presence and Age of Own Children Under 18 Year, Table B11003, http://factfinder2.census.gov/faces/table-services/ jsf/pages/productview.xhtml?pid=ACS_12_1YR_ B11003&prodType=table (last viewed Aug. 28, 2014), and earlier editions. 99 Id. 100 U.S. Census Bureau, Families by Presence of Own Children under 18: 1950 to Present, Table FM-1 (Nov. 2013), www.census.gov/hhes/families/data/families.html (last viewed Aug. 28, 2014). 101 Social Security Administration, Number of Recipients, Total Payments, and Average Payment, by State, Fiscal Year 2010, Table 8.H1, in Annual Statistical Supplement to the Social Security Bulletin, 2012 (Feb. 2013), available at www.ssa.gov/policy/docs/ statcomps/supplement/2012/8h.pdf, and earlier reports. 102 Id. 103 Id. 104 Social Security Administration, Medicare, in Annual Statistical Supplement to the Social Security Bulletin, 2012 36 (Feb. 2013), available at www. ssa.gov/policy/docs/statcomps/supplement/2012/medi-care. pdf. 105 Centers for Medicare & Medicaid Services, Medicare Enrollment: Hospital Insurance and/or Supplementary Medical Insurance for Aged and Disabled Enrollees and To-tal Resident Population by State of Residence as of July 1, 2012, Table 2.8, in Medicare & Medicaid Statistical Supple-ment, 2013 Edition (Jan. 2, 2014), available at www. cms.gov/Research-Statistics-Data-and-Systems/Statis-tics- Trends-and-Reports/MedicareMedicaidStatSupp/ Downloads/2013_Section2.pdf#Table2.8, and earlier re-ports. 106 Id. 107 Centers for Medicare & Medicaid Services, Medicare Program Payments, by Type of Coverage, and Type of Entitlement: Calendar Years 1967- 2011, Table 3.2, in Medicare & Medicaid Statistical Supplement, 2012 Edition (Mar. 12, 2013), available at www.cms.gov/Research-Statistics-Data-and-Systems/Sta-tistics- Trends-and-Reports/MedicareMedicaidStatSupp/ Downloads/2012ProgPayments.zip. 108 Centers for Disease Control and Prevention, Chla-mydia: CDC Fact Sheet, www. cdc.gov/std/chlamydia/STDFact-Chlamydia.htm (last up-dated June 30, 2014). 109 Centers for Disease Control and Prevention, Sexual-ly Transmitted Disease Surveillance 2012 79-80 (Jan. 2014), Cultural Indicators 2014: References www.alabamapolicy.org
  • 65. 60 www.cdc.gov/std/stats12/Surv2012.pdf, and earlier data. 110 Remedy Health Media, Sexually Transmitted Diseases and Infections (May 31, 2011), www.healthcommunities.com/std/sexuallytransmitted-disease- overview.shtml (last viewed Jan. 3, 2014). 111 Centers for Disease Control and Prevention, Sexual-ly Transmitted Disease Surveillance 2012, supra note 109 at 81. 112 Centers for Disease Control and Prevention, Gonorrhea: CDC Fact Sheet, www.cdc.gov/std/gonorrhea/ STDFact-gonorrhea.htm (last updated July 1, 2014). 113 Centers for Disease Control and Prevention, Sexual-ly Transmitted Disease Surveillance 2012, supra note 109 at 94. 114 Id., at 93. 115 Centers for Disease Control and Prevention, Syphilis: CDC Fact Sheet, www.cdc.gov/std/syphilis/STD-Fact- Syphilis.htm (last updated July 8, 2014). 116 Centers for Disease Control and Prevention, Sexual-ly Transmitted Disease Surveillance 2012, supra note 109 at 105. 117 Margaret T. Kay & Suzanne M. Ingle, Life Expectancy of HIV-Positive Adults: A Review. 8 Sexual Health (2011), 526-533 118 Gerald L. Mandell et al., eds., Mandell, Douglas, and Bennett’s Principles and Practice of Infectious Diseases (7th ed. 2010). 119 Centers for Disease Control and Prevention, 23 HIV Surveillance Report, 2011 68 (Feb. 2013), available at www.cdc.gov/hiv/surveillance/resources/ reports/2011report/pdf/2011_HIV_Surveillance_ Report_vol_23.pdf#Page=68, and earlier reports. 120 Id., at 17. 121 Id., at 71-72. 122 Id., at 17-18. 123 Centers for Disease Control and Prevention, Techni-cal Notes, in 19 HIV/AIDS Surveillance Report, 2007 (2009), available at www.cdc.gov/hiv/surveillance/resources/re-ports/ 2007report/pdf/technicalnotes.pdf. 124 American Fact Finder, U.S. Census Bureau, Selected Population Profile in the United States: 2012 American Community Survey 1-Year Estimates, Table S0201, http://factfinder2.census.gov/faces/tableservices/ jsf/pages/productview.xhtml?pid=ACS_12_1YR_ S0201&prodType=table (last viewed Jan. 3, 2014), and earlier data. Other data from Carmen Denavas-Walt et al., U.S. Census Bureau, Income, Poverty, and Health Insurance Coverage in the United States: 2011 (Sept. 2012), available at www.census.gov/prod/2012pubs/ p60-243.pdf; and Carmen Denavas-Walt & Robert W. Cleveland, U.S. Census Bureau, Money Income in the United States: 2001 (Sept. 2002), available at www.census. gov/prod/2002pubs/p60-218.pdf. 125 Id. 126 Id. 127 Id. 128 U.S. Census Bureau, American Housing Survey 2011 AHS National and Metropolitan Area Summary Data, www.census.gov/housing/ahs/data/national.html (last viewed Aug. 25, 2014). 129 Office of Policy Development and Research, U.S. Department of Housing and Urban Development, American Housing Survey for the United States: 2009 (Mar. 2011), available at www.census.gov/prod/2011pubs/ h150-09.pdf. 130 U.S. Census Bureau, Poverty: How the Census Bureau Measures Poverty (Dec. 3, 2013), www.census.gov/hhes/ www/poverty/about/overview/measure.html. 131 American Fact Finder, U.S. Census Bureau, Poverty Status in the Past 12 Months of Families by Household Type by Presence of Own Children Under 18 Years, 2012 Amer-ican Community Survey 1-Year Estimates, Table C17023, http://factfinder2.census.gov/faces/tableservices/jsf/pag-es/ productview.xhtml?pid=ACS_12_1YR_C17023&prod- Type=table (last viewed Aug. 29, 2014), and earlier data. 132 Id. 133 Id. 134 Id. 135 Social Welfare History Project, Aid to Dependent Children: The Legal History, www.socialwelfarehistory. com/programs/aid-to-dependent-children-the-legal-histo-ry/ (last viewed Sept. 4, 2014). 136 Child Trends, Child Recipients of Welfare (AFDC/TANF), www.childtrends.org/?indicators=child-recipients-of-wel-fareafdctanf (last updated Aug. 2014). 137 Office of Family Assistance, U.S. Department of Health & Human Services, Caseload Data 2013 (May 23, 2014), www.acf.hhs.gov/programs/ofa/resource/case-load- data-2013. 138 Id., and Administration for Children & Families, U.S. Department of Health & Human Services, Archives: 1993, http://archive.acf.hhs.gov/programs/ofa/data-reports/ caseload/afdc/1993/fycytotal93_ek.htm (last updated Dec. 19, 2004). 139 Office of Family Assistance, U.S. Department of Health & Human Services, Caseload Data 2013, supra note 137. 140 All federal and state data (2009-2013) from Food and Nutrition Service, U.S. Department of Agriculture, Program Data: Supplemental Nutrition Assistance Program (Dec. 6, 2013), www.fns.usda.gov/pd/supplemental-nutrition- assistance-program-snap. Earlier state data from Nadine Nichols, Food and Nutrition Service, U.S. Department of Agriculture, custom data request, Mar. 14, 2013 141 Id. 142 Id. 143 Id. 144 Id. 145 Id. 146 Social Security Administration, Supplemental Secu-rity Income Program Description and Legislative History, in Annual Statistical Supplement to the Social Security Bulletin, 2012, www.ssa.gov/policy/docs/statcomps/sup-plement/ 2012/ssi.html (last viewed Sept. 4, 2014) 147 Id. 148 Social Security Administration, Number of Recipients of Federally Administered Payments, December 2012, and Total Payments for Calendar Year 2012, by State and Other Area and Eligibility Category, Table 7.B1, in Annual Statis-tical Supplement to the Social Security Bulletin, (Feb. 2014), available at www.ssa.gov/policy/docs/statcomps/ supplement/2013/7b.pdf, and earlier data. Other data Cultural Indicators 2014: References www.alabamapolicy.org
  • 66. 61 from U.S. Census Bureau, Supplemental Security Income (SSI)—Recipients and Payments by State and Other Area: 2000 to 2009, Table 564, in Statistical Abstract of the Unit-ed States: 2012 364 (131st ed. 2012), available at www. census.gov/prod/2011pubs/12statab/socins.pdf, and earli-er editions. 149 Food and Nutrition Service, U.S. Department of Ag-riculture, National School Lunch Program (NSLP): Back-ground and Development, www.fns.usda.gov/nslp/history (last modified June 17, 2014). 150 Recent data (2009-13) from Food and Nutrition Ser-vice, U.S. Department of Agriculture, Program Data: Child Nutrition Tables, www.fns.usda.gov/pd/cnpmain. htm (last viewed Jan. 3, 2014). Earlier data from Food and Nutrition Service, U.S. Department of Agriculture, Office of Research and Analysis, custom data request, Jan. 4, 2013. 151 Id. 152 Id. 153 Centers for Medicare and Medicaid Services, U.S. Department of Health and Human Services, Children’s Health Insurance Program (CHIP), www.medicaid.gov/ Medicaid-CHIP-Program-Information/By-Topics/Childrens- Health-Insurance-Program-CHIP/Childrens-Health- Insurance-Program-CHIP.html#TopOfPage (last viewed Aug. 30, 2013). 154 Henry J. Kaiser Family Foundation, Number of Children Ever Enrolled in the Children’s Health Insurance Program (CHIP), Family Facts, http://kff.org/other/ state-indicator/annual-chipenrollment/(last viewed Jan. 4, 2013); and U.S. Census Bureau, Children’s Health Insurance Program (CHIP)—Enrollment and Expenditures by State: 2000 and 2010, Table 145, in Statistical Abstract of the United States: 2012 106 (131st ed. 2012), available at www.census.gov/prod/2011pubs/12statab/health.pdf, and earlier editions. 155 Center for Children and Families, Georgetown University Health Policy Institute, Federal and State Share of CHIP Spending, FY 2012 (millions), (Apr. 12, 2013), http://ccf.georgetown.edu/wp-content/uploads/2012/04/ CHIP-Spending1.pdf. 156 Henry J. Kaiser Family Foundation, supra note 154. 157 State employee data from U.S. Census Bureau, 2012 Public Employment and Payroll Data: State Governments— Alabama, www2.census.gov/govs/apes/12stal.txt (last viewed Aug. 30, 2014). Local public employee data from U.S. Census Bureau, 2012 Public Employment and Payroll Data: Local Governments—Alabama, www2.census.gov/ govs/apes/12local.txt (last viewed Aug. 30, 2014). 158 Id. 159 Christopher Chantrill, Florida Government Spending Chart, USGovernmentSpending.com, www. usgovernmentspending.com/spending_chart_2000_2014 ALt_15s2li011mcn__US_Real_Gross_Domestic_Product_ History (last viewed Jan. 1, 2014). 160 Id. 161 Id. 162 State unemployment data from Bureau of Labor Statistics, U.S. Department of Labor, Local Area Unemployment Statistics, www.bls.gov/lau/ (last viewed Aug. 30, 2014), (in “Databases” menu, follow “Multi-Screen Data Search”; then “01 Alabama”; then “A Statewide”; then “ST010000 Florida”; then “03 Unemployment Rate”; then “Seasonally Adjusted”; and then “Retrieve Data”). National unemployment data from Bureau of Labor Statistics, U.S. Department of Labor, Employment Status of the Civilian Noninstitutional Population 16 Years and Over, 1978 to Date, Table A-1, www.bls.gov/web/empsit/cpseea01.htm (last updated Aug. 1, 2014). 163 Id. 164 Bureau of Labor Statistics, U.S. Department of La-bor, Local Area Unemployment Statistics, http://data.bls. gov/timeseries/LASST010000000000005?data_tool=XG-table (last viewed Aug. 30, 2014). 165 Bureau of Labor Statistics, U.S. Department of La-bor, Economy at a Glance: Alabama (Aug. 27, 2014), ww-w. bls.gov/eag/eag.al.htm. Cultural Indicators 2014: References www.alabamapolicy.org