SlideShare a Scribd company logo
1 of 31
Download to read offline
2015 Population Health Profile
of Orange County, Florida
Published April 1, 2015 by Alyssa Laswell
The Florida Department of Health works to protect,
promote & improve the health of all people in Florida
through integrated state, county, & community efforts.
Florida Department of Health in Orange County ||2
2015 Orange County Community Health Assessment
CONTENTS
Introduction................................................................................................................................... 3
Demographic and Socioeconomic Characteristics .....................................................................4
Population Overview.................................................................................................................4
Social and Economic Profile......................................................................................................6
Households and Families ........................................................................................................6
Schools & Education ...............................................................................................................6
Employment ........................................................................................................................... 7
Income and Poverty................................................................................................................8
Uninsured And Health Care Costs...........................................................................................9
Homelessness .........................................................................................................................9
Mortality: Leading Causes of Death............................................................................................ 11
Leading Causes of Death............................................................................................................12
Infant Mortality .........................................................................................................................18
Motor Vehicle Crashes and pedestrian fatalities.......................................................................19
Morbidity (Disease incidence and Prevalence).........................................................................20
Maternal and Child Health ......................................................................................................20
Birth Rate, Teen Births ......................................................................................................... 20
Preterm and Low Birth Weight ............................................................................................ 20
Chronic Diseases.......................................................................................................................21
Cardiovascular Disease ..........................................................................................................21
Cancer ....................................................................................................................................21
Diabetes.................................................................................................................................21
Asthma...................................................................................................................................22
Overweight and Obesity........................................................................................................22
Health Behaviors (BRFSS Results).......................................................................................... 23
Infectious Diseases..................................................................................................................24
HIV/AIDS................................................................................................................................ 24
Sexually Transmitted Diseases ............................................................................................. 24
Tuberculosis.......................................................................................................................... 24
Health Inequities ......................................................................................................................... 25
Minority Profile: Black Population.......................................................................................... 25
Minority Profile: Hispanic Population..................................................................................... 25
County Health Rankings 2015 .....................................................................................................26
Florida Department of Health in Orange County ||3
2015 Orange County Community Health Assessment
INTRODUCTION
This Community Health Assessment uses data from a wide variety of sources. Every effort was made to
include the most up to date data available. Throughout this assessment, comparisons will be made to the
entire state of Florida (67 counties in total), as well as to select groups of counties. Orange, Seminole, and
Osceola counties are neighboring counties and comparison can be useful for regional geographic data. The
Orlando Metropolitan Statistical Area encompasses these three counties and is often used for comparison
purposes. In addition, comparisons may be drawn between counties with a similar socio-demographic makeup,
namely: Miami-Dade, Broward, Palm Beach, and Hillsborough counties. These are the four counties in Florida
with a larger population than Orange County, and they all encompass at least one major city, which can be
useful for comparison to the Orlando area. These “peer” counties include cities such as Miami, Fort
Lauderdale, West Palm Beach, and Tampa.
It is often helpful to use county data to rank the 67 counties in regard to specific health factors or outcomes.
For these purposes, this assessment will use quartiles when appropriate. The use of quartiles involves ranking
the 67 counties, in order from best to worst. The top quartile (25%) is the best 16 counties for each measure. In
some cases, this may be the highest rate (for example: adults who consume 5 servings of vegetables daily), and
other measures may use the lowest rate to represent the best case (for example: rates of uninsured persons).
The 1st
and 2nd
quartiles represent the counties with the best status for each indicator, and the 3rd
and 4th
quartiles represent areas which Orange County should target for improvement.
Florida Department of Health in Orange County ||4
2015 Orange County Community Health Assessment
DEMOGRAPHIC AND SOCIOECONOMIC CHARACTERISTICS
Orange County consists of 903 square miles of land and
99 square miles of water, located in Central Florida.1
It is
bordered on the north by Seminole County, the east by
Brevard County, south by Osceola County, and to the west
by Lake County. Orange County is home to 1,221,712
residents, with 255,483 living in Orlando, the largest city in
the county.2
Orlando is the largest inland city in Florida.
Orange County is densely populated, with an average of
1,332 people per square mile.3
This is higher than the state
average, estimated to be 359 people per square mile in
2013, and the U.S. average of 87 residents per square mile.4
It is estimated that only 2% of the Orange County
population lives in a rural setting.5
Orange County is
located in what is known as the Orlando-Kissimmee-
Sanford Metropolitan Statistical Area (also referred to as
the Orlando MSA). The Orlando MSA includes Orange,
Osceola, and Seminole Counties (Orange’s neighbors to
the south and north, respectively).
Orange County is home to such travel destinations as the Walt Disney World Resort, Universal Orlando
Resort, and SeaWorld Orlando Resort. An estimated annual 52.9 million domestic visitors and 4.1 million
international tourists make the Orlando area one of the top tourist destinations in the United States.6
Orlando
has a large international airport, and is also known for its shopping and convention centers. The University of
Central Florida, located within the county, boasts the 2nd
highest enrollment in the nation. The recent
expansion of the Medical City includes the new UCF College of Medicine, which opened in 2009, and Nemours
Children Hospital, which opened in 2012.
POPULATION OVERVIEW
Orange County is the state's 5th most populous county, home to 6.2% of Florida's overall population.7
Orange
County is the 16th fastest-growing county in Florida, experiencing population growth at a rate of 27.8%
between the 2000 and 2010 census counts. This is above the state average of 17.6%.8
Orange County's
population skews younger than Florida's overall population, with a median age of 33.7 years compared to the
state average of 40.8 years9
However, Orange County, like the rest of the state, has an aging population. The
life expectancy for women the United States is 80.9 years and men is 76.3.10
In Orange County, women’s life
expectancy is 81.5 years, and men’s is 76.7 years. This places Orange County in the top 25% of all counties in the
nation. The life expectancy has increased at a rate better than 75% of all counties in the years 1985-2010.
Location of Orange County, Florida
(guy)
guy, s. (n.d.). wikipedia. Retrieved
from wiki.com
Florida Department of Health in Orange County ||5
2015 Orange County Community Health Assessment
Additionally, Orange County is more racially diverse than the rest of Florida, with only 63.6% of its population
identifying as white, in contrast to 75% of the state of Florida11
. Orange County has proportionally higher ethnic
populations of Hispanics, Black/African Americans and Asians12
. The county, like the rest of the state, is
expected to grow increasingly diverse in the years to come.
There are an estimated 64,450 residents of Orange County that are not proficient in English. This accounts for
approximately 6% of the population13
. This is a significantly lower rate than the 6.4% of Florida’s overall
population that does not demonstrate English proficiency. English proficiency may have an impact on health
literacy and health education efforts. Approximately 19% of Orange County’s populace was born outside of the
United States. This is similar to the state rate, but much higher than the national average of 12.9%.
Florida Department of Health in Orange County ||6
2015 Orange County Community Health Assessment
SOCIAL AND ECONOMIC PROFILE
HOUSEHOLDS AND FAMILIES
An average household in Orange County is made up of 2.7 people, which is slightly higher than the state
average of 2.5 people.14
There are 94,275 households in Orange County who reported severed housing
problems in 2010. This is 23% of the population, which is significantly higher than the state average of 22%.15
SCHOOLS & EDUCATION
Orange County has 205 public education institutions; 130 of these are elementary schools.16
The county
population has a significantly higher rate of educational attainment than the rest of the state17
; 86.9% of
Orange County’s adults over the age of 25 years are high school graduates, and 30.0% have obtained a
bachelor’s degree or higher. This compares to the 85.5% of the state’s adults older than 25 years that are high
school graduates, and 26.0% with a bachelor’s degree or higher.18
However, within Orange County, educational attainment rates vary wildly, from a low of 0% of the population
without a high school diploma in a census tract in Winter Park, to a high of 40.5% of the population without a
high school diploma in a census tract in Ocoee.
The map below illustrates areas of great need within in Orange County. This map highlights, by census tracts,
areas with a high percentage of the population living below the poverty line, and population with low
educational attainment.
Florida Department of Health in Orange County ||7
2015 Orange County Community Health Assessment
On this map, a “vulnerable population” is defined as a population in which more than 30% of the population is
below the poverty level and more than 25% of the residents over the age of 25 years do not have a high school
diploma. Vulnerable populations (by census tract), where both of these conditions coexist, are illustrated by a
dark brown color on the map. Additionally, pockets of wealthy individuals are mapped here, colored in green.
The green areas show census tracts in which the highest 1/5 of earners makes more than twice the average
income in the county. This helps to visualize income inequalities, which often mirror health inequities in
populations.
EMPLOYMENT
Orange County has historically benefitted from lower rates of unemployment than the rest of the state.
Despite seeing a high level of unemployment in 2010 (11.1%, which mirrored the rest of the state), Orange
County has seen a decrease in the years since, with an estimated 5.4% of the population unemployed in
October 2014. This is below the national average of 5.5% and the state average of 5.8%.19
In the years 2014
through 2022, it is expected that the state of Florida will see a 14.1% increase in the amount of jobs. This is
equivalent to 116,411 new jobs created by 2022. 20
The largest employers21
and industries22
of the 1,117,900 nonagricultural workers in the Orlando MSA are:
Company Employees
Walt Disney World Resort 74,000
University of Central Florida 11,078
Darden Restaurants 6,419
SeaWorld Orlando 6,032
Lockheed Martin 5,774
Siemens Energy 4,448
Aon Hewitt 1,769
L-3 Coleman Aerospace 955
Electronic Arts 800
Florida Department of Health in Orange County ||8
2015 Orange County Community Health Assessment
INCOME AND POVERTY
Orange County’s median household income of $46,675 is the 21st
highest in the state. This is $654 higher than
the Florida average, but significantly lower than the national median household income of $52,250. 23,24
Orange County is home to 212,956 people, or 18.2% of its residents, who live below the federal poverty level,
according to a 2013 estimate from the US Census Bureau.25
This is a higher rate than the Florida state average
(17.1%) and significantly higher than the rest of the United States (15.8%).26
Please see the map below for a
distribution of poverty-stricken individuals within the county.
An estimated 170,711 individuals in Orange County receive Medicaid (18.9% of the population). This rate is
lower than the state average of 20.3% and the national average of 20.2%.
Additionally, Orange County has more children under the age of 18 years in poverty than the rest of the
state and significantly more children in poverty when compared to the rest of the United States (27.1% in
Orange County, 25.6% in Florida, and 22.6% nationwide). 27,28
In Orange County, 50% of children are eligible for
free lunches. This is slightly higher than the state average of 49%.29
Eighteen percent of Orange County
residents report food insecurity, and 6% (70,016 residents) report that they have limited access to healthy
foods.30
There are multiple food deserts in Orange County. A food desert is defined as a low-income (LI) census
tract where a significant proportion of the population lives more than 1 mile from a supermarket in urban areas
or 10 miles in rural areas (referred to as low access or LA). These areas are highlighted in green on the map that
follows.
Florida Department of Health in Orange County ||9
2015 Orange County Community Health Assessment
UNINSURED AND HEALTH CARE COSTS
In 2011, it was estimated that 219,629 adults, or 29%, of Orange County adults (under age 65) were uninsured.
This was similar to the state average of 29%.31
In addition, there were 36,738 uninsured children in Orange
County, which is equivalent to 13% of all children. Again, this rate was not unlike the state average of 12%.
Orange County residents spend significantly more money on health care related costs than the rest of the
state. It is estimated that Orange County spends $11,552 per person on healthcare each year, while the average
Floridian spends about $365 less.32
The percentage of the population who reported that they could not visit a
doctor due to the cost was 18%; the state average was 17%.33
HOMELESSNESS
Based on a 2013 report on homelessness by the Department of Children and Families' Council on
Homelessness, Florida has the third largest homeless population in the country; 8.7% of the nation's homeless
live in Florida. Florida also has the third highest rate of unsheltered homeless persons (64.1%). 34
Homeless estimates are based on a count conducted nationwide in one day and one night in January.
Although Florida’s homeless population has been steadily declining since 2007, Orange County's homeless
population shows an overall upward trend. The 2013 count was the highest in the past 7 years (data unavailable
prior to 2007). Florida state has seen a 25% decrease in the number of homeless individuals in years 2007-2013;
Orange County has seen a 100% increase in the same time period. In 2013, Orange County had the 4th highest
count of homeless individuals, accounting for 6.5% of the state's homeless population.
Based on the 2013 report, Orange, Osceola, and Seminole Counties together have the highest number of
chronically homeless people among smaller city, county, and regional areas in the US-- an estimated 1,577 are
chronically homeless.35
This places the Orlando MSA as 7th in the nation, behind the major cities of Los
Angeles, New York City, San Diego, CA, San Jose/Santa Clara, CA, San Francisco, and Washington, DC. In the
January 2013 count, there were 479 homeless unaccompanied children and youth under the age of 25 in
Orange, Osceola, and Seminole counties. This is the 10th highest count in the nation.
Florida Department of Health in Orange County ||10
2015 Orange County Community Health Assessment
The Florida Department of Education reports that Orange County has the highest amount of homeless
students of the 67 counties in Florida. The 2012-13 school year is the first year that Orange County has
surpassed the number of homeless students in Miami-Dade County, even though Orange County has half the
number of school aged children who reside in Miami-Dade. Out of the top 12 counties in Florida with the
highest number of homeless students, half of the counties are in Central Florida, including all 3 counties that
make up the Orlando Metropolitan Statistical Area (MSA). All five of the counties with the largest population
are also included in the top 12 (Orange County’s peer metropolitan counties). Central Florida has more
homeless children than the four largest counties (Miami-Dade, Broward, Palm Beach, and Hillsborough)
combined.
Florida Department of Health in Orange County ||11
2015 Orange County Community Health Assessment
MORTALITY: LEADING CAUSES OF DEATH
The leading causes of death are ranked as follows for Orange County, Florida, and the United States36
:
All rates discussed in this section are the age-adjusted death rate per 100,000 residents in the population. This
makes it possible to compare counties with different demographic compositions. Often, the 3-year-rolling rate
is used instead of single years, as this elucidates overall trends without being affected by a single-year extreme
rate. Years of Potential Life Lost (YPLL) are for every 100,000 residents under the age of 75. The summary view
at the beginning of each section highlights important information, including the cause-specific mortality rate,
the overall trend for the past 15 years, a comparison of Orange County to the rest of the state and county, and
any differences (“disparities”) that exist between genders, races, ethnicities, or age groups. The group with a
Rank Orange County37
Florida38
United States39
1 Cancer Cancer Heart Disease
2 Heart Disease Heart Disease Cancer
3 Unintentional Injuries
Chronic Lower Respiratory
Disease (CLRD)
Chronic Lower Respiratory
Disease (CLRD)
4 Stroke Stroke Unintentional Injuries
5
Chronic Lower Respiratory
Disease (CLRD)
Unintentional Injuries Stroke
6 Diabetes Mellitus Diabetes Mellitus Alzheimer’s Disease
7 Alzheimer’s Disease Alzheimer's Disease Diabetes
8 Pneumonia/Influenza Kidney Disease Pneumonia/Influenza
9 Suicide Suicide Kidney Disease
10 Septicemia
Chronic Liver Disease and
Cirrhosis
Suicide
Florida Department of Health in Orange County ||12
2015 Orange County Community Health Assessment
higher rate of morbidity or mortality is highlighted in red. The explanation under the county snapshot provides
deeper detail and explanations or trends.
LEADING CAUSES OF DEATH
1. CANCER40
Cancer deaths in Orange County occur at a rate of 158.5 per 100,000 residents in the population. This is very
close to the average rate in the state of Florida (158.7 per 100,000 residents), and puts Orange County in the
second quartile of counties. This rate meets the national target for Healthy People 202041
. In the last 20 years,
the rate of cancer deaths has gone steadily downward. Cancer is responsible for the greatest Years of Potential
Life Lost (YPLL) for residents under age 75. Each year, it is estimated that 1,357.9 years of life are lost due to
cancers per 100,000 people in Orange County. Years of Potential Life Lost (YPLL) is a measure used to help
quantify the social and economic loss due to specific causes of death. It uses an estimate of how long the
person would have lived on average, if that individual had not died prematurely (in this case from cancer).
Men have a higher mortality rate due to cancers than women, although this gap between genders has been
growing increasingly narrow (from a difference of 93.3 per 100,000 in 1995 to 50.1 per 100,000 in 2013). In
Orange County, white people have a higher death rate due to cancer than blacks. This was true for the first
time in the year 1999; prior to 1999, blacks held the higher rate of cancer deaths. When comparing Hispanics
Cancer
Mortality
158.5
per 100,000
Trend
decreasing
Florida
Comparison
2nd quartile
historically higher,
recently similar
Healthy People
2020 Target:
met:
161.4
per 100,000
Disparities
Male vs. Female
White vs. Black
Non-Hispanic
vs. Hispanic
Over age 65
vs. under age 65
Florida Department of Health in Orange County ||13
2015 Orange County Community Health Assessment
and non-Hispanics, Hispanics have a much lower death rate, by 56.2 deaths per 100,000 residents. Cancer
disproportionately affects older Floridians, as the top risk factor for cancer is advancing age. In Florida, 18% of
the population is over the age of 65, but 70% of cancer deaths occur in this age group.
Lung cancer is responsible for a quarter of cancer deaths. Colorectal cancer accounts for 10% of total cancer
deaths, and breast cancer follows with 7% of cancer deaths. 42
Other cancer deaths result from (in order):
prostate cancer, non-Hodgkin’s lymphoma, bladder cancer, head and neck cancer, ovarian cancer, melanoma,
and cervical cancer.
2. HEART DISEASE43
Deaths due to heart disease occur at an annual rate of 148.1 per 100,000 in Orange County. Again, Orange
County ranks in the second quartile of counties. Orange County has historically had higher rates than the state,
but since 2009, the mortality rates due to heart disease have been similar. The state rate is 153.4 per 100,000.
This does not meet the Healthy People 2020 target of 103.4 deaths per 100,000 residents. This rate has declined
greatly since 1994, although it has begun to level off in the years since 2007. Men have a higher rate of death
due to heart disease than women; for every woman that dies of heart disease, 1.7 men die from the same
cause. This gap between men and women has been gradually getting worse for the past 20 years. Racial
differences also exist; black people historically have a higher death rate than whites, although this difference is
much more pronounced in Florida than in Orange County. These rates between blacks and whites have been
similar in Orange County since 2004. The state of Florida shows a much larger difference between the mortality
rate for blacks and whites. Mortality rates for black people in Orange County have actually been lower than
that of whites in the years 2011, 2012, and 2013.
Heart Disease
Mortality
148.1
per 100,000
Trend
decreasing
Florida
Comparison
2nd quartile
historically slightly
higher, recently
similar
Healthy People
2020 Target
not met:
103.4
per 100,000
Disparities
Male vs. Female
Non-Hispanic
vs. Hispanic
Over age 75
vs. under age 75
Florida Department of Health in Orange County ||14
2015 Orange County Community Health Assessment
Ethnic differences exist as well. Orange County non- Hispanic individuals suffer a higher mortality rate than
Hispanics. This difference is larger in Orange County than it is in the rest of the state.
3. UNINTENTIONAL INJURIES44
Statewide, rates of death from unintentional injuries increased from 1994-2005, and have been decreasing in
the years since. In Orange County, however, this rate has been relatively stable for the past 15 years, with the
2013 rate of 34.3 per 100,000 residents slightly lower than the state rate of 38.8 per 100,000. Orange County is
in the first quartile of counties for unintentional injuries death rate. Orange County has had a much lower rate
than the rest of the state every year since 2000. Orange Country’s mortality rate due to unintentional injuries is
lower than the Healthy People 2020 target.
Men have a higher rate of death due to unintentional injury than women, both statewide and in Orange
County. Non-Hispanics have a higher mortality rate than Hispanics, and whites have a higher mortality rate than
blacks. The elderly are at a much higher risk of mortality due to unintentional injury. Orange County residents
over the age of 75 years have a mortality rate more than three times higher than any other age group (10-year
increments), and this rate is increasing.
4. STROKE45
Orange County’s mortality rate due to stroke falls in the third quartile of counties in Florida. At 36.7 deaths per
100,000 residents, this is higher than the state rate of 31.3 per 100,000, and does not meet the Healthy People
2020 target rate. The rate in Orange County has shown a slight increase in each of the past 4 years, while the
state has been remaining constant. Black people have a higher mortality rate than white people. The difference
between races is larger in the state than in Orange County. Non-Hispanics have a greater mortality rate than
Hispanics, but this gap has been narrowing in recent years.
5. CHRONIC LOWER RESPIRATORY DISEASE (CLRD)46
Unintentional
Injuries Mortality
34.3
per 100,000
Trend
steady
Florida
Comparison
1st quartile
state decreasing
since 2007
Healthy People
2020 Target
met:
53.7
per 100,000
Disparities
Male vs. Female
Non-Hispanic
vs. Hispanic
White vs. Black
Over age 75
vs. under age 75
Stroke
Mortality
36.7
per 100,000
Trend
steady
Florida
Comparison
3nd quartile
Orange slightly
higher
Healthy People
2020 Target:
not met:
34.8
per 100,000
Disparities
Black vs. White
Non-Hispanics vs.
Hispanics
Over age 75 vs.
under age 75
Florida Department of Health in Orange County ||15
2015 Orange County Community Health Assessment
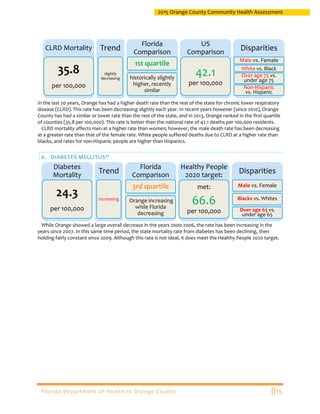
In the last 20 years, Orange has had a higher death rate than the rest of the state for chronic lower respiratory
disease (CLRD).This rate has been decreasing slightly each year. In recent years however (since 2010), Orange
County has had a similar or lower rate than the rest of the state, and in 2013, Orange ranked in the first quartile
of counties (35.8 per 100,000). This rate is better than the national rate of 42.1 deaths per 100,000 residents.
CLRD mortality affects men at a higher rate than women; however, the male death rate has been decreasing
at a greater rate than that of the female rate. White people suffered deaths due to CLRD at a higher rate than
blacks, and rates for non-Hispanic people are higher than Hispanics.
6. DIABETES MELLITUS47
While Orange showed a large overall decrease in the years 2000-2006, the rate has been increasing in the
years since 2007. In this same time period, the state mortality rate from diabetes has been declining, then
holding fairly constant since 2009. Although this rate is not ideal, it does meet the Healthy People 2020 target.
CLRD Mortality
35.8
per 100,000
Trend
slightly
decreasing
Florida
Comparison
1st quartile
historically slightly
higher, recently
similar
US
Comparison
42.1
per 100,000
Disparities
Male vs. Female
White vs. Black
Over age 75 vs.
under age 75
Non-Hispanic
vs. Hispanic
Diabetes
Mortality
24.3
per 100,000
Trend
increasing
Florida
Comparison
3rd quartile
Orange increasing
while Florida
decreasing
Healthy People
2020 target:
met:
66.6
per 100,000
Disparities
Male vs. Female
Blacks vs. Whites
Over age 65 vs.
under age 65
Florida Department of Health in Orange County ||16
2015 Orange County Community Health Assessment
Men have a higher mortality rate due to diabetes; this is true in Orange County and in the state of Florida.
Blacks have a higher rate of death than whites, and rates are similar between Hispanics and non-Hispanics.
7. ALZHEIMER’S DISEASE48
The mortality rate for Alzheimer’s disease in Orange County is 18.3 deaths per 100,000 people. This rate has
shown a slight decrease in the past 15 years. Orange County’s rate is consistently higher than that of the state
although this difference is getting smaller every year. This rate is below the national average of 23.5 deaths per
100,000 US residents. Within the county, females suffer a higher mortality rate than males. Whites have a
higher mortality rate than blacks, although the rate for whites has leveled off while blacks show an overall
increasing trend since the year 2000.
Alzheimer's
Mortality
18.3
per 100,000
Trend
steady
Florida
Comparison
3rd quartile
Orange higher
than state rate,
gap decreasing
US
Comparison
23.5
per 100,000
Disparities
Female vs. Male
Whites vs. Blacks
Over age 75 vs.
under age 75
Florida Department of Health in Orange County ||17
2015 Orange County Community Health Assessment
8. PNEUMONIA/INFLUENZA
The mortality rate due to Pneumonia and Influenza is 12.7 per 100,000. This is better than the national
average of 15.9 deaths per 100,000, but it places Orange County in the 3rd
quartiles of counties within Florida.
While deaths from pneumonia and influenza have decreased dramatically since the 1990’s, this rate has been
steady or slightly increasing in the years since 2007. This trend holds true for Orange County and the state of
Florida.
9. SUICIDE49
Orange County ranks 14th
of 67 counties for suicide mortality rate. Orange County’s rate of 10.1 per 100,000
means Orange is in the first quartile of Florida’s counties. The state average of 13.8 is consistently higher than
that of Orange County. Nationally, this meets the Healthy People 2020 target.
Men have a much higher rate of deaths due to suicide; more than double that of females. This rate has been
as high as five times the rate of females, but has been lower in recent years. Whites have a higher mortality
rate than blacks; this rate is approximately twice the rate of blacks. The actual counts of suicide mortalities are
relatively low: 122 deaths in 2013. This compares to 1,702 deaths from cancer in 2013.
10. SEPTICEMIA
Orange County ranks in the worst quartile for deaths due to septicemia. This rate is higher than the national
average of 10.7 deaths per 100,000 population. Black people are disproportionately affected, and the elderly
have a greater risk of death from septicemia. The cause-specific mortality rate for septicemia was low in the
early 1990’s, but increased sharply after 1998 and peaked in 2003 at 16.1 deaths per 100,000. In the years since,
this rate has slowly decreased, although it has not reached the levels seen 20 years ago
Mortality Rate
12.7
per 100,000
Trend
slight
increase
since
2007
Florida
Comparison
3rd quartile
Orange
consistently
slightly lower
US
Comparison
15.9
per 100,000
Disparities
Whites vs. Blacks
Non-Hispanic vs.
Hispanic
Suicide
Mortality
10.1
per 100,000
Trend
steady
Florida
Comparison
1st quartile
Orange's rate
consistently lower
than Florida
US
Comparison
target:
10.2
per 100,000
Disparities
Male vs. Female
Whites vs. Blacks
Septicemia
Mortality
11.1
per 100,000
Trend
slight
decrease
since
2003
Florida
Comparison
4th quartile
Orange decreasing
while state slightly
increasing
US
Comparison
10.7
per 100,000
Disparities
Blacks vs. Whites
Over age 75
vs. under age 75
Florida Department of Health in Orange County ||18
2015 Orange County Community Health Assessment
INFANT MORTALITY
In 2013, there were 15,829 births
to Orange County mothers. Of
these births, 119 infants died
within their first 365 days of life.
This is equivalent to a death rate
of 7.52 deaths per 1,000 births50
.
This rate is significantly higher
than expected, and is higher than
the state rate of 6.1 deaths per
1,000 live births. Orange County is
one of 9 counties with
significantly higher infant
mortality rates than expected.
Hillsborough is the only other peer
county with significantly higher
rates than expected. Broward,
Miami-Dade, and Palm Beach are 3
of 4 Florida counties with
significantly lower rates than expected. In this calculation, the expected rate was adjusted to control for
maternal race, marital status, and educational characteristics in each county.51
There are also significant disparities in infant mortality rates between races. In 2013, black infants were twice
as likely to die before their first birthday as white babies. Black babies are also more likely than white babies to
be stillborn. The graph above displays infant mortality rates per 1,000 births in Orange County and statewide,
from 1992 through 2013. The three-year rolling rate is used to smooth out the line by averaging any extreme
year, which makes it easier to identify overall trends. Fortunately, since 2006, the overall infant mortality rate
in Orange County has decreased by 1.0 death per 1,000 live births. The map below highlights census tracts with
a high density of infant deaths between 2006 and 2010. Many of these tracts correlate with vulnerable
populations. (Note: this map shows counts, not rates per residents.) Tracts with 10 or more deaths are labeled
with the actual number of infant deaths.
Florida Department of Health in Orange County ||19
2015 Orange County Community Health Assessment
Infant mortality is an informative and sensitive indicator of the health of the population, since the health of
an infant is dependent on the health of the entire population—not just the mother; but also the father,
families, and society. There are many risk factors that are associated with infant mortality, including: maternal
race, marital status, maternal education, maternal age, smoking status, nutrition, genetics, access to health
care, birth spacing, infections, chronic medical diseases, psychiatric conditions, environmental exposures,
stress, obesity, diabetes, and more. Modifiable risk factors are targets for improvement opportunities.
In addition, the rate of maternal deaths has been increasing over the past decade. The number of women
who die in childbirth is small (under 4 per year), so trends can be challenging to discern.52
MOTOR VEHICLE CRASHES AND PEDESTRIAN FATALITIES
Orange County has a lower fatality rate due to motor vehicular crashes than the rest of the state (9.8 deaths
per 100,000 residents, compared to a state rate of 12.1 per 100,000).53
This rate has been slowly declining since
2010. However, while the roads are getting safer for motorists, this does not hold true for pedestrians. Of all
metro areas in the United States with a population over 1 million people, the Orlando-Kissimmee metropolitan
area ranks first in the Pedestrian Danger Index, a measure of the relative likelihood that a person on foot will
be struck and killed by a motor vehicle.54
As the most dangerous place for pedestrians in the US, this means
that pedestrians in the Orlando-Kissimmee area suffer more fatalities, despite fewer people walking than other
areas in the nation. This 2014 ranking is based on five years of data, between 2008 and 2012. The state of
Florida is especially deadly for pedestrians; the four highest areas nationwide for pedestrian deaths are all in
Florida: Orlando-Kissimmee, Tampa-St. Petersburg-Clearwater, Jacksonville, and Miami-Fort Lauderdale-
Pompano Beach, respectively.
CRIME
Although the crime rate in
Orange County has been
slowly decreasing over time,
Orange is still among the
worst counties in Florida in
terms of crime. Orange has
been in the top four
counties with the highest
rate of crimes since 2009.55
The 2013 rate of 4,949.2
crimes per 100,000
population represents a 1.3%
decrease from 2012. (Crimes
included in this rate are:
murder, sexual offenses,
robbery, aggravated assault,
burglary, larceny, and motor
vehicle theft as reported to
law enforcement, not
arrests.) Violent crimes occur in Orange County at a rate of 690.1 crimes per 100,000 population. The graph to
the right illustrates the trend in crime rates for Orange County and its five peer counties, as well as the state
average, between 2009 and 2013.
Domestic violence offense rates for Orange County are in the 3rd
quartile of counties in Florida. There was an
average of 8,330 domestic violence offenses in Orange County between 2011 and 2013, a rate of 707.4 per
100,000, higher than the state average of 572.0 offenses per 100,000 individuals.
Additionally, Florida ranks third in the nation for human trafficking. This is primarily due to “tourism, influx of
foreign immigrants, sporting events, conventions, and transient population. Human trafficking is the 2nd most
lucrative criminal enterprise in the world.”56
Florida Department of Health in Orange County ||20
2015 Orange County Community Health Assessment
MORBIDITY (DISEASE INCIDENCE AND PREVALENCE)
MATERNAL AND CHILD HEALTH
BIRTH RATE, TEEN BIRTHS
Orange County has one of the highest birth rates in the state, with 13.2 live births per 1,000 residents. This is
the 6th
highest birth rate in the state, and highest among the peer counties. The teen birth rate in Orange
County is 6.3 births per 1,000 female teenagers, the same as the state rate. In 2013, there were 1,000 babies
born in Orange County to mothers under the age of 20 years.57
PRETERM AND LOW BIRTH WEIGHT
A pre-term birth is a birth before than 37 weeks gestation. The morbidity rate for preterm births in Orange
County is one of the worst in the state. In 2013, Orange ranked 3rd
worst in the rate of pre-term births, with
2,578 babies born in Orange County under 37 weeks of gestation. This represents a rate of 16.3 pre-term births
per 100,000 live births.58
The state average is 14.0 pre-term births per 100,000 births. There is a major disparity
in pre-term babies when comparing white and black populations, which is not unique to Orange County. The
rate for white babies in Orange County is 14.7 preterm births per 100,000 births compared to a rate in black
babies of 20.5 preterm per 100,000 births.
Between 2005 and 2011, in the state of Florida, 8.7% of babies were born at a low birthweight. During the
same time period in Orange County, 10,269 babies out of 112,892 were born at a low birthweight. This equals
9.1% of babies, a significantly higher proportion than the state average. Orange County and the state of Florida
fall short of the US national average of 8.1%.59
The map below displays the concentrations of babies born at a
low birth weight, by census tract. This percentage ranges throughout the county from a low of 0% to a high of
21.1% of all babies born at a low birth weight in a census tract in downtown Orlando (census tract 105, at the
northwest intersection of I-4 and SR 408. This tract is also one of the lowest-income sections in the county).
Florida Department of Health in Orange County ||21
2015 Orange County Community Health Assessment
CHRONIC DISEASES
CARDIOVASCULAR DISEASE
From 2010-2012, there were 4,104 Orange County hospitalizations due to Coronary Heart Disease, and an
additional 1,433 hospitalizations attributed to congestive heart failure. Both of these rates are higher than the
state age-adjusted rate, although the death rate for coronary heart disease is lower than the state’s. Strokes
attributed for 3,121 hospitalizations in the same time period, a rate that is again higher than the state average.
CANCER
Florida ranks second in the nation for newly diagnosed cancer cases. Annually, there are 100,000 new cancer
cases diagnosed in Florida, with 60% of these in people over the age of 65. Cancer occurrence differs by age,
sex, race, geography, and the stage of disease at the time of diagnosis. Cancer deaths are responsible for the
greatest Years of Potential Life Lost, and constitute an enormous financial burden as well; approximately $4
billion is spent annually for in-patient hospital care for cancers. 60
LUNG CANCER
Orange County is in the best quartile for rates of: death due to lung cancer, incidence of lung cancer, and
adults who are current smokers. Lung cancer incidence in Orange County was higher than the state rate during
the 1990s, but has been similar to or lower than the state average since 2000. Adults who report being current
smokers decreased between 2002 and 2010, from 21.4% to 13.3%, but increased to 16.0% in 2013. This is still
slightly lower than the state average of 16.8%.61
COLORECTAL CANCER
Orange County ranks low for the incidence and mortality due to colorectal cancer, when compared to the
rest of the state (4th
and 3rd
quartile, respectively). This may be a result of certain preventative behaviors, like:
adults over the age of 50 years who have received a colonoscopy or sigmoidoscopy in the past five years, and
adults over 50 years of age who have received a stool blood test in the past year. When asked about these
behaviors in 2013, less than half reported receiving a colonoscopy or sigmoidoscopy, and less than 9% reported
a stool blood test. These percentages are in the 4th
quartile statewide.
BREAST AND PROSTATE CANCER
Breast cancer was diagnosed in 664 Orange County residents between 2009 and 2011, and resulted in 122
deaths in 2011-2013. These rates are similar to or slightly higher than the state rates. Prostate cancer in Orange
County affects a larger proportion of men than in the rest of the state. In Orange County, 614 diagnoses and 76
deaths place Orange in the 4th
quartile for incidence and the 3rd
quartile for mortality.
DIABETES
Diabetes contributed to 34,509 hospitalizations in Orange County between 2010 and 2012. This is a rate of
3,258.9 hospitalizations per 100,000 residents, and places Orange County in the worst quartile in the state.
However, in a 2013 survey, only 10.3% of adults reported that they had ever been told they had diabetes, a rate
in the 2nd
quartile of the state, and lower than the state average of 11.2%. This may imply that Orange County
adults have a high rate of undiagnosed diabetes.
Florida Department of Health in Orange County ||22
2015 Orange County Community Health Assessment
ASTHMA
In 2013, 7.7% of adults reported that they currently have asthma, which is slightly lower than the state rate of
8.3% and in the second quartile of counties. However, Orange County is in the worst quartile in terms of asthma
hospitalizations, with 10,906 hospitalizations between 2010 and 2012. This discrepancy between diagnoses and
hospitalizations may mean that asthma is going undiagnosed, or that asthma is being poorly managed in
diagnosed individuals.
OVERWEIGHT AND OBESITY
Since 1980, the worldwide rate of
obesity has nearly doubled. Excess body
fat impairs health and can have many
long term consequences, including
placing the individual at increased risk
for: cardiovascular disease (including
heart disease and stroke), diabetes,
musculoskeletal disorders (especially
osteoarthritis), and some cancers
(endometrial, breast, colon). Children who are obese also face breathing difficulties, an increased risk of
fractures, hypertension, and early indicators of cardiovascular disease, insulin resistance, and physiological
effects.62
Excess body weight is measured by the body mass index (BMI), which is an individual’s weight (in
kilograms) divided by the square of their height (in meters). A BMI of 25 or greater is considered overweight,
and a BMI greater than 30 is classified as obese.
It is estimated that 29.7% of the US population is obese in 201463
. In Florida, this proportion is slightly lower, at
26.4%. Only 36% of Floridians are at a healthy weight. If the current trends continue, 60% of the state will be
obese by 2030. In the next 20 years, obesity is expected to contribute to millions of cases of preventable
chronic diseases, resulting in an estimated $34
billion of healthcare costs in the state of
Florida64
.
Promisingly, 2013 was the first year since
2002 (when data collection began), that a
higher percentage of adults reported a
healthy weight, when compared to the
previous survey (36.3% in 2013, up from 34.6%
in 2010). This trend is also true for the Florida
state average.
Based on 2013 data, it is estimated that
36.2% of adults in Orange County are
overweight, and an additional 25.0% are
obese65
. Overall, this means that 61.2% of all
adults in Orange County are above a healthy
weight. This places Orange County in the 1st
quartile when compared to the rest of the
counties in Florida. Of the overall Orange
County population, an estimated 68.8% of
men and 53.8% of women are overweight or
obese.
While there are no significant differences in
overweight and obesity rates when looking at
ethnic groups as a whole, differences emerge
when these populations are further broken
down by gender. Black females have a
Orange County
Obesity Rate:
25%
(14th best in
state)
Florida
Obesity Rate:
26.4%
(13th best in
U.S)
United States
Obesity Rate:
29.7%
Florida Department of Health in Orange County ||23
2015 Orange County Community Health Assessment
significantly higher rate of obesity and overweight than white (non-Hispanic) females.66
While there are no
statistically significant differences between males of different ethnicities, there are significant differences
between white, non-Hispanic males and white, non-Hispanic females.
In Orange County, adults who are between the ages of 45 and 64 years of age have the highest rate of
overweight/obesity (55.6%), followed by adults older than 65 years (66.3%), and adults 18-44 years (55.6%).
Twenty-four percent of Florida adults are physically inactive. In Orange County, between 22 and 26% of adults
report physical inactivity67
. Only 79% of Orange County residents report access to exercise opportunities. While
this is slightly higher than the state average of 78%, it is lower than all other comparable counties (Broward-
94%, Miami-Dade- 94%, Hillsborough- 87%, and Palm Beach- 87%).68
Adults in Orange County consume more vegetables than the state and country average. Adults report a
slightly lower level of physical activity in Orange County when compared to United States, and the rate is
similar to the rest of the state.69
HEALTH BEHAVIORS (BRFSS RESULTS)
The Behavioral Risk Factor Surveillance Survey (BRFSS) was conducted statewide in 2002, 2007, 2010, and
most recently, in 2013. Orange County residents reported several characteristics that were significantly
different than the overall state results. Strengths of Orange County (in which Orange performed significantly
better than the state average) are:
 Low percentage of adults who have ever been told they had chronic obstructive pulmonary disease,
emphysema, or chronic bronchitis
 Low percentage of adults who have ever been told they had any other type of cancer except skin
cancer
 Low percentage of adults who have ever been told they had high blood cholesterol
 Low percentage of adults who have ever been told they had coronary heart disease, heart attack, or
stroke
 High percentage of adults who have never smoked
Areas in which Orange County scored significantly worse than the state average are:
 Low percentage of adults who received a flu shot in the past year
 Low percentage of adults who had a medical checkup in the past year
 Low percentage of adults who have a personal doctor
Florida Department of Health in Orange County ||24
2015 Orange County Community Health Assessment
INFECTIOUS DISEASES
Orange County is plagued by higher than average rates of communicable and infectious diseases. When
compared to the rest of the state, Orange ranks in the worse quartile for Human Immunodeficiency Virus (HIV)
cases reported, Acquired Immunodeficiency Syndrome (AIDS) cases reported, HIV/AIDS adjusted death rate,
tuberculosis (TB) cases reported, chlamydia cases reported, gonorrhea cases reported, and infectious syphilis
cases reported70
. Orange County is in the 3rd
quartile for rates of vaccine preventable diseases. Although the
statistics are dire, trends in recent years have shown most of these rates are improving, with the exception of
new cases of chlamydia and infectious syphilis.
HIV/AIDS
In 2011 (most recent year national data is available), Florida ranked second in new Human Immunodeficiency
Virus (HIV) infection cases, and 3rd
in HIV infection rates per 100,000, with a total of 5,408 cases, representing
28.4 HIV cases per 100,000 residents. Florida ranks 3rd
in the estimated number of Acquired Immune Deficiency
Syndrome (AIDS) diagnosed in 2011 and 4th
in the rate. There were 3,440 new cases of AIDS, or 18.1 cases per
100,000 residents in 2011.
In Orange County, there were 470 new cases of HIV diagnosed in 2013, which is the third highest county in the
state. Orange also ranked highly in terms of AIDS diagnoses, with 310 new cases in 2013. 71
There are an
estimated 9,977 people living with HIV/AIDS in the Orlando Eligible Metropolitan Area in 2013. An estimated
39.2% of these cases are black, with 35.7% white, and 23.1% Hispanic. Almost 75% of people living with HIV/AIDS
are male.
SEXUALLY TRANSMITTED DISEASES
Orange is in the worst quartile for Sexually Transmitted Diseases (STDs). A 3 year rate of 707.4 cases per
100,000 residents is much higher than the state rate of 522.3 per 100,000 for the same time period. Orange
ranks in the worst quartile for rates of each of the following STDs: chlamydia, gonorrhea, and infectious
syphilis.
Orange County has 571.1 cases of chlamydia for every 100,000 people. This rate is higher than the rest of the
state (419.1 per 100,000). This is also higher than all neighboring and peer counties.72
This rate has been getting
steadily worse since 1998.
Gonorrhea cases in Orange County affect 159.6 residents per 100,000. This rate is higher than the state
average of 109.1 cases per 100,000 residents. There are only 5 counties with worse rates than Orange, and
Orange is the worst of the metropolitan counties. Unlike chlamydia cases, gonorrhea cases have been
generally decreasing. However, in 2013, the rate increased from the previous year, the first year-to-year
increase since 2005.
Orange also has higher than average cases of infectious syphilis, ranking 5th
in the state with a rate of 11.9 per
100,000 residents. The state average is 7.3 per 100,000. The rate of infectious syphilis has increased five-fold
since 1995.
TUBERCULOSIS
Orange County has the 3rd
highest rate of tuberculosis cases in Florida, trailing behind Miami Dade and
Broward. Orange is second in the state for tuberculosis deaths.73
Florida Department of Health in Orange County ||25
2015 Orange County Community Health Assessment
HEALTH INEQUITIES
MINORITY PROFILE: BLACK POPULATION74
Orange County has a higher percentage of Black residents than the rest of the state (21.7% in Orange County
vs. 16.5% statewide). Black individuals in Orange County are more likely to be below the poverty level, more
likely to be unemployed, and less likely to have a high school diploma. Black residents report a lower rate of
excellent overall health, and are less likely to have health care insurance coverage.
Blacks have a higher mortality rate than whites due to stroke, colorectal cancer, and breast cancer. White
individuals have a higher mortality rate due to coronary heart disease, lung cancer, and cancer overall. Black
women over the age of 40 years old are less likely to have received a mammogram and less likely to be
diagnosed with breast cancer, but suffer higher mortality rates due to breast cancer than white women. Black
adults over the age of 50 years are less likely to have had a sigmoidoscopy or colonoscopy, but had a higher
mortality rate due to colorectal cancer than their white counterparts. Black residents of Orange County are
hospitalized for congestive heart failure at a higher rate than white, yet have similar mortality rates. Black
adults are also more likely to have had a heart attack, but die from coronary heart disease at a lower rate than
white adults.
The teen pregnancy rate is higher in black teenagers than white, and babies are born to black unwed mothers
at a higher rate than white mothers. Expectant black mothers have a lower rate than whites of 1st
trimester
prenatal care, with more than twice the rate of black mothers receiving no prenatal care at all. Black mothers
are less likely to initiate breastfeeding, and more likely to have babies with less than 18 months between
pregnancies. Black mothers are 1.5 times more likely to deliver a preterm baby, 2 times more likely to deliver a
low birth weight baby, and 2.6 times more likely to deliver a baby with a very low birth weight. Black mothers
suffer more than double the rate of fetal deaths and infant deaths than white mothers.
Black residents of Orange County die from 3 times as many homicides as their white counterparts, and are
hospitalized for non-fatal firearms-related injuries more than 6 times as often. Blacks have a lower rate of
suicides, traumatic brain injury deaths, and hospitalizations for motor vehicle related injuries and non-fatal
unintentional falls.
MINORITY PROFILE: HISPANIC POPULATION75
Hispanic people make up 27.7% of the populace in Orange County, which is higher than the state average of
23.2%. Compared to non-Hispanic residents in Orange County, Hispanic residents are more than twice as likely
to be living in poverty. Hispanics also have a higher rate of unemployment and are more than 3x less likely to
have a high school diploma than their non-Hispanic neighbors. They are more likely to be hospitalized or visit
the ER due to asthma, and are less likely to have a personal doctor or health insurance. They report more often
than non-Hispanics that the cost is prohibitive for them to see a doctor, and they are less likely to state that
they are in “good to excellent” overall health.
Despite lower socioeconomic status, the health of Hispanics is frequently better than non-Hispanics. Hispanic
individuals in Orange County die less frequently than their non-Hispanic counterparts due to: coronary heart
disease, stroke, congestive heart failure, AIDS, and cancer (including lung cancer, colorectal cancer, breast
cancer, prostate cancer, and cervical cancer). They are slightly more likely to die of diabetes, even though there
is a lower percentage of Hispanics with diagnosed diabetes. Hispanics have similar rates as non-Hispanics for
hospitalizations due to congestive heart failure, but are less likely to die from it. They are also much less likely
to have had a heart attack or stroke. Hispanics are less likely than non-Hispanics to have had preventative
screenings for colorectal cancer or breast cancer, and are less likely to report having had their cholesterol
checked in the previous five years. Hispanics have a higher rate of overweight, but similar rates of obesity.
Hispanics are less likely to engage in regular moderate activity, but also less likely to be current smokers.
Hispanics have more favorable birth outcomes than non-Hispanics, with fewer fetal and infant deaths, and
lower rates of low birth weight infants. Hispanics and non-Hispanics have similar rates of preterm babies.
Hispanic populations have a higher rate of teenage births, and a higher birth rate for mothers between the
ages of 20 and 54 years. Hispanics have a higher rate of obesity, and expectant Hispanic mothers have a slightly
higher rate of overweight and obesity at the time pregnancy occurred. Hispanics initiate breastfeeding more
often than non-Hispanic mothers, but are slightly less likely to receive prenatal care.
Florida Department of Health in Orange County ||26
2015 Orange County Community Health Assessment
COUNTY HEALTH RANKINGS 2015
In the 2015 release of County Health Rankings, Orange County ranked 13th
of 67 counties in terms of health
outcomes and 18th
in health factors. 76
Health outcome rankings are a combination of measures for length of
life and quality of life. Orange County ranked 9th
for length of life, but 24th
for quality of life. This is due to poor
rates of low birthweight infants, and average rates for individuals reporting poor or fair health, and the
average count of poor physical and mental health days. Orange County’s Years of Potential Life Lost has been
decreasing since 1997, signifying that fewer preventable deaths are occurring.
The Health Factors ranking (next page) includes measures for health behaviors, clinical care, social and
economic factors, and physical environment. While Orange ranks highly for health behaviors, average scores
for clinical care and physical environment places Orange in the second quartile overall for health factors. Please
see the table below for complete details.
Orange
County
Top US
Performers Florida Rank (of 67)
Health Outcomes 13
Length of Life 9
Premature death 6,251 5,200 6,893
Quality of Life 24
Poor or fair health 15% 10% 16%
Poor physical health days 3.3 2.5 3.7
Poor mental health days 3.2 2.3 3.8
Low birthweight 9% 5.9% 8.7%
Florida Department of Health in Orange County ||27
2015 Orange County Community Health Assessment
Orange
County
Top US
Performers Florida Rank (of 67)
Health Factors 18
Health Behaviors 10
Adult smoking 15% 14% 18%
Adult obesity 25% 25% 26%
Food environment index 6.8 8.4 7
Physical inactivity 23% 20% 23%
Access to exercise opportunities 98% 92% 93%
Excessive drinking 16% 10% 16%
Alcohol-impaired driving deaths 29% 14% 29%
Sexually transmitted infections 529 138 402
Teen births 35 20 36
Clinical Care 33
Uninsured 24% 11% 24%
Primary care physicians 1,280:1 1,045:1 1,423:1
Dentists 2,248:1 1,377:1 1,874:1
Mental health providers 591:1 386:1 744:1
Preventable hospital stays 65 41 59
Diabetic monitoring 84% 90% 85%
Mammography screening 62.3% 70.7% 67.7%
Social & Economic Factors 20
High school graduation 74% 75%
Some college 65.7% 71% 60.1%
Unemployment 6.8% 4% 7.2%
Children in poverty 26% 13% 25%
Income inequality 4.5 3.7 4.6
Children in single-parent
households 39% 20% 38%
Social associations 7.2 22 7.3
Violent crime 730 59 514
Injury deaths 53 50 69
Physical Environment 33
Air pollution - particulate matter 10.9 9.5 11.4
Drinking water violations 0% 0% 6%
Severe housing problems 25% 9% 22%
Driving alone to work 80% 71% 80%
Long commute - driving alone 38% 15% 38%
Florida Department of Health in Orange County ||28
2015 Orange County Community Health Assessment
REFERENCES
1. Orange County Florida Government. About Us. (2014). Retrieved December 10, 2014, from
http://www.orangecountyfl.net/?tabid=120
2. Florida CHARTS. Orange County Health Profile. (2014). Retrieved December 10, 2014, from
http://www.floridacharts.com/charts/mapp_report.aspx: 2012 data
3. Office of Economic and Demographic Research. Orange County. (2014, February 21). Retrieved December 17, 2014,
from http://edr.state.fl.us/content/area-profiles/county/Orange.pdf
4. U.S. Census Bureau. Resident Population Data (Text Version). (2012). Retrieved December 10, 2014, from
http://www.census.gov/2010census/data/apportionment-dens-text.php
5. County Health Rankings & Roadmap. Florida Rankings Data. (2014). Retrieved December 10, 2014, from
http://www.countyhealthrankings.org/rankings/data/fl : Census Population Estimates, 2010 data
6. Clarke, S. (2013, June 13). Orlando tourism visitor count hits record for 3rd year. Retrieved December 10, 2014 from
http://articles.orlandosentinel.com/2013-06-13/business/os-orlando-record-year-20130613_1_visit-orlando-george-
aguel-head-count
7. Division of Public Health Statistics and Performance Management, Florida Department of Health. Orange County
Health Profile. (2014). Retrieved December 10, 2014, from http://www.floridacharts.com/charts/mapp_report.aspx :
2012 data
8. Office of Economic and Demographic Research. Orange County. (2014, February 21). Retrieved December 10,
2014, from http://edr.state.fl.us/content/area-profiles/county/Orange.pdf
9. United States Census Bureau. 2008-2012 American Community Survey. Retrieved December 10, 2014, from
http://factfinder2.census.gov/faces/tableservices/jsf/pages/productview.xhtml?src=bkmk
10.
http://www.healthdata.org/sites/default/files/files/county_profiles/US/County_Report_Orange_County_Florida.pdf
11. U.S. Census Bureau. 2010 Census Data. (2012). Retrieved December 10, 2014, from
http://www.census.gov/2010census/data/
12. DATA (used in pie charts) from County Health Rankings & Roadmap. Florida Rankings Data. (2014). Retrieved
December 10, 2014, from http://www.countyhealthrankings.org/rankings/data/fl : Census Population Estimates, 2012
data.
13. County Health Rankings & Roadmap. Florida Rankings Data. (2014). Retrieved December 10, 2014, from
http://www.countyhealthrankings.org/rankings/data/fl : American Community Survey, 5-year estimates, 2008-2012 data
14. Orange County Florida Government. About Us. (2014). Retrieved December 10, 2014, from
http://www.orangecountyfl.net/?tabid=120
15. County Health Rankings & Roadmap. Florida Rankings Data. (2014). Retrieved December 10, 2014, from
http://www.countyhealthrankings.org/rankings/data/fl : HUD, Comprehensive Housing Affordability Strategy, 2006-
2010 data
16. Office of Economic and Demographic Research. Orange County. (2014, February 21). Retrieved December 10,
2014, from http://edr.state.fl.us/content/area-profiles/county/Orange.pdf
17. Statistically significant at a 90% confidence level for both high school graduation and bachelor’s degree
attainment.
18. Office of Economic and Demographic Research. Orange County. (2014, February 21). Retrieved December 10,
2014, from http://edr.state.fl.us/content/area-profiles/county/Orange.pdf
19. Florida Department of Economic Opportunity. Local Area Unemployment Statistics. Retrieved December 10,
2014, from http://www.floridajobs.org/labor-market-information/data-center/statistical-programs/local-area-
unemployment-statistics
20. Florida Department of Economic Opportunity. Employment Projections. Retrieved December 10, 2014, from
http://www.floridajobs.org/labor-market-information/data-center/statistical-programs/employment-projections
21. Orlando Economic Development Commission. (2014). Orange County: About the Region. Retrieved December 18,
2014 from http://www.orlandoedc.com/Why-Orlando/About-the-Region/Orange-County.aspx
22. Orlando Economic Development Commission. (November 2014). Employment by Industry: Orlando MSA.
Retrieved December 19, 2014 from: http://www.orlandoedc.com/MetroOrlando/media/Metro-Orlando/Data-
Center/workforce/Employment-by-Industry.pdf?ext=.pdf
23. U.S. Census Bureau. Interactive SAIPE Data and Mapping Tool. (2014). Retrieved March 17, 2015, from
http://www.census.gov/did/www/saipe/data/interactive/#view=StateAndCounty&utilBtn=CSV&yLB=0&stLB=10
Florida Department of Health in Orange County ||29
2015 Orange County Community Health Assessment
&cLB=0&dLB=0&gLB=0&usSts_cbSelected=false&usTot_cbSelected=true&stateTot_cbSelected=true&pLB=0&multi
YearSelected=false&multiYearAlertFlag=false&prStateFlag=false&invalidSDYearsFlag=false
24. 90% confidence level, based on 2013 data
25. U.S. Census Bureau. Interactive SAIPE Data and Mapping Tool. (2014). Retrieved December 10, 2014, from
http://www.census.gov/did/www/saipe/data/interactive/#view=StateAndCounty&utilBtn=CSV&yLB=0&stLB=10
&cLB=0&dLB=0&gLB=0&usSts_cbSelected=false&usTot_cbSelected=true&stateTot_cbSelected=true&pLB=0&multi
YearSelected=false&multiYearAlertFlag=false&prStateFlag=false&invalidSDYearsFlag=false
26. 90% Confidence Intervals- Orange County: (16.8, 19.4), United States: (15.8, 16.0)
27. U.S. Census Bureau. Interactive SAIPE Data and Mapping Tool. (2014). Retrieved December 16, 2014, from
http://www.census.gov/did/www/saipe/data/interactive/#view=StateAndCounty&utilBtn=CSV&yLB=0&stLB=10
&cLB=0&dLB=0&gLB=0&usSts_cbSelected=false&usTot_cbSelected=true&stateTot_cbSelected=true&pLB=0&multi
YearSelected=false&multiYearAlertFlag=false&prStateFlag=false&invalidSDYearsFlag=false
28. 90% Confidence Level
29. County Health Rankings & Roadmap. Florida Rankings Data. (2014). Retrieved December 10, 2014, from
http://www.countyhealthrankings.org/rankings/data/fl : National Center for Education Statistics, 2011 data
30. County Health Rankings & Roadmap. Florida Rankings Data. (2014). Retrieved December 10, 2014, from
http://www.countyhealthrankings.org/rankings/data/fl
31. County Health Rankings & Roadmap. Florida Rankings Data. (2014). Retrieved December 10, 2014, from
http://www.countyhealthrankings.org/rankings/data/fl : Small Area Health Insurance Estimates, 2011 data
32. County Health Rankings & Roadmap. Florida Rankings Data. (2014). Retrieved December 10, 2014, from
http://www.countyhealthrankings.org/rankings/data/fl
33. County Health Rankings & Roadmap. Florida Rankings Data. (2014). Retrieved December 10, 2014, from
http://www.countyhealthrankings.org/rankings/data/fl
34. Council on Homelessness, Department of Children and Families. (June, 2013). Council on Homelessness 2013
Report. Retrieved December 18, 2014 from
http://www.dcf.state.fl.us/programs/homelessness/docs/2013CouncilReport.pdf
35. The U.S. Department of Housing and Urban Development, Office of Community Planning and Development. The
2013 Annual Homeless Assessment Report (AHAR) to Congress: Part 1 Point-in-Time Estimates of Homelessness.
Retrieved December 18, 2014 from https://www.hudexchange.info/resources/documents/ahar-2013-part1.pdf
36. Ranking based on total number of deaths, not mortality rate per 100,000.
37. Office of Health Statistics and Assessment, Florida Department of Health. Orange County Major Causes of Death
for 2013. Retrieved March 27, 2015, from
http://www.floridacharts.com/charts/DisplayHTML.aspx?ReportType=7226&County=48&year=2013&tn=33
38. Office of Health Statistics and Assessment, Florida Department of Health. Florida Major Causes of Death for 2013.
Retrieved March 17, 2015, from
http://www.floridacharts.com/charts/DisplayHTML.aspx?ReportType=7226&County=69&year=2013&tn=33
39. National Center for Health Statistics, Centers for Disease Control and Prevention. 10 Leading Causes of Death by
Age Group, United States 2012. Retrieved March 18, 2014 from http://www.cdc.gov/nchs/fastats/leading-causes-of-
death.htm
40. Office of Health Statistics and Assessment, Florida Department of Health. Orange County: All Cancers Deaths,
retrieved December 17, 2014 from
http://www.floridacharts.com/charts/DataViewer/DeathViewer/DeathViewer.aspx?indNumber=0097
41. Healthy People 2020. 2020 Topics & Objectives. Retrieved March 18,2015 from
http://www.healthypeople.gov/2020/topicsobjectives2020/default
42. Florida Department of Health. Florida Annual Cancer Report, 2011. Retrieved January 7, 2015 from
http://fcds.med.miami.edu/inc/annual/2011/Table_No_T16_(2011).pdf
43. Office of Health Statistics and Assessment, Florida Department of Health. Orange County: Heart Disease Deaths,
retrieved December 29, 2014 from
http://www.floridacharts.com/charts/DataViewer/DeathViewer/DeathViewer.aspx?indNumber=0098
44. Office of Health Statistics and Assessment, Florida Department of Health. Orange County: Unintentional Injuries
Deaths, retrieved December 30, 2014 from
http://www.floridacharts.com/charts/DataViewer/DeathViewer/DeathViewer.aspx?indNumber=0109
45. Office of Health Statistics and Assessment, Florida Department of Health. Orange County: Stroke Deaths,
retrieved January 5, 2015 from
http://www.floridacharts.com/charts/DataViewer/DeathViewer/DeathViewer.aspx?indNumber=0086
Florida Department of Health in Orange County ||30
2015 Orange County Community Health Assessment
46. Office of Health Statistics and Assessment, Florida Department of Health. Orange County: Chronic Lower
Respiratory Disease (CLRD) Deaths, retrieved January 3, 2015 from
http://www.floridacharts.com/charts/DataViewer/DeathViewer/DeathViewer.aspx?indNumber=0088
47. Office of Health Statistics and Assessment, Florida Department of Health. Orange County: Diabetes Deaths,
retrieved January 2, 2015 from
http://www.floridacharts.com/charts/DataViewer/DeathViewer/DeathViewer.aspx?indNumber=0090
48. Office of Health Statistics and Assessment, Florida Department of Health. Orange County: Alzheimer’s Disease
Deaths, retrieved January 5, 2015 from
http://www.floridacharts.com/charts/DataViewer/DeathViewer/DeathViewer.aspx?indNumber=0349
49. Office of Health Statistics and Assessment, Florida Department of Health. Orange County: Suicide (All Means)
Deaths, retrieved January 5, 2015 from
http://www.floridacharts.com/charts/DataViewer/DeathViewer/DeathViewer.aspx?indNumber=0116
50. Office of Health Statistics and Assessment, Florida Department of Health. Orange County: Infant Deaths,
retrieved March 18, 2015 from
http://www.floridacharts.com/charts/DataViewer/InfantDeathViewer/InfantDeathViewer.aspx?indNumber=0053
51. Significance is at the .05 level, taken from Florida Department of Health’s report “Infant mortality and low birth
weight actual rates compared to expected rates by county for Florida 2013”, retrieved March 26, 2015 from
http://www.floridahealth.gov/diseases-and-conditions/infant-mortality-and-adverse-birth-
outcomes/data/expectedvsactual2013.pdf
52 Office of Health Statistics and Assessment, Florida Department of Health. Orange County: Maternal Deaths,
retrieved March 31, 2015
http://www.floridacharts.com/charts/DataViewer/InfantDeathViewer/InfantDeathViewer.aspx?indNumber=0392
53. Division of Public Health Statistics and Performance Management, Florida Department of Health. Orange
County: Deaths from Motor Vehicle Crashes, retrieved March 25, 2015 from
http://www.floridacharts.com/charts/InjuryAndViolence/
54. Smart Growth America. “Dangerous by Design 2014- Regional Data”. Retrieved March 25, 2015 from
http://www.smartgrowthamerica.org/research/dangerous-by-design/dbd2014/regional-data.
55. Florida Department of Law Enforcement. “UCR Offense Data”. Retrieved March 25, 2015 from
http://www.fdle.state.fl.us/Content/getdoc/8c4ed844-de81-4551-a10e-7eb31e76def0/UCR-Offense-Data.aspx
56. Orange County Head Start Division, Administration for Children and Families, U.S. Department of Health and
Human Services. 2014 Community Assessment (Update). Retrieved December 18, 2014 from
http://www.orangecountyfl.net/Portals/0/resource%20library/families%20-%20health%20-
%20social%20svcs/Community%20Assessment.pdf
57. Office of Health Statistics and Assessment, Florida Department of Health. Orange County: Total Resident Live
Births, retrieved March 27, 2015 from
http://www.floridacharts.com/charts/DataViewer/BirthViewer/BirthViewer.aspx?cid=0025
58. Office of Health Statistics and Assessment, Florida Department of Health. Orange County: Preterm Births,
retrieved March 18, 2015 from
http://www.floridacharts.com/charts/DataViewer/BirthViewer/BirthViewer.aspx?cid=0473
59. County Health Rankings & Roadmap. Florida Rankings Data. (2014). Retrieved December 10, 2014, from
http://www.countyhealthrankings.org/rankings/data/fl : National Center for Health Statistics, 2005-2011 data
60. http://www.floridahealth.gov/diseases-and-conditions/cancer/_documents/florida-cancer-plan.pdf
61. Florida Department of Health Orange County, Florida: Chronic Disease Profile. Retrieved March 27, 2015 from
http://www.floridacharts.com/charts/DisplayHTML.aspx?ReportType=7244&County=48&year=2013&tn=32
62. World Health Organization. Obesity and overweight. (2014, August). Retrieved December 10, 2014, from
http://www.who.int/mediacentre/factsheets/fs311/en/
63. America’s Health Rankings, United Health Foundation. Obesity in the United States. Retrieved December 17,
2014 from http://www.americashealthrankings.org/ALL/Obesity
64. Florida Department of Health. Healthiest Weight. (2014, April 25). Retrieved December 10, 2014, from
http://www.healthiestweightflorida.com/
65. Division of Public Health Statistics and Performance Management, Florida Department of Health. Orange
County-State Profile. (2014). Retrieved December 10, 2014, from
http://www.floridacharts.com/charts/SpecReport.aspx?RepID=7200&tn=25 : 2012 data
66. Chronic Disease Section, Bureau of Epidemiology, Division of Disease Control and Health Protection, Florida
Department of Health. 2010 Orange County, Florida Communities Putting Prevention to Work (CPPW) Behavioral Risk
Factor Surveillance System (BRFSS) Data Report. Retrieved December 17, 2014 from
Florida Department of Health in Orange County ||31
2015 Orange County Community Health Assessment
http://www.floridahealth.gov/statistics-and-data/survey-data/cppw/orange-cppw/_documents/2010-orange-
report.pdf
67. County Health Rankings & Roadmap. Florida Rankings Data. (2014). Retrieved December 10, 2014, from
http://www.countyhealthrankings.org/rankings/data/fl : National Center for Chronic Disease Prevention and Health
Promotion, 2010 data
68. County Health Rankings & Roadmap. Florida Rankings Data. (2014). Retrieved December 10, 2014, from
http://www.countyhealthrankings.org/rankings/data/fl : OneSource Global Business Browser, Delorme map data, ESRI,
and US Census Tigerline Files, 2010 and 2012 data
69
Community Commons Community Health Needs Assessment Report produced March 31, 2105. Accessible via
http://assessment.communitycommons.org/CHNA/OpenReport.aspx?id=165775
70. Florida CHARTS. Orange County-State Profile. (2014). Retrieved December 10, 2014, from
http://www.floridacharts.com/charts/SpecReport.aspx?RepID=7200&tn=25 : 2012 data
71. Florida Department of Health, Division of Disease Control and Health Protection. “Florida HIV/AIDS Annual
Report 2013”. Retrieved March 27, 2015 from http://www.floridahealth.gov/diseases-and-
conditions/aids/surveillance/epi-profiles/HIVAIDS-annual-morbidity-2013.pdf
72. Florida Department of Health. Florida CHARTS. “Chlamydia Cases”. Retrieved March 27, 2015 from
http://www.floridacharts.com/Charts/OtherIndicators/NonVitalIndNoGrpDataViewer.aspx?cid=0145
73. Florida Department of Health. Florida CHARTS. Tuberculosis Cases and Deaths. Retrieved March 27, 2015 from
http://www.floridacharts.com/Charts/OtherIndicators/NonVitalIndNoGrpDataViewer.aspx?cid=0148
74. All data is from 2007-2012 and is taken from Florida Department of Health. Florida CHARTS. “Orange County,
Florida Minority Health Profile-Black”. Retrieved March 27, 2015 from
http://www.floridacharts.com/Charts/MinorityReport.aspx?ProfileYear=2012&county=48&tn=424
75. All data is from 2007-2012 and is taken from Florida Department of Health. Florida CHARTS. “Orange County,
Florida Minority Health Profile-Hispanic”. Retrieved March 31, 2015 from
http://www.floridacharts.com/charts/MinorityReportHisp.aspx?ProfileYear=2012&county=48&tn=425
76. County Health Rankings & Roadmap. Florida Rankings Data. (2015). Retrieved March 31, 2015, from
http://www.countyhealthrankings.org/rankings/data/fl.

More Related Content

What's hot

Public Relations Strategy
Public Relations StrategyPublic Relations Strategy
Public Relations Strategyaccld2015
 
9/9 FRI 9:30 | Planning & the LGBT Community in Florida 1
9/9 FRI 9:30 | Planning & the LGBT Community in Florida 19/9 FRI 9:30 | Planning & the LGBT Community in Florida 1
9/9 FRI 9:30 | Planning & the LGBT Community in Florida 1APA Florida
 
Concept note regional youth forum eng
Concept note regional youth forum engConcept note regional youth forum eng
Concept note regional youth forum engMario Naranjo
 
Latino degree-attainment
Latino degree-attainment Latino degree-attainment
Latino degree-attainment EducationNC
 
Chapter 4. discrimination in american society
Chapter 4. discrimination in american societyChapter 4. discrimination in american society
Chapter 4. discrimination in american societyALMA HERNANDEZ, JD, LMSW
 
Black degree-attainment
Black degree-attainment Black degree-attainment
Black degree-attainment EducationNC
 
How representative is congress
How representative is congressHow representative is congress
How representative is congressaquinaspolitics
 
Uacdc 2012 non profit summit
Uacdc 2012 non profit summitUacdc 2012 non profit summit
Uacdc 2012 non profit summitMUACDC
 
Best_Community_and_Organization_Report
Best_Community_and_Organization_ReportBest_Community_and_Organization_Report
Best_Community_and_Organization_ReportJerry Best
 
Blackbelt Renaissance Project-Powerpoint-Stegall-Master Thesis
Blackbelt Renaissance Project-Powerpoint-Stegall-Master ThesisBlackbelt Renaissance Project-Powerpoint-Stegall-Master Thesis
Blackbelt Renaissance Project-Powerpoint-Stegall-Master ThesisLaTrease Rutland Stegall
 
recruitingMilitaryTalent_white paper FINAL 2.29.16
recruitingMilitaryTalent_white paper FINAL 2.29.16recruitingMilitaryTalent_white paper FINAL 2.29.16
recruitingMilitaryTalent_white paper FINAL 2.29.16Kelvin Scott
 
Oct. 2014 civil beat poll full results
Oct. 2014 civil beat poll full resultsOct. 2014 civil beat poll full results
Oct. 2014 civil beat poll full resultsHonolulu Civil Beat
 
LotusHouseInterventionFinalPaper
LotusHouseInterventionFinalPaperLotusHouseInterventionFinalPaper
LotusHouseInterventionFinalPaperRoselaure Anstral
 

What's hot (20)

Public Relations Strategy
Public Relations StrategyPublic Relations Strategy
Public Relations Strategy
 
Magavern report ppg
Magavern report ppgMagavern report ppg
Magavern report ppg
 
9/9 FRI 9:30 | Planning & the LGBT Community in Florida 1
9/9 FRI 9:30 | Planning & the LGBT Community in Florida 19/9 FRI 9:30 | Planning & the LGBT Community in Florida 1
9/9 FRI 9:30 | Planning & the LGBT Community in Florida 1
 
Concept note regional youth forum eng
Concept note regional youth forum engConcept note regional youth forum eng
Concept note regional youth forum eng
 
Homelessness
HomelessnessHomelessness
Homelessness
 
Latino degree-attainment
Latino degree-attainment Latino degree-attainment
Latino degree-attainment
 
Chapter 4. discrimination in american society
Chapter 4. discrimination in american societyChapter 4. discrimination in american society
Chapter 4. discrimination in american society
 
Black degree-attainment
Black degree-attainment Black degree-attainment
Black degree-attainment
 
CCPHAPolicyAdvocacyPlaybook
CCPHAPolicyAdvocacyPlaybookCCPHAPolicyAdvocacyPlaybook
CCPHAPolicyAdvocacyPlaybook
 
How representative is congress
How representative is congressHow representative is congress
How representative is congress
 
AAPI Housing Data
AAPI Housing Data AAPI Housing Data
AAPI Housing Data
 
Education Oppression
Education OppressionEducation Oppression
Education Oppression
 
Uacdc 2012 non profit summit
Uacdc 2012 non profit summitUacdc 2012 non profit summit
Uacdc 2012 non profit summit
 
Best_Community_and_Organization_Report
Best_Community_and_Organization_ReportBest_Community_and_Organization_Report
Best_Community_and_Organization_Report
 
Blackbelt Renaissance Project-Powerpoint-Stegall-Master Thesis
Blackbelt Renaissance Project-Powerpoint-Stegall-Master ThesisBlackbelt Renaissance Project-Powerpoint-Stegall-Master Thesis
Blackbelt Renaissance Project-Powerpoint-Stegall-Master Thesis
 
recruitingMilitaryTalent_white paper FINAL 2.29.16
recruitingMilitaryTalent_white paper FINAL 2.29.16recruitingMilitaryTalent_white paper FINAL 2.29.16
recruitingMilitaryTalent_white paper FINAL 2.29.16
 
Oct. 2014 civil beat poll full results
Oct. 2014 civil beat poll full resultsOct. 2014 civil beat poll full results
Oct. 2014 civil beat poll full results
 
LotusHouseInterventionFinalPaper
LotusHouseInterventionFinalPaperLotusHouseInterventionFinalPaper
LotusHouseInterventionFinalPaper
 
Military Families Deploy Reunion6011
Military Families Deploy Reunion6011Military Families Deploy Reunion6011
Military Families Deploy Reunion6011
 
East Central Indiana Regional Data Snapshot
East Central Indiana Regional Data SnapshotEast Central Indiana Regional Data Snapshot
East Central Indiana Regional Data Snapshot
 

Viewers also liked

CRWCommunityPresentation
CRWCommunityPresentationCRWCommunityPresentation
CRWCommunityPresentationKelsha Hardy
 
ở đâu dịch vụ giúp việc nhà giá tốt ở sài gòn
ở đâu dịch vụ giúp việc nhà giá tốt ở sài gònở đâu dịch vụ giúp việc nhà giá tốt ở sài gòn
ở đâu dịch vụ giúp việc nhà giá tốt ở sài gònvella892
 
Thuốc chữa bệnh gây suy giảm tình dục ở nam giới
Thuốc chữa bệnh gây suy giảm tình dục ở nam giớiThuốc chữa bệnh gây suy giảm tình dục ở nam giới
Thuốc chữa bệnh gây suy giảm tình dục ở nam giớivella892
 
2015_HCH_Needs_Assessment
2015_HCH_Needs_Assessment2015_HCH_Needs_Assessment
2015_HCH_Needs_AssessmentAlyssa Laswell
 
ở đâu dịch vụ giúp việc cho người nước ngoài giá rẻ nhất ở tphcm
ở đâu dịch vụ giúp việc cho người nước ngoài giá rẻ nhất ở tphcmở đâu dịch vụ giúp việc cho người nước ngoài giá rẻ nhất ở tphcm
ở đâu dịch vụ giúp việc cho người nước ngoài giá rẻ nhất ở tphcmneville221
 
ở đâu dịch vụ giúp việc theo tháng giá tốt sài gòn
ở đâu dịch vụ giúp việc theo tháng giá tốt sài gònở đâu dịch vụ giúp việc theo tháng giá tốt sài gòn
ở đâu dịch vụ giúp việc theo tháng giá tốt sài gònfoster585
 
Makalah Dampak Infomatika di Bidang Pendidikan
Makalah Dampak Infomatika di Bidang PendidikanMakalah Dampak Infomatika di Bidang Pendidikan
Makalah Dampak Infomatika di Bidang PendidikanMutiara Nofitasari
 
Laporan Akhir Kegiatan Geladi BPJS Kesehatan - Mutiara Hikmah Nofitasari
Laporan Akhir Kegiatan Geladi BPJS Kesehatan - Mutiara Hikmah NofitasariLaporan Akhir Kegiatan Geladi BPJS Kesehatan - Mutiara Hikmah Nofitasari
Laporan Akhir Kegiatan Geladi BPJS Kesehatan - Mutiara Hikmah NofitasariMutiara Nofitasari
 

Viewers also liked (13)

Cp463 ai
Cp463 aiCp463 ai
Cp463 ai
 
CRWNewClientForms
CRWNewClientFormsCRWNewClientForms
CRWNewClientForms
 
CRWCommunityPresentation
CRWCommunityPresentationCRWCommunityPresentation
CRWCommunityPresentation
 
ở đâu dịch vụ giúp việc nhà giá tốt ở sài gòn
ở đâu dịch vụ giúp việc nhà giá tốt ở sài gònở đâu dịch vụ giúp việc nhà giá tốt ở sài gòn
ở đâu dịch vụ giúp việc nhà giá tốt ở sài gòn
 
Thuốc chữa bệnh gây suy giảm tình dục ở nam giới
Thuốc chữa bệnh gây suy giảm tình dục ở nam giớiThuốc chữa bệnh gây suy giảm tình dục ở nam giới
Thuốc chữa bệnh gây suy giảm tình dục ở nam giới
 
2015_HCH_Needs_Assessment
2015_HCH_Needs_Assessment2015_HCH_Needs_Assessment
2015_HCH_Needs_Assessment
 
Domestic pig
Domestic pigDomestic pig
Domestic pig
 
ở đâu dịch vụ giúp việc cho người nước ngoài giá rẻ nhất ở tphcm
ở đâu dịch vụ giúp việc cho người nước ngoài giá rẻ nhất ở tphcmở đâu dịch vụ giúp việc cho người nước ngoài giá rẻ nhất ở tphcm
ở đâu dịch vụ giúp việc cho người nước ngoài giá rẻ nhất ở tphcm
 
ở đâu dịch vụ giúp việc theo tháng giá tốt sài gòn
ở đâu dịch vụ giúp việc theo tháng giá tốt sài gònở đâu dịch vụ giúp việc theo tháng giá tốt sài gòn
ở đâu dịch vụ giúp việc theo tháng giá tốt sài gòn
 
Cp463 ai Weka
Cp463 ai WekaCp463 ai Weka
Cp463 ai Weka
 
Makalah Dampak Infomatika di Bidang Pendidikan
Makalah Dampak Infomatika di Bidang PendidikanMakalah Dampak Infomatika di Bidang Pendidikan
Makalah Dampak Infomatika di Bidang Pendidikan
 
Laporan Akhir Kegiatan Geladi BPJS Kesehatan - Mutiara Hikmah Nofitasari
Laporan Akhir Kegiatan Geladi BPJS Kesehatan - Mutiara Hikmah NofitasariLaporan Akhir Kegiatan Geladi BPJS Kesehatan - Mutiara Hikmah Nofitasari
Laporan Akhir Kegiatan Geladi BPJS Kesehatan - Mutiara Hikmah Nofitasari
 
Domestic pig
Domestic pigDomestic pig
Domestic pig
 

Similar to orange

Confronting Challenges of Diversity 7-7-15_final version
Confronting Challenges of Diversity 7-7-15_final versionConfronting Challenges of Diversity 7-7-15_final version
Confronting Challenges of Diversity 7-7-15_final versionCarlotta Brantley Paige
 
Exploring Public Health in Georgia and Metro Atlanta
Exploring Public Health in Georgia and Metro AtlantaExploring Public Health in Georgia and Metro Atlanta
Exploring Public Health in Georgia and Metro AtlantaARCResearch
 
Substance Abuse Keweenaw, Michigan
Substance Abuse Keweenaw, MichiganSubstance Abuse Keweenaw, Michigan
Substance Abuse Keweenaw, Michiganrecoveryrestart2
 
2015 PRC Region 8 Community Stakeholder Meeting 07.09.2015 Presentation
2015 PRC Region 8 Community Stakeholder Meeting 07.09.2015 Presentation2015 PRC Region 8 Community Stakeholder Meeting 07.09.2015 Presentation
2015 PRC Region 8 Community Stakeholder Meeting 07.09.2015 PresentationPrevention Resource Center Region 8
 
Ucjsum10 presentation
Ucjsum10 presentationUcjsum10 presentation
Ucjsum10 presentationNone
 
Education in the American South: Historical Context, Current State, and Futur...
Education in the American South: Historical Context, Current State, and Futur...Education in the American South: Historical Context, Current State, and Futur...
Education in the American South: Historical Context, Current State, and Futur...Jeremy Knight
 
Dale Quinney Transforming Rural AL
Dale Quinney   Transforming Rural ALDale Quinney   Transforming Rural AL
Dale Quinney Transforming Rural ALSamantha Haas
 
Anderson County Health Assesment
Anderson County Health AssesmentAnderson County Health Assesment
Anderson County Health AssesmentAllison Bodle
 
Underage Dirnking-Harding et al
Underage Dirnking-Harding et alUnderage Dirnking-Harding et al
Underage Dirnking-Harding et alRob Vincent
 

Similar to orange (20)

PublicHealthProject
PublicHealthProjectPublicHealthProject
PublicHealthProject
 
Franklin county healthcare august 29, 2013
Franklin county healthcare   august 29, 2013Franklin county healthcare   august 29, 2013
Franklin county healthcare august 29, 2013
 
Confronting Challenges of Diversity 7-7-15_final version
Confronting Challenges of Diversity 7-7-15_final versionConfronting Challenges of Diversity 7-7-15_final version
Confronting Challenges of Diversity 7-7-15_final version
 
Exploring Public Health in Georgia and Metro Atlanta
Exploring Public Health in Georgia and Metro AtlantaExploring Public Health in Georgia and Metro Atlanta
Exploring Public Health in Georgia and Metro Atlanta
 
Substance Abuse Keweenaw, Michigan
Substance Abuse Keweenaw, MichiganSubstance Abuse Keweenaw, Michigan
Substance Abuse Keweenaw, Michigan
 
Capstone paper
Capstone paperCapstone paper
Capstone paper
 
Region 8 Community Stakeholder Meeting 2015
Region 8 Community Stakeholder Meeting 2015Region 8 Community Stakeholder Meeting 2015
Region 8 Community Stakeholder Meeting 2015
 
2015 PRC Region 8 Community Stakeholder Meeting 07.09.2015 Presentation
2015 PRC Region 8 Community Stakeholder Meeting 07.09.2015 Presentation2015 PRC Region 8 Community Stakeholder Meeting 07.09.2015 Presentation
2015 PRC Region 8 Community Stakeholder Meeting 07.09.2015 Presentation
 
Industrial Strength - MAIP
Industrial Strength - MAIP   Industrial Strength - MAIP
Industrial Strength - MAIP
 
Northwest Indiana Regional Data Snapshot
Northwest Indiana Regional Data SnapshotNorthwest Indiana Regional Data Snapshot
Northwest Indiana Regional Data Snapshot
 
Health and Socioeconomic Status
Health and Socioeconomic StatusHealth and Socioeconomic Status
Health and Socioeconomic Status
 
The Domino Effect
The Domino EffectThe Domino Effect
The Domino Effect
 
Ucjsum10 presentation
Ucjsum10 presentationUcjsum10 presentation
Ucjsum10 presentation
 
Education in the American South: Historical Context, Current State, and Futur...
Education in the American South: Historical Context, Current State, and Futur...Education in the American South: Historical Context, Current State, and Futur...
Education in the American South: Historical Context, Current State, and Futur...
 
Education in the American South: Historical Context, Current State, and Futur...
Education in the American South: Historical Context, Current State, and Futur...Education in the American South: Historical Context, Current State, and Futur...
Education in the American South: Historical Context, Current State, and Futur...
 
Dale Quinney Transforming Rural AL
Dale Quinney   Transforming Rural ALDale Quinney   Transforming Rural AL
Dale Quinney Transforming Rural AL
 
East Central Indiana Regional Snapshot
East Central Indiana Regional SnapshotEast Central Indiana Regional Snapshot
East Central Indiana Regional Snapshot
 
Anderson County Health Assesment
Anderson County Health AssesmentAnderson County Health Assesment
Anderson County Health Assesment
 
Underage Dirnking-Harding et al
Underage Dirnking-Harding et alUnderage Dirnking-Harding et al
Underage Dirnking-Harding et al
 
2030 Report OEP
2030 Report OEP2030 Report OEP
2030 Report OEP
 

orange

  • 1. 2015 Population Health Profile of Orange County, Florida Published April 1, 2015 by Alyssa Laswell The Florida Department of Health works to protect, promote & improve the health of all people in Florida through integrated state, county, & community efforts.
  • 2. Florida Department of Health in Orange County ||2 2015 Orange County Community Health Assessment CONTENTS Introduction................................................................................................................................... 3 Demographic and Socioeconomic Characteristics .....................................................................4 Population Overview.................................................................................................................4 Social and Economic Profile......................................................................................................6 Households and Families ........................................................................................................6 Schools & Education ...............................................................................................................6 Employment ........................................................................................................................... 7 Income and Poverty................................................................................................................8 Uninsured And Health Care Costs...........................................................................................9 Homelessness .........................................................................................................................9 Mortality: Leading Causes of Death............................................................................................ 11 Leading Causes of Death............................................................................................................12 Infant Mortality .........................................................................................................................18 Motor Vehicle Crashes and pedestrian fatalities.......................................................................19 Morbidity (Disease incidence and Prevalence).........................................................................20 Maternal and Child Health ......................................................................................................20 Birth Rate, Teen Births ......................................................................................................... 20 Preterm and Low Birth Weight ............................................................................................ 20 Chronic Diseases.......................................................................................................................21 Cardiovascular Disease ..........................................................................................................21 Cancer ....................................................................................................................................21 Diabetes.................................................................................................................................21 Asthma...................................................................................................................................22 Overweight and Obesity........................................................................................................22 Health Behaviors (BRFSS Results).......................................................................................... 23 Infectious Diseases..................................................................................................................24 HIV/AIDS................................................................................................................................ 24 Sexually Transmitted Diseases ............................................................................................. 24 Tuberculosis.......................................................................................................................... 24 Health Inequities ......................................................................................................................... 25 Minority Profile: Black Population.......................................................................................... 25 Minority Profile: Hispanic Population..................................................................................... 25 County Health Rankings 2015 .....................................................................................................26
  • 3. Florida Department of Health in Orange County ||3 2015 Orange County Community Health Assessment INTRODUCTION This Community Health Assessment uses data from a wide variety of sources. Every effort was made to include the most up to date data available. Throughout this assessment, comparisons will be made to the entire state of Florida (67 counties in total), as well as to select groups of counties. Orange, Seminole, and Osceola counties are neighboring counties and comparison can be useful for regional geographic data. The Orlando Metropolitan Statistical Area encompasses these three counties and is often used for comparison purposes. In addition, comparisons may be drawn between counties with a similar socio-demographic makeup, namely: Miami-Dade, Broward, Palm Beach, and Hillsborough counties. These are the four counties in Florida with a larger population than Orange County, and they all encompass at least one major city, which can be useful for comparison to the Orlando area. These “peer” counties include cities such as Miami, Fort Lauderdale, West Palm Beach, and Tampa. It is often helpful to use county data to rank the 67 counties in regard to specific health factors or outcomes. For these purposes, this assessment will use quartiles when appropriate. The use of quartiles involves ranking the 67 counties, in order from best to worst. The top quartile (25%) is the best 16 counties for each measure. In some cases, this may be the highest rate (for example: adults who consume 5 servings of vegetables daily), and other measures may use the lowest rate to represent the best case (for example: rates of uninsured persons). The 1st and 2nd quartiles represent the counties with the best status for each indicator, and the 3rd and 4th quartiles represent areas which Orange County should target for improvement.
  • 4. Florida Department of Health in Orange County ||4 2015 Orange County Community Health Assessment DEMOGRAPHIC AND SOCIOECONOMIC CHARACTERISTICS Orange County consists of 903 square miles of land and 99 square miles of water, located in Central Florida.1 It is bordered on the north by Seminole County, the east by Brevard County, south by Osceola County, and to the west by Lake County. Orange County is home to 1,221,712 residents, with 255,483 living in Orlando, the largest city in the county.2 Orlando is the largest inland city in Florida. Orange County is densely populated, with an average of 1,332 people per square mile.3 This is higher than the state average, estimated to be 359 people per square mile in 2013, and the U.S. average of 87 residents per square mile.4 It is estimated that only 2% of the Orange County population lives in a rural setting.5 Orange County is located in what is known as the Orlando-Kissimmee- Sanford Metropolitan Statistical Area (also referred to as the Orlando MSA). The Orlando MSA includes Orange, Osceola, and Seminole Counties (Orange’s neighbors to the south and north, respectively). Orange County is home to such travel destinations as the Walt Disney World Resort, Universal Orlando Resort, and SeaWorld Orlando Resort. An estimated annual 52.9 million domestic visitors and 4.1 million international tourists make the Orlando area one of the top tourist destinations in the United States.6 Orlando has a large international airport, and is also known for its shopping and convention centers. The University of Central Florida, located within the county, boasts the 2nd highest enrollment in the nation. The recent expansion of the Medical City includes the new UCF College of Medicine, which opened in 2009, and Nemours Children Hospital, which opened in 2012. POPULATION OVERVIEW Orange County is the state's 5th most populous county, home to 6.2% of Florida's overall population.7 Orange County is the 16th fastest-growing county in Florida, experiencing population growth at a rate of 27.8% between the 2000 and 2010 census counts. This is above the state average of 17.6%.8 Orange County's population skews younger than Florida's overall population, with a median age of 33.7 years compared to the state average of 40.8 years9 However, Orange County, like the rest of the state, has an aging population. The life expectancy for women the United States is 80.9 years and men is 76.3.10 In Orange County, women’s life expectancy is 81.5 years, and men’s is 76.7 years. This places Orange County in the top 25% of all counties in the nation. The life expectancy has increased at a rate better than 75% of all counties in the years 1985-2010. Location of Orange County, Florida (guy) guy, s. (n.d.). wikipedia. Retrieved from wiki.com
  • 5. Florida Department of Health in Orange County ||5 2015 Orange County Community Health Assessment Additionally, Orange County is more racially diverse than the rest of Florida, with only 63.6% of its population identifying as white, in contrast to 75% of the state of Florida11 . Orange County has proportionally higher ethnic populations of Hispanics, Black/African Americans and Asians12 . The county, like the rest of the state, is expected to grow increasingly diverse in the years to come. There are an estimated 64,450 residents of Orange County that are not proficient in English. This accounts for approximately 6% of the population13 . This is a significantly lower rate than the 6.4% of Florida’s overall population that does not demonstrate English proficiency. English proficiency may have an impact on health literacy and health education efforts. Approximately 19% of Orange County’s populace was born outside of the United States. This is similar to the state rate, but much higher than the national average of 12.9%.
  • 6. Florida Department of Health in Orange County ||6 2015 Orange County Community Health Assessment SOCIAL AND ECONOMIC PROFILE HOUSEHOLDS AND FAMILIES An average household in Orange County is made up of 2.7 people, which is slightly higher than the state average of 2.5 people.14 There are 94,275 households in Orange County who reported severed housing problems in 2010. This is 23% of the population, which is significantly higher than the state average of 22%.15 SCHOOLS & EDUCATION Orange County has 205 public education institutions; 130 of these are elementary schools.16 The county population has a significantly higher rate of educational attainment than the rest of the state17 ; 86.9% of Orange County’s adults over the age of 25 years are high school graduates, and 30.0% have obtained a bachelor’s degree or higher. This compares to the 85.5% of the state’s adults older than 25 years that are high school graduates, and 26.0% with a bachelor’s degree or higher.18 However, within Orange County, educational attainment rates vary wildly, from a low of 0% of the population without a high school diploma in a census tract in Winter Park, to a high of 40.5% of the population without a high school diploma in a census tract in Ocoee. The map below illustrates areas of great need within in Orange County. This map highlights, by census tracts, areas with a high percentage of the population living below the poverty line, and population with low educational attainment.
  • 7. Florida Department of Health in Orange County ||7 2015 Orange County Community Health Assessment On this map, a “vulnerable population” is defined as a population in which more than 30% of the population is below the poverty level and more than 25% of the residents over the age of 25 years do not have a high school diploma. Vulnerable populations (by census tract), where both of these conditions coexist, are illustrated by a dark brown color on the map. Additionally, pockets of wealthy individuals are mapped here, colored in green. The green areas show census tracts in which the highest 1/5 of earners makes more than twice the average income in the county. This helps to visualize income inequalities, which often mirror health inequities in populations. EMPLOYMENT Orange County has historically benefitted from lower rates of unemployment than the rest of the state. Despite seeing a high level of unemployment in 2010 (11.1%, which mirrored the rest of the state), Orange County has seen a decrease in the years since, with an estimated 5.4% of the population unemployed in October 2014. This is below the national average of 5.5% and the state average of 5.8%.19 In the years 2014 through 2022, it is expected that the state of Florida will see a 14.1% increase in the amount of jobs. This is equivalent to 116,411 new jobs created by 2022. 20 The largest employers21 and industries22 of the 1,117,900 nonagricultural workers in the Orlando MSA are: Company Employees Walt Disney World Resort 74,000 University of Central Florida 11,078 Darden Restaurants 6,419 SeaWorld Orlando 6,032 Lockheed Martin 5,774 Siemens Energy 4,448 Aon Hewitt 1,769 L-3 Coleman Aerospace 955 Electronic Arts 800
  • 8. Florida Department of Health in Orange County ||8 2015 Orange County Community Health Assessment INCOME AND POVERTY Orange County’s median household income of $46,675 is the 21st highest in the state. This is $654 higher than the Florida average, but significantly lower than the national median household income of $52,250. 23,24 Orange County is home to 212,956 people, or 18.2% of its residents, who live below the federal poverty level, according to a 2013 estimate from the US Census Bureau.25 This is a higher rate than the Florida state average (17.1%) and significantly higher than the rest of the United States (15.8%).26 Please see the map below for a distribution of poverty-stricken individuals within the county. An estimated 170,711 individuals in Orange County receive Medicaid (18.9% of the population). This rate is lower than the state average of 20.3% and the national average of 20.2%. Additionally, Orange County has more children under the age of 18 years in poverty than the rest of the state and significantly more children in poverty when compared to the rest of the United States (27.1% in Orange County, 25.6% in Florida, and 22.6% nationwide). 27,28 In Orange County, 50% of children are eligible for free lunches. This is slightly higher than the state average of 49%.29 Eighteen percent of Orange County residents report food insecurity, and 6% (70,016 residents) report that they have limited access to healthy foods.30 There are multiple food deserts in Orange County. A food desert is defined as a low-income (LI) census tract where a significant proportion of the population lives more than 1 mile from a supermarket in urban areas or 10 miles in rural areas (referred to as low access or LA). These areas are highlighted in green on the map that follows.
  • 9. Florida Department of Health in Orange County ||9 2015 Orange County Community Health Assessment UNINSURED AND HEALTH CARE COSTS In 2011, it was estimated that 219,629 adults, or 29%, of Orange County adults (under age 65) were uninsured. This was similar to the state average of 29%.31 In addition, there were 36,738 uninsured children in Orange County, which is equivalent to 13% of all children. Again, this rate was not unlike the state average of 12%. Orange County residents spend significantly more money on health care related costs than the rest of the state. It is estimated that Orange County spends $11,552 per person on healthcare each year, while the average Floridian spends about $365 less.32 The percentage of the population who reported that they could not visit a doctor due to the cost was 18%; the state average was 17%.33 HOMELESSNESS Based on a 2013 report on homelessness by the Department of Children and Families' Council on Homelessness, Florida has the third largest homeless population in the country; 8.7% of the nation's homeless live in Florida. Florida also has the third highest rate of unsheltered homeless persons (64.1%). 34 Homeless estimates are based on a count conducted nationwide in one day and one night in January. Although Florida’s homeless population has been steadily declining since 2007, Orange County's homeless population shows an overall upward trend. The 2013 count was the highest in the past 7 years (data unavailable prior to 2007). Florida state has seen a 25% decrease in the number of homeless individuals in years 2007-2013; Orange County has seen a 100% increase in the same time period. In 2013, Orange County had the 4th highest count of homeless individuals, accounting for 6.5% of the state's homeless population. Based on the 2013 report, Orange, Osceola, and Seminole Counties together have the highest number of chronically homeless people among smaller city, county, and regional areas in the US-- an estimated 1,577 are chronically homeless.35 This places the Orlando MSA as 7th in the nation, behind the major cities of Los Angeles, New York City, San Diego, CA, San Jose/Santa Clara, CA, San Francisco, and Washington, DC. In the January 2013 count, there were 479 homeless unaccompanied children and youth under the age of 25 in Orange, Osceola, and Seminole counties. This is the 10th highest count in the nation.
  • 10. Florida Department of Health in Orange County ||10 2015 Orange County Community Health Assessment The Florida Department of Education reports that Orange County has the highest amount of homeless students of the 67 counties in Florida. The 2012-13 school year is the first year that Orange County has surpassed the number of homeless students in Miami-Dade County, even though Orange County has half the number of school aged children who reside in Miami-Dade. Out of the top 12 counties in Florida with the highest number of homeless students, half of the counties are in Central Florida, including all 3 counties that make up the Orlando Metropolitan Statistical Area (MSA). All five of the counties with the largest population are also included in the top 12 (Orange County’s peer metropolitan counties). Central Florida has more homeless children than the four largest counties (Miami-Dade, Broward, Palm Beach, and Hillsborough) combined.
  • 11. Florida Department of Health in Orange County ||11 2015 Orange County Community Health Assessment MORTALITY: LEADING CAUSES OF DEATH The leading causes of death are ranked as follows for Orange County, Florida, and the United States36 : All rates discussed in this section are the age-adjusted death rate per 100,000 residents in the population. This makes it possible to compare counties with different demographic compositions. Often, the 3-year-rolling rate is used instead of single years, as this elucidates overall trends without being affected by a single-year extreme rate. Years of Potential Life Lost (YPLL) are for every 100,000 residents under the age of 75. The summary view at the beginning of each section highlights important information, including the cause-specific mortality rate, the overall trend for the past 15 years, a comparison of Orange County to the rest of the state and county, and any differences (“disparities”) that exist between genders, races, ethnicities, or age groups. The group with a Rank Orange County37 Florida38 United States39 1 Cancer Cancer Heart Disease 2 Heart Disease Heart Disease Cancer 3 Unintentional Injuries Chronic Lower Respiratory Disease (CLRD) Chronic Lower Respiratory Disease (CLRD) 4 Stroke Stroke Unintentional Injuries 5 Chronic Lower Respiratory Disease (CLRD) Unintentional Injuries Stroke 6 Diabetes Mellitus Diabetes Mellitus Alzheimer’s Disease 7 Alzheimer’s Disease Alzheimer's Disease Diabetes 8 Pneumonia/Influenza Kidney Disease Pneumonia/Influenza 9 Suicide Suicide Kidney Disease 10 Septicemia Chronic Liver Disease and Cirrhosis Suicide
  • 12. Florida Department of Health in Orange County ||12 2015 Orange County Community Health Assessment higher rate of morbidity or mortality is highlighted in red. The explanation under the county snapshot provides deeper detail and explanations or trends. LEADING CAUSES OF DEATH 1. CANCER40 Cancer deaths in Orange County occur at a rate of 158.5 per 100,000 residents in the population. This is very close to the average rate in the state of Florida (158.7 per 100,000 residents), and puts Orange County in the second quartile of counties. This rate meets the national target for Healthy People 202041 . In the last 20 years, the rate of cancer deaths has gone steadily downward. Cancer is responsible for the greatest Years of Potential Life Lost (YPLL) for residents under age 75. Each year, it is estimated that 1,357.9 years of life are lost due to cancers per 100,000 people in Orange County. Years of Potential Life Lost (YPLL) is a measure used to help quantify the social and economic loss due to specific causes of death. It uses an estimate of how long the person would have lived on average, if that individual had not died prematurely (in this case from cancer). Men have a higher mortality rate due to cancers than women, although this gap between genders has been growing increasingly narrow (from a difference of 93.3 per 100,000 in 1995 to 50.1 per 100,000 in 2013). In Orange County, white people have a higher death rate due to cancer than blacks. This was true for the first time in the year 1999; prior to 1999, blacks held the higher rate of cancer deaths. When comparing Hispanics Cancer Mortality 158.5 per 100,000 Trend decreasing Florida Comparison 2nd quartile historically higher, recently similar Healthy People 2020 Target: met: 161.4 per 100,000 Disparities Male vs. Female White vs. Black Non-Hispanic vs. Hispanic Over age 65 vs. under age 65
  • 13. Florida Department of Health in Orange County ||13 2015 Orange County Community Health Assessment and non-Hispanics, Hispanics have a much lower death rate, by 56.2 deaths per 100,000 residents. Cancer disproportionately affects older Floridians, as the top risk factor for cancer is advancing age. In Florida, 18% of the population is over the age of 65, but 70% of cancer deaths occur in this age group. Lung cancer is responsible for a quarter of cancer deaths. Colorectal cancer accounts for 10% of total cancer deaths, and breast cancer follows with 7% of cancer deaths. 42 Other cancer deaths result from (in order): prostate cancer, non-Hodgkin’s lymphoma, bladder cancer, head and neck cancer, ovarian cancer, melanoma, and cervical cancer. 2. HEART DISEASE43 Deaths due to heart disease occur at an annual rate of 148.1 per 100,000 in Orange County. Again, Orange County ranks in the second quartile of counties. Orange County has historically had higher rates than the state, but since 2009, the mortality rates due to heart disease have been similar. The state rate is 153.4 per 100,000. This does not meet the Healthy People 2020 target of 103.4 deaths per 100,000 residents. This rate has declined greatly since 1994, although it has begun to level off in the years since 2007. Men have a higher rate of death due to heart disease than women; for every woman that dies of heart disease, 1.7 men die from the same cause. This gap between men and women has been gradually getting worse for the past 20 years. Racial differences also exist; black people historically have a higher death rate than whites, although this difference is much more pronounced in Florida than in Orange County. These rates between blacks and whites have been similar in Orange County since 2004. The state of Florida shows a much larger difference between the mortality rate for blacks and whites. Mortality rates for black people in Orange County have actually been lower than that of whites in the years 2011, 2012, and 2013. Heart Disease Mortality 148.1 per 100,000 Trend decreasing Florida Comparison 2nd quartile historically slightly higher, recently similar Healthy People 2020 Target not met: 103.4 per 100,000 Disparities Male vs. Female Non-Hispanic vs. Hispanic Over age 75 vs. under age 75
  • 14. Florida Department of Health in Orange County ||14 2015 Orange County Community Health Assessment Ethnic differences exist as well. Orange County non- Hispanic individuals suffer a higher mortality rate than Hispanics. This difference is larger in Orange County than it is in the rest of the state. 3. UNINTENTIONAL INJURIES44 Statewide, rates of death from unintentional injuries increased from 1994-2005, and have been decreasing in the years since. In Orange County, however, this rate has been relatively stable for the past 15 years, with the 2013 rate of 34.3 per 100,000 residents slightly lower than the state rate of 38.8 per 100,000. Orange County is in the first quartile of counties for unintentional injuries death rate. Orange County has had a much lower rate than the rest of the state every year since 2000. Orange Country’s mortality rate due to unintentional injuries is lower than the Healthy People 2020 target. Men have a higher rate of death due to unintentional injury than women, both statewide and in Orange County. Non-Hispanics have a higher mortality rate than Hispanics, and whites have a higher mortality rate than blacks. The elderly are at a much higher risk of mortality due to unintentional injury. Orange County residents over the age of 75 years have a mortality rate more than three times higher than any other age group (10-year increments), and this rate is increasing. 4. STROKE45 Orange County’s mortality rate due to stroke falls in the third quartile of counties in Florida. At 36.7 deaths per 100,000 residents, this is higher than the state rate of 31.3 per 100,000, and does not meet the Healthy People 2020 target rate. The rate in Orange County has shown a slight increase in each of the past 4 years, while the state has been remaining constant. Black people have a higher mortality rate than white people. The difference between races is larger in the state than in Orange County. Non-Hispanics have a greater mortality rate than Hispanics, but this gap has been narrowing in recent years. 5. CHRONIC LOWER RESPIRATORY DISEASE (CLRD)46 Unintentional Injuries Mortality 34.3 per 100,000 Trend steady Florida Comparison 1st quartile state decreasing since 2007 Healthy People 2020 Target met: 53.7 per 100,000 Disparities Male vs. Female Non-Hispanic vs. Hispanic White vs. Black Over age 75 vs. under age 75 Stroke Mortality 36.7 per 100,000 Trend steady Florida Comparison 3nd quartile Orange slightly higher Healthy People 2020 Target: not met: 34.8 per 100,000 Disparities Black vs. White Non-Hispanics vs. Hispanics Over age 75 vs. under age 75
  • 15. Florida Department of Health in Orange County ||15 2015 Orange County Community Health Assessment In the last 20 years, Orange has had a higher death rate than the rest of the state for chronic lower respiratory disease (CLRD).This rate has been decreasing slightly each year. In recent years however (since 2010), Orange County has had a similar or lower rate than the rest of the state, and in 2013, Orange ranked in the first quartile of counties (35.8 per 100,000). This rate is better than the national rate of 42.1 deaths per 100,000 residents. CLRD mortality affects men at a higher rate than women; however, the male death rate has been decreasing at a greater rate than that of the female rate. White people suffered deaths due to CLRD at a higher rate than blacks, and rates for non-Hispanic people are higher than Hispanics. 6. DIABETES MELLITUS47 While Orange showed a large overall decrease in the years 2000-2006, the rate has been increasing in the years since 2007. In this same time period, the state mortality rate from diabetes has been declining, then holding fairly constant since 2009. Although this rate is not ideal, it does meet the Healthy People 2020 target. CLRD Mortality 35.8 per 100,000 Trend slightly decreasing Florida Comparison 1st quartile historically slightly higher, recently similar US Comparison 42.1 per 100,000 Disparities Male vs. Female White vs. Black Over age 75 vs. under age 75 Non-Hispanic vs. Hispanic Diabetes Mortality 24.3 per 100,000 Trend increasing Florida Comparison 3rd quartile Orange increasing while Florida decreasing Healthy People 2020 target: met: 66.6 per 100,000 Disparities Male vs. Female Blacks vs. Whites Over age 65 vs. under age 65
  • 16. Florida Department of Health in Orange County ||16 2015 Orange County Community Health Assessment Men have a higher mortality rate due to diabetes; this is true in Orange County and in the state of Florida. Blacks have a higher rate of death than whites, and rates are similar between Hispanics and non-Hispanics. 7. ALZHEIMER’S DISEASE48 The mortality rate for Alzheimer’s disease in Orange County is 18.3 deaths per 100,000 people. This rate has shown a slight decrease in the past 15 years. Orange County’s rate is consistently higher than that of the state although this difference is getting smaller every year. This rate is below the national average of 23.5 deaths per 100,000 US residents. Within the county, females suffer a higher mortality rate than males. Whites have a higher mortality rate than blacks, although the rate for whites has leveled off while blacks show an overall increasing trend since the year 2000. Alzheimer's Mortality 18.3 per 100,000 Trend steady Florida Comparison 3rd quartile Orange higher than state rate, gap decreasing US Comparison 23.5 per 100,000 Disparities Female vs. Male Whites vs. Blacks Over age 75 vs. under age 75
  • 17. Florida Department of Health in Orange County ||17 2015 Orange County Community Health Assessment 8. PNEUMONIA/INFLUENZA The mortality rate due to Pneumonia and Influenza is 12.7 per 100,000. This is better than the national average of 15.9 deaths per 100,000, but it places Orange County in the 3rd quartiles of counties within Florida. While deaths from pneumonia and influenza have decreased dramatically since the 1990’s, this rate has been steady or slightly increasing in the years since 2007. This trend holds true for Orange County and the state of Florida. 9. SUICIDE49 Orange County ranks 14th of 67 counties for suicide mortality rate. Orange County’s rate of 10.1 per 100,000 means Orange is in the first quartile of Florida’s counties. The state average of 13.8 is consistently higher than that of Orange County. Nationally, this meets the Healthy People 2020 target. Men have a much higher rate of deaths due to suicide; more than double that of females. This rate has been as high as five times the rate of females, but has been lower in recent years. Whites have a higher mortality rate than blacks; this rate is approximately twice the rate of blacks. The actual counts of suicide mortalities are relatively low: 122 deaths in 2013. This compares to 1,702 deaths from cancer in 2013. 10. SEPTICEMIA Orange County ranks in the worst quartile for deaths due to septicemia. This rate is higher than the national average of 10.7 deaths per 100,000 population. Black people are disproportionately affected, and the elderly have a greater risk of death from septicemia. The cause-specific mortality rate for septicemia was low in the early 1990’s, but increased sharply after 1998 and peaked in 2003 at 16.1 deaths per 100,000. In the years since, this rate has slowly decreased, although it has not reached the levels seen 20 years ago Mortality Rate 12.7 per 100,000 Trend slight increase since 2007 Florida Comparison 3rd quartile Orange consistently slightly lower US Comparison 15.9 per 100,000 Disparities Whites vs. Blacks Non-Hispanic vs. Hispanic Suicide Mortality 10.1 per 100,000 Trend steady Florida Comparison 1st quartile Orange's rate consistently lower than Florida US Comparison target: 10.2 per 100,000 Disparities Male vs. Female Whites vs. Blacks Septicemia Mortality 11.1 per 100,000 Trend slight decrease since 2003 Florida Comparison 4th quartile Orange decreasing while state slightly increasing US Comparison 10.7 per 100,000 Disparities Blacks vs. Whites Over age 75 vs. under age 75
  • 18. Florida Department of Health in Orange County ||18 2015 Orange County Community Health Assessment INFANT MORTALITY In 2013, there were 15,829 births to Orange County mothers. Of these births, 119 infants died within their first 365 days of life. This is equivalent to a death rate of 7.52 deaths per 1,000 births50 . This rate is significantly higher than expected, and is higher than the state rate of 6.1 deaths per 1,000 live births. Orange County is one of 9 counties with significantly higher infant mortality rates than expected. Hillsborough is the only other peer county with significantly higher rates than expected. Broward, Miami-Dade, and Palm Beach are 3 of 4 Florida counties with significantly lower rates than expected. In this calculation, the expected rate was adjusted to control for maternal race, marital status, and educational characteristics in each county.51 There are also significant disparities in infant mortality rates between races. In 2013, black infants were twice as likely to die before their first birthday as white babies. Black babies are also more likely than white babies to be stillborn. The graph above displays infant mortality rates per 1,000 births in Orange County and statewide, from 1992 through 2013. The three-year rolling rate is used to smooth out the line by averaging any extreme year, which makes it easier to identify overall trends. Fortunately, since 2006, the overall infant mortality rate in Orange County has decreased by 1.0 death per 1,000 live births. The map below highlights census tracts with a high density of infant deaths between 2006 and 2010. Many of these tracts correlate with vulnerable populations. (Note: this map shows counts, not rates per residents.) Tracts with 10 or more deaths are labeled with the actual number of infant deaths.
  • 19. Florida Department of Health in Orange County ||19 2015 Orange County Community Health Assessment Infant mortality is an informative and sensitive indicator of the health of the population, since the health of an infant is dependent on the health of the entire population—not just the mother; but also the father, families, and society. There are many risk factors that are associated with infant mortality, including: maternal race, marital status, maternal education, maternal age, smoking status, nutrition, genetics, access to health care, birth spacing, infections, chronic medical diseases, psychiatric conditions, environmental exposures, stress, obesity, diabetes, and more. Modifiable risk factors are targets for improvement opportunities. In addition, the rate of maternal deaths has been increasing over the past decade. The number of women who die in childbirth is small (under 4 per year), so trends can be challenging to discern.52 MOTOR VEHICLE CRASHES AND PEDESTRIAN FATALITIES Orange County has a lower fatality rate due to motor vehicular crashes than the rest of the state (9.8 deaths per 100,000 residents, compared to a state rate of 12.1 per 100,000).53 This rate has been slowly declining since 2010. However, while the roads are getting safer for motorists, this does not hold true for pedestrians. Of all metro areas in the United States with a population over 1 million people, the Orlando-Kissimmee metropolitan area ranks first in the Pedestrian Danger Index, a measure of the relative likelihood that a person on foot will be struck and killed by a motor vehicle.54 As the most dangerous place for pedestrians in the US, this means that pedestrians in the Orlando-Kissimmee area suffer more fatalities, despite fewer people walking than other areas in the nation. This 2014 ranking is based on five years of data, between 2008 and 2012. The state of Florida is especially deadly for pedestrians; the four highest areas nationwide for pedestrian deaths are all in Florida: Orlando-Kissimmee, Tampa-St. Petersburg-Clearwater, Jacksonville, and Miami-Fort Lauderdale- Pompano Beach, respectively. CRIME Although the crime rate in Orange County has been slowly decreasing over time, Orange is still among the worst counties in Florida in terms of crime. Orange has been in the top four counties with the highest rate of crimes since 2009.55 The 2013 rate of 4,949.2 crimes per 100,000 population represents a 1.3% decrease from 2012. (Crimes included in this rate are: murder, sexual offenses, robbery, aggravated assault, burglary, larceny, and motor vehicle theft as reported to law enforcement, not arrests.) Violent crimes occur in Orange County at a rate of 690.1 crimes per 100,000 population. The graph to the right illustrates the trend in crime rates for Orange County and its five peer counties, as well as the state average, between 2009 and 2013. Domestic violence offense rates for Orange County are in the 3rd quartile of counties in Florida. There was an average of 8,330 domestic violence offenses in Orange County between 2011 and 2013, a rate of 707.4 per 100,000, higher than the state average of 572.0 offenses per 100,000 individuals. Additionally, Florida ranks third in the nation for human trafficking. This is primarily due to “tourism, influx of foreign immigrants, sporting events, conventions, and transient population. Human trafficking is the 2nd most lucrative criminal enterprise in the world.”56
  • 20. Florida Department of Health in Orange County ||20 2015 Orange County Community Health Assessment MORBIDITY (DISEASE INCIDENCE AND PREVALENCE) MATERNAL AND CHILD HEALTH BIRTH RATE, TEEN BIRTHS Orange County has one of the highest birth rates in the state, with 13.2 live births per 1,000 residents. This is the 6th highest birth rate in the state, and highest among the peer counties. The teen birth rate in Orange County is 6.3 births per 1,000 female teenagers, the same as the state rate. In 2013, there were 1,000 babies born in Orange County to mothers under the age of 20 years.57 PRETERM AND LOW BIRTH WEIGHT A pre-term birth is a birth before than 37 weeks gestation. The morbidity rate for preterm births in Orange County is one of the worst in the state. In 2013, Orange ranked 3rd worst in the rate of pre-term births, with 2,578 babies born in Orange County under 37 weeks of gestation. This represents a rate of 16.3 pre-term births per 100,000 live births.58 The state average is 14.0 pre-term births per 100,000 births. There is a major disparity in pre-term babies when comparing white and black populations, which is not unique to Orange County. The rate for white babies in Orange County is 14.7 preterm births per 100,000 births compared to a rate in black babies of 20.5 preterm per 100,000 births. Between 2005 and 2011, in the state of Florida, 8.7% of babies were born at a low birthweight. During the same time period in Orange County, 10,269 babies out of 112,892 were born at a low birthweight. This equals 9.1% of babies, a significantly higher proportion than the state average. Orange County and the state of Florida fall short of the US national average of 8.1%.59 The map below displays the concentrations of babies born at a low birth weight, by census tract. This percentage ranges throughout the county from a low of 0% to a high of 21.1% of all babies born at a low birth weight in a census tract in downtown Orlando (census tract 105, at the northwest intersection of I-4 and SR 408. This tract is also one of the lowest-income sections in the county).
  • 21. Florida Department of Health in Orange County ||21 2015 Orange County Community Health Assessment CHRONIC DISEASES CARDIOVASCULAR DISEASE From 2010-2012, there were 4,104 Orange County hospitalizations due to Coronary Heart Disease, and an additional 1,433 hospitalizations attributed to congestive heart failure. Both of these rates are higher than the state age-adjusted rate, although the death rate for coronary heart disease is lower than the state’s. Strokes attributed for 3,121 hospitalizations in the same time period, a rate that is again higher than the state average. CANCER Florida ranks second in the nation for newly diagnosed cancer cases. Annually, there are 100,000 new cancer cases diagnosed in Florida, with 60% of these in people over the age of 65. Cancer occurrence differs by age, sex, race, geography, and the stage of disease at the time of diagnosis. Cancer deaths are responsible for the greatest Years of Potential Life Lost, and constitute an enormous financial burden as well; approximately $4 billion is spent annually for in-patient hospital care for cancers. 60 LUNG CANCER Orange County is in the best quartile for rates of: death due to lung cancer, incidence of lung cancer, and adults who are current smokers. Lung cancer incidence in Orange County was higher than the state rate during the 1990s, but has been similar to or lower than the state average since 2000. Adults who report being current smokers decreased between 2002 and 2010, from 21.4% to 13.3%, but increased to 16.0% in 2013. This is still slightly lower than the state average of 16.8%.61 COLORECTAL CANCER Orange County ranks low for the incidence and mortality due to colorectal cancer, when compared to the rest of the state (4th and 3rd quartile, respectively). This may be a result of certain preventative behaviors, like: adults over the age of 50 years who have received a colonoscopy or sigmoidoscopy in the past five years, and adults over 50 years of age who have received a stool blood test in the past year. When asked about these behaviors in 2013, less than half reported receiving a colonoscopy or sigmoidoscopy, and less than 9% reported a stool blood test. These percentages are in the 4th quartile statewide. BREAST AND PROSTATE CANCER Breast cancer was diagnosed in 664 Orange County residents between 2009 and 2011, and resulted in 122 deaths in 2011-2013. These rates are similar to or slightly higher than the state rates. Prostate cancer in Orange County affects a larger proportion of men than in the rest of the state. In Orange County, 614 diagnoses and 76 deaths place Orange in the 4th quartile for incidence and the 3rd quartile for mortality. DIABETES Diabetes contributed to 34,509 hospitalizations in Orange County between 2010 and 2012. This is a rate of 3,258.9 hospitalizations per 100,000 residents, and places Orange County in the worst quartile in the state. However, in a 2013 survey, only 10.3% of adults reported that they had ever been told they had diabetes, a rate in the 2nd quartile of the state, and lower than the state average of 11.2%. This may imply that Orange County adults have a high rate of undiagnosed diabetes.
  • 22. Florida Department of Health in Orange County ||22 2015 Orange County Community Health Assessment ASTHMA In 2013, 7.7% of adults reported that they currently have asthma, which is slightly lower than the state rate of 8.3% and in the second quartile of counties. However, Orange County is in the worst quartile in terms of asthma hospitalizations, with 10,906 hospitalizations between 2010 and 2012. This discrepancy between diagnoses and hospitalizations may mean that asthma is going undiagnosed, or that asthma is being poorly managed in diagnosed individuals. OVERWEIGHT AND OBESITY Since 1980, the worldwide rate of obesity has nearly doubled. Excess body fat impairs health and can have many long term consequences, including placing the individual at increased risk for: cardiovascular disease (including heart disease and stroke), diabetes, musculoskeletal disorders (especially osteoarthritis), and some cancers (endometrial, breast, colon). Children who are obese also face breathing difficulties, an increased risk of fractures, hypertension, and early indicators of cardiovascular disease, insulin resistance, and physiological effects.62 Excess body weight is measured by the body mass index (BMI), which is an individual’s weight (in kilograms) divided by the square of their height (in meters). A BMI of 25 or greater is considered overweight, and a BMI greater than 30 is classified as obese. It is estimated that 29.7% of the US population is obese in 201463 . In Florida, this proportion is slightly lower, at 26.4%. Only 36% of Floridians are at a healthy weight. If the current trends continue, 60% of the state will be obese by 2030. In the next 20 years, obesity is expected to contribute to millions of cases of preventable chronic diseases, resulting in an estimated $34 billion of healthcare costs in the state of Florida64 . Promisingly, 2013 was the first year since 2002 (when data collection began), that a higher percentage of adults reported a healthy weight, when compared to the previous survey (36.3% in 2013, up from 34.6% in 2010). This trend is also true for the Florida state average. Based on 2013 data, it is estimated that 36.2% of adults in Orange County are overweight, and an additional 25.0% are obese65 . Overall, this means that 61.2% of all adults in Orange County are above a healthy weight. This places Orange County in the 1st quartile when compared to the rest of the counties in Florida. Of the overall Orange County population, an estimated 68.8% of men and 53.8% of women are overweight or obese. While there are no significant differences in overweight and obesity rates when looking at ethnic groups as a whole, differences emerge when these populations are further broken down by gender. Black females have a Orange County Obesity Rate: 25% (14th best in state) Florida Obesity Rate: 26.4% (13th best in U.S) United States Obesity Rate: 29.7%
  • 23. Florida Department of Health in Orange County ||23 2015 Orange County Community Health Assessment significantly higher rate of obesity and overweight than white (non-Hispanic) females.66 While there are no statistically significant differences between males of different ethnicities, there are significant differences between white, non-Hispanic males and white, non-Hispanic females. In Orange County, adults who are between the ages of 45 and 64 years of age have the highest rate of overweight/obesity (55.6%), followed by adults older than 65 years (66.3%), and adults 18-44 years (55.6%). Twenty-four percent of Florida adults are physically inactive. In Orange County, between 22 and 26% of adults report physical inactivity67 . Only 79% of Orange County residents report access to exercise opportunities. While this is slightly higher than the state average of 78%, it is lower than all other comparable counties (Broward- 94%, Miami-Dade- 94%, Hillsborough- 87%, and Palm Beach- 87%).68 Adults in Orange County consume more vegetables than the state and country average. Adults report a slightly lower level of physical activity in Orange County when compared to United States, and the rate is similar to the rest of the state.69 HEALTH BEHAVIORS (BRFSS RESULTS) The Behavioral Risk Factor Surveillance Survey (BRFSS) was conducted statewide in 2002, 2007, 2010, and most recently, in 2013. Orange County residents reported several characteristics that were significantly different than the overall state results. Strengths of Orange County (in which Orange performed significantly better than the state average) are:  Low percentage of adults who have ever been told they had chronic obstructive pulmonary disease, emphysema, or chronic bronchitis  Low percentage of adults who have ever been told they had any other type of cancer except skin cancer  Low percentage of adults who have ever been told they had high blood cholesterol  Low percentage of adults who have ever been told they had coronary heart disease, heart attack, or stroke  High percentage of adults who have never smoked Areas in which Orange County scored significantly worse than the state average are:  Low percentage of adults who received a flu shot in the past year  Low percentage of adults who had a medical checkup in the past year  Low percentage of adults who have a personal doctor
  • 24. Florida Department of Health in Orange County ||24 2015 Orange County Community Health Assessment INFECTIOUS DISEASES Orange County is plagued by higher than average rates of communicable and infectious diseases. When compared to the rest of the state, Orange ranks in the worse quartile for Human Immunodeficiency Virus (HIV) cases reported, Acquired Immunodeficiency Syndrome (AIDS) cases reported, HIV/AIDS adjusted death rate, tuberculosis (TB) cases reported, chlamydia cases reported, gonorrhea cases reported, and infectious syphilis cases reported70 . Orange County is in the 3rd quartile for rates of vaccine preventable diseases. Although the statistics are dire, trends in recent years have shown most of these rates are improving, with the exception of new cases of chlamydia and infectious syphilis. HIV/AIDS In 2011 (most recent year national data is available), Florida ranked second in new Human Immunodeficiency Virus (HIV) infection cases, and 3rd in HIV infection rates per 100,000, with a total of 5,408 cases, representing 28.4 HIV cases per 100,000 residents. Florida ranks 3rd in the estimated number of Acquired Immune Deficiency Syndrome (AIDS) diagnosed in 2011 and 4th in the rate. There were 3,440 new cases of AIDS, or 18.1 cases per 100,000 residents in 2011. In Orange County, there were 470 new cases of HIV diagnosed in 2013, which is the third highest county in the state. Orange also ranked highly in terms of AIDS diagnoses, with 310 new cases in 2013. 71 There are an estimated 9,977 people living with HIV/AIDS in the Orlando Eligible Metropolitan Area in 2013. An estimated 39.2% of these cases are black, with 35.7% white, and 23.1% Hispanic. Almost 75% of people living with HIV/AIDS are male. SEXUALLY TRANSMITTED DISEASES Orange is in the worst quartile for Sexually Transmitted Diseases (STDs). A 3 year rate of 707.4 cases per 100,000 residents is much higher than the state rate of 522.3 per 100,000 for the same time period. Orange ranks in the worst quartile for rates of each of the following STDs: chlamydia, gonorrhea, and infectious syphilis. Orange County has 571.1 cases of chlamydia for every 100,000 people. This rate is higher than the rest of the state (419.1 per 100,000). This is also higher than all neighboring and peer counties.72 This rate has been getting steadily worse since 1998. Gonorrhea cases in Orange County affect 159.6 residents per 100,000. This rate is higher than the state average of 109.1 cases per 100,000 residents. There are only 5 counties with worse rates than Orange, and Orange is the worst of the metropolitan counties. Unlike chlamydia cases, gonorrhea cases have been generally decreasing. However, in 2013, the rate increased from the previous year, the first year-to-year increase since 2005. Orange also has higher than average cases of infectious syphilis, ranking 5th in the state with a rate of 11.9 per 100,000 residents. The state average is 7.3 per 100,000. The rate of infectious syphilis has increased five-fold since 1995. TUBERCULOSIS Orange County has the 3rd highest rate of tuberculosis cases in Florida, trailing behind Miami Dade and Broward. Orange is second in the state for tuberculosis deaths.73
  • 25. Florida Department of Health in Orange County ||25 2015 Orange County Community Health Assessment HEALTH INEQUITIES MINORITY PROFILE: BLACK POPULATION74 Orange County has a higher percentage of Black residents than the rest of the state (21.7% in Orange County vs. 16.5% statewide). Black individuals in Orange County are more likely to be below the poverty level, more likely to be unemployed, and less likely to have a high school diploma. Black residents report a lower rate of excellent overall health, and are less likely to have health care insurance coverage. Blacks have a higher mortality rate than whites due to stroke, colorectal cancer, and breast cancer. White individuals have a higher mortality rate due to coronary heart disease, lung cancer, and cancer overall. Black women over the age of 40 years old are less likely to have received a mammogram and less likely to be diagnosed with breast cancer, but suffer higher mortality rates due to breast cancer than white women. Black adults over the age of 50 years are less likely to have had a sigmoidoscopy or colonoscopy, but had a higher mortality rate due to colorectal cancer than their white counterparts. Black residents of Orange County are hospitalized for congestive heart failure at a higher rate than white, yet have similar mortality rates. Black adults are also more likely to have had a heart attack, but die from coronary heart disease at a lower rate than white adults. The teen pregnancy rate is higher in black teenagers than white, and babies are born to black unwed mothers at a higher rate than white mothers. Expectant black mothers have a lower rate than whites of 1st trimester prenatal care, with more than twice the rate of black mothers receiving no prenatal care at all. Black mothers are less likely to initiate breastfeeding, and more likely to have babies with less than 18 months between pregnancies. Black mothers are 1.5 times more likely to deliver a preterm baby, 2 times more likely to deliver a low birth weight baby, and 2.6 times more likely to deliver a baby with a very low birth weight. Black mothers suffer more than double the rate of fetal deaths and infant deaths than white mothers. Black residents of Orange County die from 3 times as many homicides as their white counterparts, and are hospitalized for non-fatal firearms-related injuries more than 6 times as often. Blacks have a lower rate of suicides, traumatic brain injury deaths, and hospitalizations for motor vehicle related injuries and non-fatal unintentional falls. MINORITY PROFILE: HISPANIC POPULATION75 Hispanic people make up 27.7% of the populace in Orange County, which is higher than the state average of 23.2%. Compared to non-Hispanic residents in Orange County, Hispanic residents are more than twice as likely to be living in poverty. Hispanics also have a higher rate of unemployment and are more than 3x less likely to have a high school diploma than their non-Hispanic neighbors. They are more likely to be hospitalized or visit the ER due to asthma, and are less likely to have a personal doctor or health insurance. They report more often than non-Hispanics that the cost is prohibitive for them to see a doctor, and they are less likely to state that they are in “good to excellent” overall health. Despite lower socioeconomic status, the health of Hispanics is frequently better than non-Hispanics. Hispanic individuals in Orange County die less frequently than their non-Hispanic counterparts due to: coronary heart disease, stroke, congestive heart failure, AIDS, and cancer (including lung cancer, colorectal cancer, breast cancer, prostate cancer, and cervical cancer). They are slightly more likely to die of diabetes, even though there is a lower percentage of Hispanics with diagnosed diabetes. Hispanics have similar rates as non-Hispanics for hospitalizations due to congestive heart failure, but are less likely to die from it. They are also much less likely to have had a heart attack or stroke. Hispanics are less likely than non-Hispanics to have had preventative screenings for colorectal cancer or breast cancer, and are less likely to report having had their cholesterol checked in the previous five years. Hispanics have a higher rate of overweight, but similar rates of obesity. Hispanics are less likely to engage in regular moderate activity, but also less likely to be current smokers. Hispanics have more favorable birth outcomes than non-Hispanics, with fewer fetal and infant deaths, and lower rates of low birth weight infants. Hispanics and non-Hispanics have similar rates of preterm babies. Hispanic populations have a higher rate of teenage births, and a higher birth rate for mothers between the ages of 20 and 54 years. Hispanics have a higher rate of obesity, and expectant Hispanic mothers have a slightly higher rate of overweight and obesity at the time pregnancy occurred. Hispanics initiate breastfeeding more often than non-Hispanic mothers, but are slightly less likely to receive prenatal care.
  • 26. Florida Department of Health in Orange County ||26 2015 Orange County Community Health Assessment COUNTY HEALTH RANKINGS 2015 In the 2015 release of County Health Rankings, Orange County ranked 13th of 67 counties in terms of health outcomes and 18th in health factors. 76 Health outcome rankings are a combination of measures for length of life and quality of life. Orange County ranked 9th for length of life, but 24th for quality of life. This is due to poor rates of low birthweight infants, and average rates for individuals reporting poor or fair health, and the average count of poor physical and mental health days. Orange County’s Years of Potential Life Lost has been decreasing since 1997, signifying that fewer preventable deaths are occurring. The Health Factors ranking (next page) includes measures for health behaviors, clinical care, social and economic factors, and physical environment. While Orange ranks highly for health behaviors, average scores for clinical care and physical environment places Orange in the second quartile overall for health factors. Please see the table below for complete details. Orange County Top US Performers Florida Rank (of 67) Health Outcomes 13 Length of Life 9 Premature death 6,251 5,200 6,893 Quality of Life 24 Poor or fair health 15% 10% 16% Poor physical health days 3.3 2.5 3.7 Poor mental health days 3.2 2.3 3.8 Low birthweight 9% 5.9% 8.7%
  • 27. Florida Department of Health in Orange County ||27 2015 Orange County Community Health Assessment Orange County Top US Performers Florida Rank (of 67) Health Factors 18 Health Behaviors 10 Adult smoking 15% 14% 18% Adult obesity 25% 25% 26% Food environment index 6.8 8.4 7 Physical inactivity 23% 20% 23% Access to exercise opportunities 98% 92% 93% Excessive drinking 16% 10% 16% Alcohol-impaired driving deaths 29% 14% 29% Sexually transmitted infections 529 138 402 Teen births 35 20 36 Clinical Care 33 Uninsured 24% 11% 24% Primary care physicians 1,280:1 1,045:1 1,423:1 Dentists 2,248:1 1,377:1 1,874:1 Mental health providers 591:1 386:1 744:1 Preventable hospital stays 65 41 59 Diabetic monitoring 84% 90% 85% Mammography screening 62.3% 70.7% 67.7% Social & Economic Factors 20 High school graduation 74% 75% Some college 65.7% 71% 60.1% Unemployment 6.8% 4% 7.2% Children in poverty 26% 13% 25% Income inequality 4.5 3.7 4.6 Children in single-parent households 39% 20% 38% Social associations 7.2 22 7.3 Violent crime 730 59 514 Injury deaths 53 50 69 Physical Environment 33 Air pollution - particulate matter 10.9 9.5 11.4 Drinking water violations 0% 0% 6% Severe housing problems 25% 9% 22% Driving alone to work 80% 71% 80% Long commute - driving alone 38% 15% 38%
  • 28. Florida Department of Health in Orange County ||28 2015 Orange County Community Health Assessment REFERENCES 1. Orange County Florida Government. About Us. (2014). Retrieved December 10, 2014, from http://www.orangecountyfl.net/?tabid=120 2. Florida CHARTS. Orange County Health Profile. (2014). Retrieved December 10, 2014, from http://www.floridacharts.com/charts/mapp_report.aspx: 2012 data 3. Office of Economic and Demographic Research. Orange County. (2014, February 21). Retrieved December 17, 2014, from http://edr.state.fl.us/content/area-profiles/county/Orange.pdf 4. U.S. Census Bureau. Resident Population Data (Text Version). (2012). Retrieved December 10, 2014, from http://www.census.gov/2010census/data/apportionment-dens-text.php 5. County Health Rankings & Roadmap. Florida Rankings Data. (2014). Retrieved December 10, 2014, from http://www.countyhealthrankings.org/rankings/data/fl : Census Population Estimates, 2010 data 6. Clarke, S. (2013, June 13). Orlando tourism visitor count hits record for 3rd year. Retrieved December 10, 2014 from http://articles.orlandosentinel.com/2013-06-13/business/os-orlando-record-year-20130613_1_visit-orlando-george- aguel-head-count 7. Division of Public Health Statistics and Performance Management, Florida Department of Health. Orange County Health Profile. (2014). Retrieved December 10, 2014, from http://www.floridacharts.com/charts/mapp_report.aspx : 2012 data 8. Office of Economic and Demographic Research. Orange County. (2014, February 21). Retrieved December 10, 2014, from http://edr.state.fl.us/content/area-profiles/county/Orange.pdf 9. United States Census Bureau. 2008-2012 American Community Survey. Retrieved December 10, 2014, from http://factfinder2.census.gov/faces/tableservices/jsf/pages/productview.xhtml?src=bkmk 10. http://www.healthdata.org/sites/default/files/files/county_profiles/US/County_Report_Orange_County_Florida.pdf 11. U.S. Census Bureau. 2010 Census Data. (2012). Retrieved December 10, 2014, from http://www.census.gov/2010census/data/ 12. DATA (used in pie charts) from County Health Rankings & Roadmap. Florida Rankings Data. (2014). Retrieved December 10, 2014, from http://www.countyhealthrankings.org/rankings/data/fl : Census Population Estimates, 2012 data. 13. County Health Rankings & Roadmap. Florida Rankings Data. (2014). Retrieved December 10, 2014, from http://www.countyhealthrankings.org/rankings/data/fl : American Community Survey, 5-year estimates, 2008-2012 data 14. Orange County Florida Government. About Us. (2014). Retrieved December 10, 2014, from http://www.orangecountyfl.net/?tabid=120 15. County Health Rankings & Roadmap. Florida Rankings Data. (2014). Retrieved December 10, 2014, from http://www.countyhealthrankings.org/rankings/data/fl : HUD, Comprehensive Housing Affordability Strategy, 2006- 2010 data 16. Office of Economic and Demographic Research. Orange County. (2014, February 21). Retrieved December 10, 2014, from http://edr.state.fl.us/content/area-profiles/county/Orange.pdf 17. Statistically significant at a 90% confidence level for both high school graduation and bachelor’s degree attainment. 18. Office of Economic and Demographic Research. Orange County. (2014, February 21). Retrieved December 10, 2014, from http://edr.state.fl.us/content/area-profiles/county/Orange.pdf 19. Florida Department of Economic Opportunity. Local Area Unemployment Statistics. Retrieved December 10, 2014, from http://www.floridajobs.org/labor-market-information/data-center/statistical-programs/local-area- unemployment-statistics 20. Florida Department of Economic Opportunity. Employment Projections. Retrieved December 10, 2014, from http://www.floridajobs.org/labor-market-information/data-center/statistical-programs/employment-projections 21. Orlando Economic Development Commission. (2014). Orange County: About the Region. Retrieved December 18, 2014 from http://www.orlandoedc.com/Why-Orlando/About-the-Region/Orange-County.aspx 22. Orlando Economic Development Commission. (November 2014). Employment by Industry: Orlando MSA. Retrieved December 19, 2014 from: http://www.orlandoedc.com/MetroOrlando/media/Metro-Orlando/Data- Center/workforce/Employment-by-Industry.pdf?ext=.pdf 23. U.S. Census Bureau. Interactive SAIPE Data and Mapping Tool. (2014). Retrieved March 17, 2015, from http://www.census.gov/did/www/saipe/data/interactive/#view=StateAndCounty&utilBtn=CSV&yLB=0&stLB=10
  • 29. Florida Department of Health in Orange County ||29 2015 Orange County Community Health Assessment &cLB=0&dLB=0&gLB=0&usSts_cbSelected=false&usTot_cbSelected=true&stateTot_cbSelected=true&pLB=0&multi YearSelected=false&multiYearAlertFlag=false&prStateFlag=false&invalidSDYearsFlag=false 24. 90% confidence level, based on 2013 data 25. U.S. Census Bureau. Interactive SAIPE Data and Mapping Tool. (2014). Retrieved December 10, 2014, from http://www.census.gov/did/www/saipe/data/interactive/#view=StateAndCounty&utilBtn=CSV&yLB=0&stLB=10 &cLB=0&dLB=0&gLB=0&usSts_cbSelected=false&usTot_cbSelected=true&stateTot_cbSelected=true&pLB=0&multi YearSelected=false&multiYearAlertFlag=false&prStateFlag=false&invalidSDYearsFlag=false 26. 90% Confidence Intervals- Orange County: (16.8, 19.4), United States: (15.8, 16.0) 27. U.S. Census Bureau. Interactive SAIPE Data and Mapping Tool. (2014). Retrieved December 16, 2014, from http://www.census.gov/did/www/saipe/data/interactive/#view=StateAndCounty&utilBtn=CSV&yLB=0&stLB=10 &cLB=0&dLB=0&gLB=0&usSts_cbSelected=false&usTot_cbSelected=true&stateTot_cbSelected=true&pLB=0&multi YearSelected=false&multiYearAlertFlag=false&prStateFlag=false&invalidSDYearsFlag=false 28. 90% Confidence Level 29. County Health Rankings & Roadmap. Florida Rankings Data. (2014). Retrieved December 10, 2014, from http://www.countyhealthrankings.org/rankings/data/fl : National Center for Education Statistics, 2011 data 30. County Health Rankings & Roadmap. Florida Rankings Data. (2014). Retrieved December 10, 2014, from http://www.countyhealthrankings.org/rankings/data/fl 31. County Health Rankings & Roadmap. Florida Rankings Data. (2014). Retrieved December 10, 2014, from http://www.countyhealthrankings.org/rankings/data/fl : Small Area Health Insurance Estimates, 2011 data 32. County Health Rankings & Roadmap. Florida Rankings Data. (2014). Retrieved December 10, 2014, from http://www.countyhealthrankings.org/rankings/data/fl 33. County Health Rankings & Roadmap. Florida Rankings Data. (2014). Retrieved December 10, 2014, from http://www.countyhealthrankings.org/rankings/data/fl 34. Council on Homelessness, Department of Children and Families. (June, 2013). Council on Homelessness 2013 Report. Retrieved December 18, 2014 from http://www.dcf.state.fl.us/programs/homelessness/docs/2013CouncilReport.pdf 35. The U.S. Department of Housing and Urban Development, Office of Community Planning and Development. The 2013 Annual Homeless Assessment Report (AHAR) to Congress: Part 1 Point-in-Time Estimates of Homelessness. Retrieved December 18, 2014 from https://www.hudexchange.info/resources/documents/ahar-2013-part1.pdf 36. Ranking based on total number of deaths, not mortality rate per 100,000. 37. Office of Health Statistics and Assessment, Florida Department of Health. Orange County Major Causes of Death for 2013. Retrieved March 27, 2015, from http://www.floridacharts.com/charts/DisplayHTML.aspx?ReportType=7226&County=48&year=2013&tn=33 38. Office of Health Statistics and Assessment, Florida Department of Health. Florida Major Causes of Death for 2013. Retrieved March 17, 2015, from http://www.floridacharts.com/charts/DisplayHTML.aspx?ReportType=7226&County=69&year=2013&tn=33 39. National Center for Health Statistics, Centers for Disease Control and Prevention. 10 Leading Causes of Death by Age Group, United States 2012. Retrieved March 18, 2014 from http://www.cdc.gov/nchs/fastats/leading-causes-of- death.htm 40. Office of Health Statistics and Assessment, Florida Department of Health. Orange County: All Cancers Deaths, retrieved December 17, 2014 from http://www.floridacharts.com/charts/DataViewer/DeathViewer/DeathViewer.aspx?indNumber=0097 41. Healthy People 2020. 2020 Topics & Objectives. Retrieved March 18,2015 from http://www.healthypeople.gov/2020/topicsobjectives2020/default 42. Florida Department of Health. Florida Annual Cancer Report, 2011. Retrieved January 7, 2015 from http://fcds.med.miami.edu/inc/annual/2011/Table_No_T16_(2011).pdf 43. Office of Health Statistics and Assessment, Florida Department of Health. Orange County: Heart Disease Deaths, retrieved December 29, 2014 from http://www.floridacharts.com/charts/DataViewer/DeathViewer/DeathViewer.aspx?indNumber=0098 44. Office of Health Statistics and Assessment, Florida Department of Health. Orange County: Unintentional Injuries Deaths, retrieved December 30, 2014 from http://www.floridacharts.com/charts/DataViewer/DeathViewer/DeathViewer.aspx?indNumber=0109 45. Office of Health Statistics and Assessment, Florida Department of Health. Orange County: Stroke Deaths, retrieved January 5, 2015 from http://www.floridacharts.com/charts/DataViewer/DeathViewer/DeathViewer.aspx?indNumber=0086
  • 30. Florida Department of Health in Orange County ||30 2015 Orange County Community Health Assessment 46. Office of Health Statistics and Assessment, Florida Department of Health. Orange County: Chronic Lower Respiratory Disease (CLRD) Deaths, retrieved January 3, 2015 from http://www.floridacharts.com/charts/DataViewer/DeathViewer/DeathViewer.aspx?indNumber=0088 47. Office of Health Statistics and Assessment, Florida Department of Health. Orange County: Diabetes Deaths, retrieved January 2, 2015 from http://www.floridacharts.com/charts/DataViewer/DeathViewer/DeathViewer.aspx?indNumber=0090 48. Office of Health Statistics and Assessment, Florida Department of Health. Orange County: Alzheimer’s Disease Deaths, retrieved January 5, 2015 from http://www.floridacharts.com/charts/DataViewer/DeathViewer/DeathViewer.aspx?indNumber=0349 49. Office of Health Statistics and Assessment, Florida Department of Health. Orange County: Suicide (All Means) Deaths, retrieved January 5, 2015 from http://www.floridacharts.com/charts/DataViewer/DeathViewer/DeathViewer.aspx?indNumber=0116 50. Office of Health Statistics and Assessment, Florida Department of Health. Orange County: Infant Deaths, retrieved March 18, 2015 from http://www.floridacharts.com/charts/DataViewer/InfantDeathViewer/InfantDeathViewer.aspx?indNumber=0053 51. Significance is at the .05 level, taken from Florida Department of Health’s report “Infant mortality and low birth weight actual rates compared to expected rates by county for Florida 2013”, retrieved March 26, 2015 from http://www.floridahealth.gov/diseases-and-conditions/infant-mortality-and-adverse-birth- outcomes/data/expectedvsactual2013.pdf 52 Office of Health Statistics and Assessment, Florida Department of Health. Orange County: Maternal Deaths, retrieved March 31, 2015 http://www.floridacharts.com/charts/DataViewer/InfantDeathViewer/InfantDeathViewer.aspx?indNumber=0392 53. Division of Public Health Statistics and Performance Management, Florida Department of Health. Orange County: Deaths from Motor Vehicle Crashes, retrieved March 25, 2015 from http://www.floridacharts.com/charts/InjuryAndViolence/ 54. Smart Growth America. “Dangerous by Design 2014- Regional Data”. Retrieved March 25, 2015 from http://www.smartgrowthamerica.org/research/dangerous-by-design/dbd2014/regional-data. 55. Florida Department of Law Enforcement. “UCR Offense Data”. Retrieved March 25, 2015 from http://www.fdle.state.fl.us/Content/getdoc/8c4ed844-de81-4551-a10e-7eb31e76def0/UCR-Offense-Data.aspx 56. Orange County Head Start Division, Administration for Children and Families, U.S. Department of Health and Human Services. 2014 Community Assessment (Update). Retrieved December 18, 2014 from http://www.orangecountyfl.net/Portals/0/resource%20library/families%20-%20health%20- %20social%20svcs/Community%20Assessment.pdf 57. Office of Health Statistics and Assessment, Florida Department of Health. Orange County: Total Resident Live Births, retrieved March 27, 2015 from http://www.floridacharts.com/charts/DataViewer/BirthViewer/BirthViewer.aspx?cid=0025 58. Office of Health Statistics and Assessment, Florida Department of Health. Orange County: Preterm Births, retrieved March 18, 2015 from http://www.floridacharts.com/charts/DataViewer/BirthViewer/BirthViewer.aspx?cid=0473 59. County Health Rankings & Roadmap. Florida Rankings Data. (2014). Retrieved December 10, 2014, from http://www.countyhealthrankings.org/rankings/data/fl : National Center for Health Statistics, 2005-2011 data 60. http://www.floridahealth.gov/diseases-and-conditions/cancer/_documents/florida-cancer-plan.pdf 61. Florida Department of Health Orange County, Florida: Chronic Disease Profile. Retrieved March 27, 2015 from http://www.floridacharts.com/charts/DisplayHTML.aspx?ReportType=7244&County=48&year=2013&tn=32 62. World Health Organization. Obesity and overweight. (2014, August). Retrieved December 10, 2014, from http://www.who.int/mediacentre/factsheets/fs311/en/ 63. America’s Health Rankings, United Health Foundation. Obesity in the United States. Retrieved December 17, 2014 from http://www.americashealthrankings.org/ALL/Obesity 64. Florida Department of Health. Healthiest Weight. (2014, April 25). Retrieved December 10, 2014, from http://www.healthiestweightflorida.com/ 65. Division of Public Health Statistics and Performance Management, Florida Department of Health. Orange County-State Profile. (2014). Retrieved December 10, 2014, from http://www.floridacharts.com/charts/SpecReport.aspx?RepID=7200&tn=25 : 2012 data 66. Chronic Disease Section, Bureau of Epidemiology, Division of Disease Control and Health Protection, Florida Department of Health. 2010 Orange County, Florida Communities Putting Prevention to Work (CPPW) Behavioral Risk Factor Surveillance System (BRFSS) Data Report. Retrieved December 17, 2014 from
  • 31. Florida Department of Health in Orange County ||31 2015 Orange County Community Health Assessment http://www.floridahealth.gov/statistics-and-data/survey-data/cppw/orange-cppw/_documents/2010-orange- report.pdf 67. County Health Rankings & Roadmap. Florida Rankings Data. (2014). Retrieved December 10, 2014, from http://www.countyhealthrankings.org/rankings/data/fl : National Center for Chronic Disease Prevention and Health Promotion, 2010 data 68. County Health Rankings & Roadmap. Florida Rankings Data. (2014). Retrieved December 10, 2014, from http://www.countyhealthrankings.org/rankings/data/fl : OneSource Global Business Browser, Delorme map data, ESRI, and US Census Tigerline Files, 2010 and 2012 data 69 Community Commons Community Health Needs Assessment Report produced March 31, 2105. Accessible via http://assessment.communitycommons.org/CHNA/OpenReport.aspx?id=165775 70. Florida CHARTS. Orange County-State Profile. (2014). Retrieved December 10, 2014, from http://www.floridacharts.com/charts/SpecReport.aspx?RepID=7200&tn=25 : 2012 data 71. Florida Department of Health, Division of Disease Control and Health Protection. “Florida HIV/AIDS Annual Report 2013”. Retrieved March 27, 2015 from http://www.floridahealth.gov/diseases-and- conditions/aids/surveillance/epi-profiles/HIVAIDS-annual-morbidity-2013.pdf 72. Florida Department of Health. Florida CHARTS. “Chlamydia Cases”. Retrieved March 27, 2015 from http://www.floridacharts.com/Charts/OtherIndicators/NonVitalIndNoGrpDataViewer.aspx?cid=0145 73. Florida Department of Health. Florida CHARTS. Tuberculosis Cases and Deaths. Retrieved March 27, 2015 from http://www.floridacharts.com/Charts/OtherIndicators/NonVitalIndNoGrpDataViewer.aspx?cid=0148 74. All data is from 2007-2012 and is taken from Florida Department of Health. Florida CHARTS. “Orange County, Florida Minority Health Profile-Black”. Retrieved March 27, 2015 from http://www.floridacharts.com/Charts/MinorityReport.aspx?ProfileYear=2012&county=48&tn=424 75. All data is from 2007-2012 and is taken from Florida Department of Health. Florida CHARTS. “Orange County, Florida Minority Health Profile-Hispanic”. Retrieved March 31, 2015 from http://www.floridacharts.com/charts/MinorityReportHisp.aspx?ProfileYear=2012&county=48&tn=425 76. County Health Rankings & Roadmap. Florida Rankings Data. (2015). Retrieved March 31, 2015, from http://www.countyhealthrankings.org/rankings/data/fl.