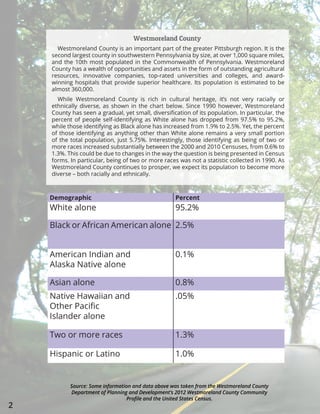
1
Confronting the Challenge
of Diversity in
Westmoreland County
A Report to the Community
June 2015
2
Westmoreland County is an important part of the greater Pittsburgh region. It is the
second largest county in southwestern Pennsylvania by size, at over 1,000 square miles,
and the 10th most populated in the Commonwealth of Pennsylvania. Westmoreland
County has a wealth of opportunities and assets in the form of outstanding agricultural
resources, innovative companies, top-rated universities and colleges, and award-
winning hospitals that provide superior healthcare. Its population is estimated to be
almost 360,000.
While Westmoreland County is rich in cultural heritage, it’s not very racially or
ethnically diverse, as shown in the chart below. Since 1990 however, Westmoreland
County has seen a gradual, yet small, diversification of its population. In particular, the
percent of people self-identifying as White alone has dropped from 97.5% to 95.2%,
while those identifying as Black alone has increased from 1.9% to 2.5%. Yet, the percent
of those identifying as anything other than White alone remains a very small portion
of the total population, just 5.75%. Interestingly, those identifying as being of two or
more races increased substantially between the 2000 and 2010 Censuses, from 0.6% to
1.3%. This could be due to changes in the way the question is being presented in Census
forms. In particular, being of two or more races was not a statistic collected in 1990. As
Westmoreland County continues to prosper, we expect its population to become more
diverse – both racially and ethnically.
Westmoreland County
Demographic Percent
White alone 95.2%
Black or African American alone 2.5%
American Indian and
Alaska Native alone
0.1%
Asian alone 0.8%
Native Hawaiian and
Other Pacific
Islander alone
.05%
Two or more races 1.3%
Hispanic or Latino 1.0%
Source: Some information and data above was taken from the Westmoreland County
Department of Planning and Development’s 2012 Westmoreland County Community
Profile and the United States Census.
3
4
5-7
7-9
10-12
13-14
15
16-18
	19
Introduction, Study Design and Goals of the Study
Who Responded?
Perceptions
Personal Experience
Neighborhood Perceptions
Improving Race Relations
Business Perceptions
Acknowledgments
Table of Contents
Authors:
Carlotta Paige
Cheri Cavanaugh
Layout and Design:
Shelby Kyllo
For more information about this report, call Westmoreland
Community Action at 724-834-1260, ext. 153
4
Introduction
Study Design
Confronting the challenge of Diversity is the first
study of racial diversity in Westmoreland County.
The study is the product of collaboration between
Paige Community Coordinators, Westmoreland
Community Action, the sponsoring agency, and
Seton Hill University. Vibrant Pittsburgh’s Mini
Grant Program provided the initial funding. The
research team included five faculty members from
Seton Hill University plus representatives from
PCC and WCA. A Guiding Coalition with a broad
cross-section of stakeholders representing various
sectors of the community gave input and guidance;
some contributed additional funding, served as
facilitators for focus groups and provided space
for focus group sessions. This report presents
key findings of the study. It is hoped that this
The study began with a series of focus groups
and interviews with key individuals, selected based
on census data and other variables to represent,
as far as possible, different segments of socio-
economic and racial characteristics. The purpose
of the focus group/interview phase was to collect
information that would assist in the design of a
community survey. A total of 12 focus groups were
completed in December 2013: six with whites and
six with minorities, with members from a dozen
Westmoreland County zip codes. Eleven interviews
were completed with individuals representative of
business (five), government (four), education, and
information will stimulate discussion and result
in a collaborative effort to support change that
strengthens the cultural, social, and economic
fabric of Westmoreland County.
In this report, the terms white and minority
are used. The term minority is used strictly in the
numeric sense. It is acknowledged that there are
sometimes negative connotations to the word
“minority”, these meanings are not intended.
Because the number of racial minorities who
responded to the survey was so small compared to
the number of white respondents, statistical testing
between the two groups was not appropriate. We
chose to simply present the comparisons reported
here in terms of percentages by group.
clergy (one each).
Once data from the focus groups were
assessed, a survey was constructed to elicit
responses from everyone in the County who
was willing to participate. Information sought
pertained to the awareness of issues related to
diversity, distinguishing perception from fact
about diversity, and identifying beliefs that impact
on how welcoming the County is to minorities.
A paper-and-pencil version of the survey was
also available. The survey was active during the
month of June 2014. Initial analysis of results was
completed over the following six months.
Goals of the Study
The goals of the study were to identify and measure attitudes about racial diversity in the County, and
to make recommendations and initiate strategies to help strengthen the cultural and commercial fabrics
of the region.
5
Location of Respondents
Who Responded?
One thousand two hundred and six people filled
out the survey. The number of those responding
to each question varied by question. All of the
percentages are for the number who chose that
answer, divided by the total number responding to
the question.
Those responding were 92.7% white and 7.3%
minority. Of the minority respondents compared
with all respondents to this question, 5.7% said
they were Black/African-American, 1% American
Indian or Alaskan native, .1% Chinese, and .2%
other Asian. There was a higher percent of minority
respondents to the survey than the percent of
minority residents in the County (7.3% compared
with 4.9%).
The mean age was 50 for both white and minority
respondents and 73% were female and 27% male.
A higher percent of survey respondents were more
female than the County population (51.9%). Overall
92.6% of respondents live in the County and 81.1%
work here. Because the survey was voluntary,
the respondents would not be expected to mirror
the composition of the county, and indeed, the
respondents to this survey were disproportionately
minority, more highly educated, more female, with
higher annual incomes, and more are registered
Democratic than the population of the county.
There was also a higher percent of minority
business owners than for the county as a whole.
15012
15062
15068
15072
15085
15087
15089
15131
15137
15146
15448
15479
15501
15531
15601
15610
15611
15612
15613
15615
15616
15617
15618
15620
15621
15622
15623
15624
15625
15626
15627
15628
15632
15633
15634
15635
15636
15637
15638
15639
15640
15642
15644
15646
15647
15650
15655
15656
15658
15660
15661
15662
15663
15665
15666
15668
15670
15671
15672
15675
15676
15677
15678
15679
15680
15681
15683
15684
15687
15688
15689
15690
15691
15692
15693
15695
15697
15698
15717
15779
15923
15944
15954
16229
Westmoreland
Adamsburg
Allegheny
Arnold
Arona
Avonmore
Bell
Bolivar
Cook
Delmont
Derry
Derry
Donegal
Donegal
East
Huntingdon
East
Vandergrift
Export
Fairfield
Greensburg
Hempfield
Hunker
Hyde
Park
Irwin
Jeannette
Latrobe
Laurel
Mountain
Ligonier
Ligonier
Lower
Burrell
Loyalhanna
Madison
Manor
Monessen Mount
Pleasant
Mount
Pleasant
Murrysville
New
Alexandria
New
Florence
New
Kensington
New
Stanton
North
Huntingdon
North
Irwin
Oklahoma
Penn
Penn
Rostraver
St.
Clair
Salem
Scottdale
Seward
Sewickley
Smithton
South
Greensburg
South
Huntingdon
Southwest
Greensburg
Sutersville
Trafford
Unity
Upper
Burrell
Vandergrift
Washington
West
Leechburg
West
Newton
Youngstown
Youngwood
Responses by Zip Code
Westmoreland County
Westmoreland County ZCTAs
Prepared by:
The Pennsylvania State Data Center
http://pasdc.hbg.psu.edu/
Source: Survey data supplied by:
Paige Community Coordinators, LLC
Legend
1 Dot = 1
White
Minority
White respondents were from 101 zip codes and minority were from 18. The map below shows
geographic distribution for white and minority respondents.
6
therespondents
Own or run a business in Westmoreland County
10.5% of all respondents reported owning or running a business in Westmoreland County. When
broken down by race, 9.8% of white respondents reported owning or running a business in the county,
compared with 10.5% of minority respondents. The percent of minority respondents owning or running
a business is higher than that for the county as a whole (2.8% in 2007).
Annual Household Income of Respondents
0
5
10
15
20
25
30
The median annual household
income for Westmoreland
County in 2013 was $50,736.
Survey respondents had higher
median incomes at $50-75,000.
Of survey respondents, as this
chart illustrates, there were
relatively more minorities in
the lower income brackets and
relatively more whites in the
upper income brackets. Whites
and minorities in the $35-50,000
and $75-$250,000 brackets
earned similar amounts.
percent
under$15,000
$15,000-24,999
$25,000-34,999
$35,000-49,999
$50,000-74,999
$75,000-99,999
$250,000+
Relationship Status of Respondents
Married
Widowed
Divorced
Separated
Never Married
Cohabiting
Long-term
Relationship
This chart shows the
relationship status of the
respondents. 53% of all
respondents reported being
married. The chart shows
the other categories as well.
Minority
White
0 10 20 30 40 50 60
46%
5.7%
18.4%
3.4%
20.7%
3.4%
2.3%
59.5%
5.4%
13.2%
1.7%
12.6%
1.9%
5.7%
No schooling
completed
High
school
diploma
GED or
alterna-
tive
Some
college
credit
1ormoreyearsof
college-
no degree
Asso-
ciate’s
degree
Bachelor’s
degree
Master’s
degree
Profession-
al degree
beyond a
master’s
Doctorate
degree
4 6 8 91 14 35 119 119 324 234
1 8 2 2 8 13 22 22 2 6
Highest Level of School Completed by Respondents
With regard to education, the survey respondents compared with the county, reported a higher level of
formal education. For example, 30.9% of the respondents reported having a bachelors degree, versus 25.3%
for all County residents, according to the latest US Census data. This chart illustrates the highest level of
education completed by white and minority respondents.
$100,000-249,999
7
perceptions
Perceptions of the Respondents about Diversity in
Westmoreland County
Survey respondents were asked to answer
questions about their perceptions of Westmoreland
County, their personal experiences and self-
reflections about race relations in the County.
The information to follow suggest that a greater
percentage of the racial minorities who responded
to the survey have had personal exposure to racism
and discrimination than was the case for the white
respondents. It is not surprising, therefore, that the
minority respondents would have unique perceptions
of the challenges to racial diversity in Westmoreland
County. Indeed, the data suggests that compared
to the white respondents, a greater percentage of
minorities do not feel that Westmoreland County
is welcoming to, or accepting of, racial minorities.
Moreover, a greater percentage of minorities feel
that racial discrimination is a continuing problem in
Westmoreland County.
Survey Responses
That said, minority and white respondents
also shared significant points of agreement. Both
groups agreed that it was important to improve
race relations in the County, and both groups
indicatedsignificantsupportforseveralstrategies
to achieve this goal. In particular, over half of
both groups supported the encouragement
of increasing children’s exposure books about
people of color, as well as the broader goal of
providing general enrichment programs for
children in the community. Programs to increase
parental involvement in children’s education,
to increase community engagement, and to
encourage conversations about issues of race
were also strongly supported by both minority
and white respondents
Minority respondents tended to disagree
more than whites that there is a benefit
from living in a community where
diversity is present, although in the “agree
somewhat” and “strongly agree” categories,
these differences were reversed.
Do you and your family benefit from being in a community with people who are different from you?
Strongly
Disagree
Disagree
Disagree
Somewhat
Neither Agree
nor Disagree
Agree
Somewhat
Agree
0 5 10 15 20 25 30
Strongly
Agree
4.8%
2.6%
7.2%
3.7%
9.6%
2.7%
16.9%
25%
15.7%
13.6%
20.5%
29.9%
25.3%
Minority White
22.4%
Key:
Political Affiliation of Respondents
Overall, 60.4% of the respondents reported being registered Democratic, 28% Republican, and 11.4%
independent or other. The respondents to the study were more Democratic than registered voters in
Westmoreland County, and less Republican, when compared to the County data as of June 2014. A higher
percent of white respondents identified as Republican than minority respondents; conversely, a higher percent
of minority respondents identified as Democrats, compared with white respondents.
Democratic Republican Constitution Libertarian Green Independent
White 58.8% 29.7% 0.9% 0.2% 0.3% 10.1%
Minority 79.7% 8.9% 0% 0% 0% 11.4%
8
perceptions
Strongly
Disagree
Disagree
Disagree
Somewhat
Neither Agree
nor Disagree
Agree
Somewhat
Agree
Strongly
Agree
Minority respondents selected
“agree” or “strongly agree” more
than white respondents (55.1%
compared to 38.1%). The percent
of all respondents, both white and
minority, who disagreed or strongly
disagreed, was low.
Increasing numbers of minorities moving into the County would be good for Westmoreland County.
0 5 10 15 20 25 30 35
The vast majority of respondents
agreed that “interacting and
forming relationships with diverse
populations helps bring people
together.” The largest difference
was that minority respondents
selected “agree” or “strongly agree”
more than white respondents.
More whites than minorities,
18.6% versus 4%, “agreed” or
“strongly agreed” that the County
is welcoming to minorities,
while more minorities disagreed
somewhat or strongly disagreed
that the county is welcoming.
Interacting with and forming relationships with diverse populations helps bring people together
Is Westmoreland County welcoming to racial minorities?
Strongly
Disagree
Strongly
Disagree
Disagree
Disagree
Disagree
Somewhat
Disagree
Somewhat
Neither Agree
nor Disagree
Neither Agree
nor Disagree
Agree
Somewhat
Agree
Somewhat
Agree
Agree
Strongly
Agree
Strongly
Agree
0 5 10 15 20 25 30
0 10 20 30 40 50
31.8% of white respondents responded that this is true, compared with 59% of minority respondents.
Are there places in the County that do not allow racial minorities?
Yes Responses No Responses
White 31.8% 286 68.2% 613
Minority 59% 46 41% 32
3.8%
3.8%
3.8%
5.9%
2.5%
6.2%
17.5%
30.8%
17.5%
15.3%
23.8%
20.9%
31.3%
17.2%
1.3%
2.5%
1.1%
1.5%
1.3%
1.9%
6.8%
13.0%
11.3%
17.0%
32.5%
35.1%
45.0%
30.2%
16.0%
4.1%
10.7%
10.9%
28.0%
19.9%
18.7%
23.8%
22.7%
22.6%
2.7%
16.6%
1.3%
2.0%
9
perceptions
White respondents tended to agree more
that the County is accepting of racial
minorities than minority respondents
do. Of those who “agree” or “strongly
agree” with this statement, 18.8% were
white and only 5.4% minority; the reverse
was true for the “strongly disagree”
and “disagree” responses (16.6% white
versus 28% minority).
Is Westmoreland County accepting of racial minorities?
0 5 10 15 20 25
Strongly
Disagree
Disagree
Disagree
Somewhat
Neither Agree
nor Disagree
Agree
Somewhat
Agree
Strongly
Agree
More minority respondents than
white respondents said that they
“strongly disagree” or “disagree” that
Westmoreland County is racially
integrated. Only 10.3% of white
respondents reported that they “agree”
or “strongly agree” that the County
is racially integrated, similar to 8% of
minority respondents.
More minority respondents than white
respondents agreed or strongly agreed
that discrimination is a continuing
problem. When “agree somewhat”
responses are included, white and
minority respondents are a little closer
(49.6% of white respondents agreed
somewhat, agreed, or strongly agreed,
compared with 62.2% of minority
respondents.)
Do you think Westmoreland County is racially integrated?
Is discrimination a continuing problem in Westmoreland County?
0 5 10 15 20 25
0 5 10 15 20 25 30
Strongly
Disagree
Strongly
Disagree
Disagree
Disagree
Disagree
Somewhat
Disagree
Somewhat
Neither Agree
nor Disagree
Neither Agree
nor Disagree
Agree
Somewhat
Agree
Somewhat
Agree
Agree
Strongly
Agree
Strongly
Agree
Nearlyhalfofwhiterespondentsreported
having “never” or “rarely” witnessed racial
discrimination, compared with less than
one quarter of minority respondents.
In contrast, just a little over ten percent
of white respondents reported having
“frequently”or“regularly”witnessedracial
discrimination, compared with over a
thirdofminorityrespondents. Responses
of “occasionally” or “sometimes” were
similar for both groups.
How often have you witnessed racial discrimination in Westmoreland County?
0 5 10 15 20 25 30 35
Never
Rarely
Occasionally
Sometimes
Frequently
Regularly
14.7%
4.1%
13.3%
12.5%
24.0%
20.2%
24.0%
19.9%
18.7%
24.5%
2.7%
17.2%
2.7%
1.6%
22.7%
9.7%
22.7%
17.8%
22.7%
22.0%
14.7%
19.4%
9.3%
20.7%
4.0%
9.0%
4.0%
1.3%
9.5%
4.9%
4.1%
9.7%
5.4%
10.4%
18.9%
25.4%
16.2%
24.4%
28.4%
18.5%
17.6%
6.7%
8.9%
12.8%
10.1%
31.7%
21.5%
22.2%
24.1%
23.0%
20.3%
8.4%
15.2%
1.8%
10
personalexperience
Two questions were asked giving the following examples and whether they
represent discrimination or not:
1. Locking your car door when men of color cross
the street:
61.7% of white respondents said this was
“definitely” or “probably” discrimination,
compared with 81.3% of minority respondents.
2. Racial epithets written on buildings :
95.2% of white respondents said this was
“definitely” or “probably” discrimination,
compared with 93.7% of minority respondents.
0
10
20
30
40
50
0
20
40
60
80
100
0
10
20
30
40
0
20
40
60
80
100
Definitely DefinitelyProbably ProbablyProbably
Not
Probably
Not
Definitely
Not
Definitely
Not
Minorities reported being more likely
to “frequently” or “regularly” talk with
close friends about racial prejudice
than whites. In contrast, whites were
more likely to “never” or “rarely” talk
to close friends about racial prejudice
than minorities.
How often do you talk about racial prejudice with close friends?
0 5 10 15 20 25 30 35
Never
Rarely
Occasionally
Sometimes
Frequently
Regularly
6%
11.3%
16.7%
30.8%
22.6%
23.7%
23.8%
22.8%
22.6%
9.3%
8.3%
2.1%
More than one-third of minorities
reported “frequently” or “regularly”
talking about racism they have
experienced or observed, compared
with only 11.3% of whites. In contrast,
white respondents were more likely to
“never” or “rarely” talk about racism.
How often do you talk about racism you have experienced/observed?
Never
Rarely
Occasionally
Sometimes
Frequently
Regularly
4.9%
10.3%
15.9%
30.6%
20.7%
27.4%
24.4%
20.4%
24.4%
9.1%
9.8%
2.2%
0 5 10 15 20 25 30 35
A remarkably higher percent of minorities
reported feeling that they are treated differently
when seeking health care than whites.
Overall, more than 80% of respondents thought
that younger people were much more or
somewhat more accepting of diversity.
Are you treated differently when seeking
health care than other racial groups?
Who is more accepting of diversity: younger
or older people, or is there no difference?
22.9%
50%
31.3%
11.3%
7.5% 8.9%
2.5% 3.8%
84.8%
38.8%
26.3%
12% 18.4%
3.1% 1.7%
76.8%
11
personalexperience
How many of your co-workers are minorities?
Minority Co-workers of
White Respondents
Minority Co-workers of
Minority Respondents
1-5
None
6-10
More than 10
The answers for white and minority respondents were fairly similar. The largest difference
was for the range of 1-5 co-workers, where 43.5% of the white respondents reported working
with minority co-workers, compared with 51.4% of minority respondents who work with
minority co-workers.
51.4%43.5%
31.1%40%
9.5%9.4%
8.1%7%
How many of your close friends are minorities?
Minority Close Friends of
White Respondents
Minority Close Friends of
Minority Respondents
1-5
None
6-10
More than 10
White respondents were more likely to report that they had five or fewer close friends who
were minorities than did minority respondents. In contrast, more minority respondents
reported having more than 10 close friends who are minorities than did white respondents.
52.5%
28%
48%
10.7%
13.3%
34%
6.5%
7%
Minorities reported feeling accepted somewhat less than whites, but not dramatically so.
Do you feel accepted as friends/co-workers/neighbors by those of other races?
Strongly disagree
or disagree
Disagree somewhat, neigher agree
nor disagree, or agree somewhat
Agree or strongly agree
White 1.7% 38.6% 59.8%
Minority 6.5% 40.4% 53.3%
12
personalexperience
Minority respondents reported being reminded about their race much more often than white
respondents. 27.8% of minorities reported being frequently or regularly reminded about
their race, compared with 6.8% of white respondents.
How often are you reminded about your race?
Never or Rarely Occasionally or Sometimes Frequently or
Regularly
White 70.1% 23.1% 6.8%
Minority 31.6% 40.5% 27.8%
More minorities than whites reported being treated differently at work than members of other
racial groups.
Do you feel you are treated differently at work than members of other racial groups?
Yes No
White 11.4% 88.6%
Minority 29.1% 70.9%
A higher percent of minority respondents reported having taken action in various ways than white
respondents. Trying to learn more about another culture was slightly higher for whites than
minorities, and expecting others to learn about their culture was higher for minorities than whites.
Respondents were asked if they had ever done any of the following:
White Minority
Changed how you talk to
someone who was a
different race
13.4% 26.1%
Changed how you dressed
around people of a different
race
1% 9.1%
Put more effort into finding/
keeping a job than someone
of another race
6.2% 25.0%
Lost a job because of
your race
1.4% 12.5%
Tried to learn more about
another culture
58.4% 54.5%
Expected others to learn more
about your culture
11.6% 27.3%
A much higher percent of minority respondents reported personally witnessing or being
aware of events in Westmoreland County than white respondents.
Personally witnessed or are aware of happening in Westmoreland County:
White Minority
Racial Profiling 27.2% 55.7%
A minority is followed/
watched carefully in a store
29.1% 62.5%
A person is stopped in their
vehicle because of race
13% 42%
13
neighborhoodperceptions
The “typical” minority community was viewed as
less positive by minority respondents than white
respondents in every category, believing that they
are more likely to be characterized by high crime
rates, single parent female head of households, more
low or no income workers/families than middle to low
income, abandoned homes, and the selling of drugs.
Both groups agreed that the “typical” minority
community has a low rate of owner occupied homes,
a high rate of alcoholism, and a lack of housing stock
that is fair market priced. For other characteristics,
minorities viewed the minority community as less
positive; for example, a higher percent of minorities
responded that there were fewer two parent
households. A lower percent of minorities thought
that there were enough public services like garbage
pickup and street cleaning, and the same was true for
slow response times for police and fire. More than
half of the minority respondents believed that there
was “appreciation for the benefits of education” in the
minority community, versus a little more than one
third of white respondents. Both groups agreed that
a strong sense of community is present in a “typical”
minority community.
Minority Community
Characteristic Minority White
Enough services are provided
(e.g., garbage, street cleaning)
26.1% 42.7%
High crime rate 68.2% 61.8%
Strong sense of community
(neighbors know each
other and associate
with each other)
55.7% 50.3%
Appreciation for the benefits
of education
51.1% 34%
Middle to low income
workers and families
75% 58.8%
Low or no income families 77.3% 65.2%
Two parent households 34.1% 23.5%
Single parent households
-male head of household
38.6% 21.9%
Single parent households
-female head of household
78.4% 64.9%
Fair market home prices 20.5% 23.8%
Owner occupied homes 15.9% 15.5%
Abandoned homes 71.6% 63.2%
Slow police and fire response
times
67% 39.8%
Drugs being sold 75% 66.3%
Gang-free zones 23.9% 16.2%
Domestic violence 62.5% 60.9%
High rate of alcoholism 51.1% 52.6%
Respondents were asked about two “typical” communities, one with mostly
minority residents, and the other with mostly white residents.
14
neighborhoodperceptions
Characteristic Minority White
Enough services are provided
(e.g., garbage, street cleaning)
77.3% 66.6%
High crime rate 21.6% 13.2%
Strong sense of community
(neighbors know each
other and associate
with each other)
63.6% 51%
Appreciation for the benefits
of education
72.7% 64.7%
Middle to low income
workers and families
58% 58%
Low or no income families 39.8% 34.3%
Two parent households 73.9% 60.6%
Single parent households
-male head of household
50% 40.1%
Single parent households
-female head of household
36.4% 38%
Fair market home prices 68.2% 56.5%
Owner occupied homes 76.1% 65.1%
Abandoned homes 13.6% 18.9%
Slow police and fire
response times
13.6% 14.8%
Drugs being sold 45.5% 43.9%
Gang-free zones 56.8% 44.8%
Domestic violence 64.8% 55%
High rate of alcoholism 67% 52.6%
White Community
Formostcategories,therespondents’perceptionsofthe
“typical”whitecommunityweremorepositivethanforthe
“typical”minoritycommunity;forexample,thatthereare
more services and a lower crime rate.
Minoritiestendedtoviewthewhitecommunityasmore
positivethandidwhiterespondents.Inevaluating“typical”
whitecommunities,ahigherpercentofminoritythanwhite
respondentsreportedabeliefthatwhitecommunitieshave
astrongsenseofcommunity,publicservicesprovided,
appreciationforthebenefitofeducation,andtwoparent
households.Morethanhalfofboththewhiteandminority
respondentsagreedthatthewhitecommunityhasmore
middletolowincomeworkersorfamilies,comparedtolow
or no income workers or families.
The “typical” white community is viewed by more
minorityrespondentsthanwhiterespondentsashaving
owner-occupiedhomesthatarefairmarketpriced.The
whitecommunityisviewedalsobyminorityrespondentsas
havinggang-freezonesmorethanthewhiterespondents.
A higher number of minority respondents viewed the
white community as characterized by the selling of
drugs,domesticviolence,andalcoholismthandidwhite
respondents.
15
racerelations
Strategies to improve race relations in the County
Improving Race Relations in
Westmoreland County
95.8% of minority respondents and 86.8% of white respondents said that it is
important to improve race relations in the County.
A higher percent of minority respondents than white respondents thought that each of the strategies
listed in the survey would be helpful. For both groups, over half selected “Encourage early childhood
reading/exposure to books about people of color,” and “Provide enrichment programs for children.”
White Minority
Encourage early childhood reading/exposure to
books about people of color in libraries
53.8% 62.5%
Provide enrichment programs
(such as history, art, and music) for children
53.6% 60.2%
Public service announcements that focus
on value in diversity and successful
cross-cultural communication
28.6% 4.5%
Integrate Black history into
educational curriculum
29.2% 59.1%
Increase parents’ involvement in
children’s education
49.6% 53.4%
Support minority-owned businesses 39.6% 53.4%
Encourage minorities to run for elected office 35.7% 50%
Increase community engagement 49.6% 58%
Encourage conversations about race 42.4% 56.8%
White
Respondents
(86.8%)
Minority
Respondents
(95.8%)
16
businessperceptions
My place of employment is racially diverse.
Racial diversity at my place of employment is beneficial to my company.
60% of the minority business
owners checked “strongly agree”
or “agree” that their place of
employment is racially diverse,
compared with 23.1% of white
respondents. Of those who
checked “strongly disagree” or
“disagree,” 33% were white and
20% were minority.
73.3% of the minority business
owners checked “strongly agree” or
“agree” that racial diversity at their
place of employment is beneficial
to their company, compared with
41.8% of white business owners.
Of those who checked “strongly
disagree” or “disagree,” 20% were
minority and 8.8% were white.
Therefore, there was a higher
percent of minority responses at
both ends of the spectrum, with
a much higher percent of white
business owners selecting “neither
agree nor disagree.”
0 10 20 30 40 50
Strongly
Disagree
Strongly
Disagree
Disagree
Disagree
Disagree
Somewhat
Disagree
Somewhat
Neither Agree
nor Disagree
Neither Agree
nor Disagree
Agree
Somewhat
Agree
Somewhat
Agree
Agree
Strongly
Agree
Strongly
Agree
0 10 20 30 40 50 60
Do you own or run a business in Westmoreland County?
Of all respondents, 118 reported that they owned or ran a business in Westmoreland County. Of these,
102 were white and 16 minority. The remaining questions were asked only of business owners or those
who run businesses in Westmoreland County.
Minority WhiteKey:
Although there was substantial support from white business owners to these questions, a higher
percent of minority business owners expressed belief that their place of employment is racially
diverse, that racial diversity is beneficial, that the County should try to increase racial diversity, that
a racially diverse workforce helps to encourage economic development, and that supporting racial
diversity involves challenging some people’s beliefs about race. Only one business owner said they
would be willing to train unskilled minorities for open positions if unable to find skilled minorities.
Summary of Business Responses
Business Perceptions
0.0%
18.7%
20.0%
14.3%
0.0%
5.5%
6.7%
31.9%
13.3%
6.6%
13.3%
15.4%
46.7%
7.1%
13.3%
5.5%
6.7%
3.3%
0.0%
0.0%
6.7%
40.7%
0.0%
8.8%
13.3%
24.2%
60.0%
17.6%
17
businessperceptions
My company should try to increase racial diversity.
A racially diverse workforce helps encourage economic development.
60% of the minority business
owners “strongly agreed” or
“agreed” that their company
should try to increase racial
diversity, compared with 26.4%
of white business owners. Of
those who checked “strongly
disagree” or “disagree”, 13.3%
were minority and 17.6% were
white. There was a high percent
(42.9%) of white business
owners selecting “neither agree
nor disagree,” than minority
business owners (0.0%).
More than twice as many minority
business owners (80%) “strongly
agreed” or “agreed” that a racially
diverse workforce helps to
encourage economic development
than did white business owners
(39.6%). Of those who “strongly
disagreed” or “disagreed,” 13.3%
were minority and 6.6% were
white. There was a higher percent
of minority responses at both ends
of the spectrum, with a substantial
percent (37.4%) of white business
owners selecting “neither agree
nor disagree,” compared with no
minority business owners (0.0%).
0 10 20 30 40 50
Strongly
Disagree
Strongly
Disagree
Disagree
Disagree
Disagree
Somewhat
Disagree
Somewhat
Neither Agree
nor Disagree
Neither Agree
nor Disagree
Agree
Somewhat
Agree
Somewhat
Agree
Agree
Strongly
Agree
Strongly
Agree
0 10 20 30 40 50
Strongly
Disagree
Disagree
Disagree
Somewhat
Neither Agree
nor Disagree
Agree
Somewhat
Agree
Strongly
Agree
Supporting racial diversity involves challenging some people’s beliefs about race.
Somewhatmoreminoritybusiness
owners (66.7%) “strongly agreed“
or “agreed” that supporting racial
diversity involves challenging
some people’s beliefs about
race than white business owners
(52.2%). Of those who checked
“strongly disagree” or “disagree,”
13.3% were minority and 4.4%
were white. 25.6% of white
business owners selected “neither
agree nor disagree,” compared
with no minority business owners
(0.0%).
0 10 20 30 40 50 60
13.3%
12.1%
0.0%
5.5%
26.7%
3.3%
0.0%
42.9%
0.0%
9.9%
26.7%
18.7%
33.3%
7.7%
13.3%
4.4%
0.0%
2.2%
0.0%
5.5%
0.0%
37.4%
6.7%
11.0%
33.3%
24.2%
46.7%
15.4%
13.3%
2.2%
0.0%
2.2%
0.0%
0.0%
0.0%
25.6%
20.0
17.8%
6.7%
28.9%
60.0%
23.3%
18
businessperceptions
Of all respondents, only one business owner, who was white, agreed somewhat that they would
be willing to train unskilled minorities for open positions, if unable to find skilled minorities. There
were two other respondents, both of whom checked “neither agree nor disagree.”
If I am unable to find skilled minorities, I would be willing to
train unskilled minorities for open positions.
Strongly
Disagree
Disagree
Disagree
Somewhat
Neither Agree
nor Disagree
Agree
Somewhat
Agree
Strongly
Agree
I am able to find skilled minorities to fill positions at my workplace.
46.2% of the minority business
owners checked “strongly agree”
or “agree” that they are able to find
skilled minorities to fill positions
at their workplace, compared with
14.6% of white business owners.
The responses of “strongly
disagree” or “disagree” were similar:
15.4% minority and 13.4% white.
Nearly half of white business
owners selected “neither agree nor
disagree,” compared with 7.7% of
minority business owners.
0 10 20 30 40 50
“Agree Somewhat”
“Neither Agree
nor Disagree”1
2
3
15.4%
6.7%
0.0%
6.7%
15.4%
13.5%
7.7%
49.4%
15.4%
9.0%
15.4%
7.9%
30.8%
6.7%
19
acknowledgments
Guiding Coalition Members
A special thank you to all those who contributed to this project in any way – participated in or sponsored
a focus group; facilitated a discussion; conducted an interview; completed a survey; or made a financial
contribution. The support of all the individuals and their organization serving on the Guiding Coalition;
Seton Hill University and the commitment of the research team/faculty who volunteered their time and
skill is greatly appreciated, as is the support of the Westmoreland Community College Black Awareness
Committee and the University of Pittsburgh, Greensburg Allied Research Department.
Tay Waltenbaugh
CEO
Westmoreland Community Action
Cheri Cavanaugh
Manager of Marketing and Planning
Westmoreland Community Action
Carlotta Paige
Project Coordinator
Chad Amond
President
Westmoreland Chamber of Commerce
Patti Buhl
Manager of Community Relations
Excela Health
Bobbi Watt Geer, PhD
President
United Way of Westmoreland County
Bishop Carl E. Jones, Sr.
President, NAACP
Central Westmoreland County
Phil Koch, Executive Director
James Bendel, Previous Executive Director
Community Foundation of Westmoreland County
Dirk Matson
Director of Human Services
Westmoreland County Government
Judith O’Toole
Director/CEO
Westmoreland Museum of American Art
Kathy Raunikar
Executive Director
YWCA of Westmoreland County
Marjorie Stanislaw
Community Advocate
Department of Juvenile Probation
Rabbi Sara Perman
Congregation Emanu-El Israel
Lois Sculo, SC, PhD
Vice President, Mission and Student Life
Seton Hill University
Jonathan P. Vallano, PhD
Associate Professor of Psychology
University of Pittsburgh, Greensburg
Lynn Wackenhuth
Director, Hope and Life Program
Westmoreland County Housing Authority
Carlene Williams
Westmoreland County Community College
Member/Previous President
Black Awareness Committee
Seton Hill Research Team
David Droppa, PhD
Team Leader
Associate Professor, Social Work
Jeff Bartel, PhD
Associate Professor, Psychology
DeMarquis Clarke, PhD
Associate Professor and Program Director,
Marriage & Family Therapy
Betsy Jacobs, PhD
Associate Professor, Psychology
Roland E. Warfield, MBA, CPA, CIA, CGM
Assistant Professor, Business
20
back cover
The premise of this report is that Westmoreland County faces some challenges not just with
cultural competence and the understanding of the importance of differences and change,
but the imperative to accept diversity in all its forms as an asset and not a threat. This
report, without question, places diversity as a priority concern and gives a powerful insight
into the challenges faced by our community, its racial and ethnic minority population and
all those who are different from our mainstream population.
This report is aimed at individual citizens as well as elected officials, the business and
academic communities and all those in positions that impact Westmoreland County’s
community and economic development. It also demonstrates what issues need to be
addressed without making inferences or drawing conclusions – we simply report the
information from the survey – you be the judge!
Westmoreland Community Action is pleased to have served as the sponsoring agency for
and a supporter of this project. We will continue to share this information and to champion
community education of cultural competence, understanding difference and making
Westmoreland County a welcoming place for all.
Tay Waltenbaugh
Chief Executive Officer
Westmoreland Community Action

Confronting Challenges of Diversity 7-7-15_final version

  • 1.
    1 Confronting the Challenge ofDiversity in Westmoreland County A Report to the Community June 2015
  • 2.
    2 Westmoreland County isan important part of the greater Pittsburgh region. It is the second largest county in southwestern Pennsylvania by size, at over 1,000 square miles, and the 10th most populated in the Commonwealth of Pennsylvania. Westmoreland County has a wealth of opportunities and assets in the form of outstanding agricultural resources, innovative companies, top-rated universities and colleges, and award- winning hospitals that provide superior healthcare. Its population is estimated to be almost 360,000. While Westmoreland County is rich in cultural heritage, it’s not very racially or ethnically diverse, as shown in the chart below. Since 1990 however, Westmoreland County has seen a gradual, yet small, diversification of its population. In particular, the percent of people self-identifying as White alone has dropped from 97.5% to 95.2%, while those identifying as Black alone has increased from 1.9% to 2.5%. Yet, the percent of those identifying as anything other than White alone remains a very small portion of the total population, just 5.75%. Interestingly, those identifying as being of two or more races increased substantially between the 2000 and 2010 Censuses, from 0.6% to 1.3%. This could be due to changes in the way the question is being presented in Census forms. In particular, being of two or more races was not a statistic collected in 1990. As Westmoreland County continues to prosper, we expect its population to become more diverse – both racially and ethnically. Westmoreland County Demographic Percent White alone 95.2% Black or African American alone 2.5% American Indian and Alaska Native alone 0.1% Asian alone 0.8% Native Hawaiian and Other Pacific Islander alone .05% Two or more races 1.3% Hispanic or Latino 1.0% Source: Some information and data above was taken from the Westmoreland County Department of Planning and Development’s 2012 Westmoreland County Community Profile and the United States Census.
  • 3.
    3 4 5-7 7-9 10-12 13-14 15 16-18 19 Introduction, Study Designand Goals of the Study Who Responded? Perceptions Personal Experience Neighborhood Perceptions Improving Race Relations Business Perceptions Acknowledgments Table of Contents Authors: Carlotta Paige Cheri Cavanaugh Layout and Design: Shelby Kyllo For more information about this report, call Westmoreland Community Action at 724-834-1260, ext. 153
  • 4.
    4 Introduction Study Design Confronting thechallenge of Diversity is the first study of racial diversity in Westmoreland County. The study is the product of collaboration between Paige Community Coordinators, Westmoreland Community Action, the sponsoring agency, and Seton Hill University. Vibrant Pittsburgh’s Mini Grant Program provided the initial funding. The research team included five faculty members from Seton Hill University plus representatives from PCC and WCA. A Guiding Coalition with a broad cross-section of stakeholders representing various sectors of the community gave input and guidance; some contributed additional funding, served as facilitators for focus groups and provided space for focus group sessions. This report presents key findings of the study. It is hoped that this The study began with a series of focus groups and interviews with key individuals, selected based on census data and other variables to represent, as far as possible, different segments of socio- economic and racial characteristics. The purpose of the focus group/interview phase was to collect information that would assist in the design of a community survey. A total of 12 focus groups were completed in December 2013: six with whites and six with minorities, with members from a dozen Westmoreland County zip codes. Eleven interviews were completed with individuals representative of business (five), government (four), education, and information will stimulate discussion and result in a collaborative effort to support change that strengthens the cultural, social, and economic fabric of Westmoreland County. In this report, the terms white and minority are used. The term minority is used strictly in the numeric sense. It is acknowledged that there are sometimes negative connotations to the word “minority”, these meanings are not intended. Because the number of racial minorities who responded to the survey was so small compared to the number of white respondents, statistical testing between the two groups was not appropriate. We chose to simply present the comparisons reported here in terms of percentages by group. clergy (one each). Once data from the focus groups were assessed, a survey was constructed to elicit responses from everyone in the County who was willing to participate. Information sought pertained to the awareness of issues related to diversity, distinguishing perception from fact about diversity, and identifying beliefs that impact on how welcoming the County is to minorities. A paper-and-pencil version of the survey was also available. The survey was active during the month of June 2014. Initial analysis of results was completed over the following six months. Goals of the Study The goals of the study were to identify and measure attitudes about racial diversity in the County, and to make recommendations and initiate strategies to help strengthen the cultural and commercial fabrics of the region.
  • 5.
    5 Location of Respondents WhoResponded? One thousand two hundred and six people filled out the survey. The number of those responding to each question varied by question. All of the percentages are for the number who chose that answer, divided by the total number responding to the question. Those responding were 92.7% white and 7.3% minority. Of the minority respondents compared with all respondents to this question, 5.7% said they were Black/African-American, 1% American Indian or Alaskan native, .1% Chinese, and .2% other Asian. There was a higher percent of minority respondents to the survey than the percent of minority residents in the County (7.3% compared with 4.9%). The mean age was 50 for both white and minority respondents and 73% were female and 27% male. A higher percent of survey respondents were more female than the County population (51.9%). Overall 92.6% of respondents live in the County and 81.1% work here. Because the survey was voluntary, the respondents would not be expected to mirror the composition of the county, and indeed, the respondents to this survey were disproportionately minority, more highly educated, more female, with higher annual incomes, and more are registered Democratic than the population of the county. There was also a higher percent of minority business owners than for the county as a whole. 15012 15062 15068 15072 15085 15087 15089 15131 15137 15146 15448 15479 15501 15531 15601 15610 15611 15612 15613 15615 15616 15617 15618 15620 15621 15622 15623 15624 15625 15626 15627 15628 15632 15633 15634 15635 15636 15637 15638 15639 15640 15642 15644 15646 15647 15650 15655 15656 15658 15660 15661 15662 15663 15665 15666 15668 15670 15671 15672 15675 15676 15677 15678 15679 15680 15681 15683 15684 15687 15688 15689 15690 15691 15692 15693 15695 15697 15698 15717 15779 15923 15944 15954 16229 Westmoreland Adamsburg Allegheny Arnold Arona Avonmore Bell Bolivar Cook Delmont Derry Derry Donegal Donegal East Huntingdon East Vandergrift Export Fairfield Greensburg Hempfield Hunker Hyde Park Irwin Jeannette Latrobe Laurel Mountain Ligonier Ligonier Lower Burrell Loyalhanna Madison Manor Monessen Mount Pleasant Mount Pleasant Murrysville New Alexandria New Florence New Kensington New Stanton North Huntingdon North Irwin Oklahoma Penn Penn Rostraver St. Clair Salem Scottdale Seward Sewickley Smithton South Greensburg South Huntingdon Southwest Greensburg Sutersville Trafford Unity Upper Burrell Vandergrift Washington West Leechburg West Newton Youngstown Youngwood Responses by Zip Code Westmoreland County Westmoreland County ZCTAs Prepared by: The Pennsylvania State Data Center http://pasdc.hbg.psu.edu/ Source: Survey data supplied by: Paige Community Coordinators, LLC Legend 1 Dot = 1 White Minority White respondents were from 101 zip codes and minority were from 18. The map below shows geographic distribution for white and minority respondents.
  • 6.
    6 therespondents Own or runa business in Westmoreland County 10.5% of all respondents reported owning or running a business in Westmoreland County. When broken down by race, 9.8% of white respondents reported owning or running a business in the county, compared with 10.5% of minority respondents. The percent of minority respondents owning or running a business is higher than that for the county as a whole (2.8% in 2007). Annual Household Income of Respondents 0 5 10 15 20 25 30 The median annual household income for Westmoreland County in 2013 was $50,736. Survey respondents had higher median incomes at $50-75,000. Of survey respondents, as this chart illustrates, there were relatively more minorities in the lower income brackets and relatively more whites in the upper income brackets. Whites and minorities in the $35-50,000 and $75-$250,000 brackets earned similar amounts. percent under$15,000 $15,000-24,999 $25,000-34,999 $35,000-49,999 $50,000-74,999 $75,000-99,999 $250,000+ Relationship Status of Respondents Married Widowed Divorced Separated Never Married Cohabiting Long-term Relationship This chart shows the relationship status of the respondents. 53% of all respondents reported being married. The chart shows the other categories as well. Minority White 0 10 20 30 40 50 60 46% 5.7% 18.4% 3.4% 20.7% 3.4% 2.3% 59.5% 5.4% 13.2% 1.7% 12.6% 1.9% 5.7% No schooling completed High school diploma GED or alterna- tive Some college credit 1ormoreyearsof college- no degree Asso- ciate’s degree Bachelor’s degree Master’s degree Profession- al degree beyond a master’s Doctorate degree 4 6 8 91 14 35 119 119 324 234 1 8 2 2 8 13 22 22 2 6 Highest Level of School Completed by Respondents With regard to education, the survey respondents compared with the county, reported a higher level of formal education. For example, 30.9% of the respondents reported having a bachelors degree, versus 25.3% for all County residents, according to the latest US Census data. This chart illustrates the highest level of education completed by white and minority respondents. $100,000-249,999
  • 7.
    7 perceptions Perceptions of theRespondents about Diversity in Westmoreland County Survey respondents were asked to answer questions about their perceptions of Westmoreland County, their personal experiences and self- reflections about race relations in the County. The information to follow suggest that a greater percentage of the racial minorities who responded to the survey have had personal exposure to racism and discrimination than was the case for the white respondents. It is not surprising, therefore, that the minority respondents would have unique perceptions of the challenges to racial diversity in Westmoreland County. Indeed, the data suggests that compared to the white respondents, a greater percentage of minorities do not feel that Westmoreland County is welcoming to, or accepting of, racial minorities. Moreover, a greater percentage of minorities feel that racial discrimination is a continuing problem in Westmoreland County. Survey Responses That said, minority and white respondents also shared significant points of agreement. Both groups agreed that it was important to improve race relations in the County, and both groups indicatedsignificantsupportforseveralstrategies to achieve this goal. In particular, over half of both groups supported the encouragement of increasing children’s exposure books about people of color, as well as the broader goal of providing general enrichment programs for children in the community. Programs to increase parental involvement in children’s education, to increase community engagement, and to encourage conversations about issues of race were also strongly supported by both minority and white respondents Minority respondents tended to disagree more than whites that there is a benefit from living in a community where diversity is present, although in the “agree somewhat” and “strongly agree” categories, these differences were reversed. Do you and your family benefit from being in a community with people who are different from you? Strongly Disagree Disagree Disagree Somewhat Neither Agree nor Disagree Agree Somewhat Agree 0 5 10 15 20 25 30 Strongly Agree 4.8% 2.6% 7.2% 3.7% 9.6% 2.7% 16.9% 25% 15.7% 13.6% 20.5% 29.9% 25.3% Minority White 22.4% Key: Political Affiliation of Respondents Overall, 60.4% of the respondents reported being registered Democratic, 28% Republican, and 11.4% independent or other. The respondents to the study were more Democratic than registered voters in Westmoreland County, and less Republican, when compared to the County data as of June 2014. A higher percent of white respondents identified as Republican than minority respondents; conversely, a higher percent of minority respondents identified as Democrats, compared with white respondents. Democratic Republican Constitution Libertarian Green Independent White 58.8% 29.7% 0.9% 0.2% 0.3% 10.1% Minority 79.7% 8.9% 0% 0% 0% 11.4%
  • 8.
    8 perceptions Strongly Disagree Disagree Disagree Somewhat Neither Agree nor Disagree Agree Somewhat Agree Strongly Agree Minorityrespondents selected “agree” or “strongly agree” more than white respondents (55.1% compared to 38.1%). The percent of all respondents, both white and minority, who disagreed or strongly disagreed, was low. Increasing numbers of minorities moving into the County would be good for Westmoreland County. 0 5 10 15 20 25 30 35 The vast majority of respondents agreed that “interacting and forming relationships with diverse populations helps bring people together.” The largest difference was that minority respondents selected “agree” or “strongly agree” more than white respondents. More whites than minorities, 18.6% versus 4%, “agreed” or “strongly agreed” that the County is welcoming to minorities, while more minorities disagreed somewhat or strongly disagreed that the county is welcoming. Interacting with and forming relationships with diverse populations helps bring people together Is Westmoreland County welcoming to racial minorities? Strongly Disagree Strongly Disagree Disagree Disagree Disagree Somewhat Disagree Somewhat Neither Agree nor Disagree Neither Agree nor Disagree Agree Somewhat Agree Somewhat Agree Agree Strongly Agree Strongly Agree 0 5 10 15 20 25 30 0 10 20 30 40 50 31.8% of white respondents responded that this is true, compared with 59% of minority respondents. Are there places in the County that do not allow racial minorities? Yes Responses No Responses White 31.8% 286 68.2% 613 Minority 59% 46 41% 32 3.8% 3.8% 3.8% 5.9% 2.5% 6.2% 17.5% 30.8% 17.5% 15.3% 23.8% 20.9% 31.3% 17.2% 1.3% 2.5% 1.1% 1.5% 1.3% 1.9% 6.8% 13.0% 11.3% 17.0% 32.5% 35.1% 45.0% 30.2% 16.0% 4.1% 10.7% 10.9% 28.0% 19.9% 18.7% 23.8% 22.7% 22.6% 2.7% 16.6% 1.3% 2.0%
  • 9.
    9 perceptions White respondents tendedto agree more that the County is accepting of racial minorities than minority respondents do. Of those who “agree” or “strongly agree” with this statement, 18.8% were white and only 5.4% minority; the reverse was true for the “strongly disagree” and “disagree” responses (16.6% white versus 28% minority). Is Westmoreland County accepting of racial minorities? 0 5 10 15 20 25 Strongly Disagree Disagree Disagree Somewhat Neither Agree nor Disagree Agree Somewhat Agree Strongly Agree More minority respondents than white respondents said that they “strongly disagree” or “disagree” that Westmoreland County is racially integrated. Only 10.3% of white respondents reported that they “agree” or “strongly agree” that the County is racially integrated, similar to 8% of minority respondents. More minority respondents than white respondents agreed or strongly agreed that discrimination is a continuing problem. When “agree somewhat” responses are included, white and minority respondents are a little closer (49.6% of white respondents agreed somewhat, agreed, or strongly agreed, compared with 62.2% of minority respondents.) Do you think Westmoreland County is racially integrated? Is discrimination a continuing problem in Westmoreland County? 0 5 10 15 20 25 0 5 10 15 20 25 30 Strongly Disagree Strongly Disagree Disagree Disagree Disagree Somewhat Disagree Somewhat Neither Agree nor Disagree Neither Agree nor Disagree Agree Somewhat Agree Somewhat Agree Agree Strongly Agree Strongly Agree Nearlyhalfofwhiterespondentsreported having “never” or “rarely” witnessed racial discrimination, compared with less than one quarter of minority respondents. In contrast, just a little over ten percent of white respondents reported having “frequently”or“regularly”witnessedracial discrimination, compared with over a thirdofminorityrespondents. Responses of “occasionally” or “sometimes” were similar for both groups. How often have you witnessed racial discrimination in Westmoreland County? 0 5 10 15 20 25 30 35 Never Rarely Occasionally Sometimes Frequently Regularly 14.7% 4.1% 13.3% 12.5% 24.0% 20.2% 24.0% 19.9% 18.7% 24.5% 2.7% 17.2% 2.7% 1.6% 22.7% 9.7% 22.7% 17.8% 22.7% 22.0% 14.7% 19.4% 9.3% 20.7% 4.0% 9.0% 4.0% 1.3% 9.5% 4.9% 4.1% 9.7% 5.4% 10.4% 18.9% 25.4% 16.2% 24.4% 28.4% 18.5% 17.6% 6.7% 8.9% 12.8% 10.1% 31.7% 21.5% 22.2% 24.1% 23.0% 20.3% 8.4% 15.2% 1.8%
  • 10.
    10 personalexperience Two questions wereasked giving the following examples and whether they represent discrimination or not: 1. Locking your car door when men of color cross the street: 61.7% of white respondents said this was “definitely” or “probably” discrimination, compared with 81.3% of minority respondents. 2. Racial epithets written on buildings : 95.2% of white respondents said this was “definitely” or “probably” discrimination, compared with 93.7% of minority respondents. 0 10 20 30 40 50 0 20 40 60 80 100 0 10 20 30 40 0 20 40 60 80 100 Definitely DefinitelyProbably ProbablyProbably Not Probably Not Definitely Not Definitely Not Minorities reported being more likely to “frequently” or “regularly” talk with close friends about racial prejudice than whites. In contrast, whites were more likely to “never” or “rarely” talk to close friends about racial prejudice than minorities. How often do you talk about racial prejudice with close friends? 0 5 10 15 20 25 30 35 Never Rarely Occasionally Sometimes Frequently Regularly 6% 11.3% 16.7% 30.8% 22.6% 23.7% 23.8% 22.8% 22.6% 9.3% 8.3% 2.1% More than one-third of minorities reported “frequently” or “regularly” talking about racism they have experienced or observed, compared with only 11.3% of whites. In contrast, white respondents were more likely to “never” or “rarely” talk about racism. How often do you talk about racism you have experienced/observed? Never Rarely Occasionally Sometimes Frequently Regularly 4.9% 10.3% 15.9% 30.6% 20.7% 27.4% 24.4% 20.4% 24.4% 9.1% 9.8% 2.2% 0 5 10 15 20 25 30 35 A remarkably higher percent of minorities reported feeling that they are treated differently when seeking health care than whites. Overall, more than 80% of respondents thought that younger people were much more or somewhat more accepting of diversity. Are you treated differently when seeking health care than other racial groups? Who is more accepting of diversity: younger or older people, or is there no difference? 22.9% 50% 31.3% 11.3% 7.5% 8.9% 2.5% 3.8% 84.8% 38.8% 26.3% 12% 18.4% 3.1% 1.7% 76.8%
  • 11.
    11 personalexperience How many ofyour co-workers are minorities? Minority Co-workers of White Respondents Minority Co-workers of Minority Respondents 1-5 None 6-10 More than 10 The answers for white and minority respondents were fairly similar. The largest difference was for the range of 1-5 co-workers, where 43.5% of the white respondents reported working with minority co-workers, compared with 51.4% of minority respondents who work with minority co-workers. 51.4%43.5% 31.1%40% 9.5%9.4% 8.1%7% How many of your close friends are minorities? Minority Close Friends of White Respondents Minority Close Friends of Minority Respondents 1-5 None 6-10 More than 10 White respondents were more likely to report that they had five or fewer close friends who were minorities than did minority respondents. In contrast, more minority respondents reported having more than 10 close friends who are minorities than did white respondents. 52.5% 28% 48% 10.7% 13.3% 34% 6.5% 7% Minorities reported feeling accepted somewhat less than whites, but not dramatically so. Do you feel accepted as friends/co-workers/neighbors by those of other races? Strongly disagree or disagree Disagree somewhat, neigher agree nor disagree, or agree somewhat Agree or strongly agree White 1.7% 38.6% 59.8% Minority 6.5% 40.4% 53.3%
  • 12.
    12 personalexperience Minority respondents reportedbeing reminded about their race much more often than white respondents. 27.8% of minorities reported being frequently or regularly reminded about their race, compared with 6.8% of white respondents. How often are you reminded about your race? Never or Rarely Occasionally or Sometimes Frequently or Regularly White 70.1% 23.1% 6.8% Minority 31.6% 40.5% 27.8% More minorities than whites reported being treated differently at work than members of other racial groups. Do you feel you are treated differently at work than members of other racial groups? Yes No White 11.4% 88.6% Minority 29.1% 70.9% A higher percent of minority respondents reported having taken action in various ways than white respondents. Trying to learn more about another culture was slightly higher for whites than minorities, and expecting others to learn about their culture was higher for minorities than whites. Respondents were asked if they had ever done any of the following: White Minority Changed how you talk to someone who was a different race 13.4% 26.1% Changed how you dressed around people of a different race 1% 9.1% Put more effort into finding/ keeping a job than someone of another race 6.2% 25.0% Lost a job because of your race 1.4% 12.5% Tried to learn more about another culture 58.4% 54.5% Expected others to learn more about your culture 11.6% 27.3% A much higher percent of minority respondents reported personally witnessing or being aware of events in Westmoreland County than white respondents. Personally witnessed or are aware of happening in Westmoreland County: White Minority Racial Profiling 27.2% 55.7% A minority is followed/ watched carefully in a store 29.1% 62.5% A person is stopped in their vehicle because of race 13% 42%
  • 13.
    13 neighborhoodperceptions The “typical” minoritycommunity was viewed as less positive by minority respondents than white respondents in every category, believing that they are more likely to be characterized by high crime rates, single parent female head of households, more low or no income workers/families than middle to low income, abandoned homes, and the selling of drugs. Both groups agreed that the “typical” minority community has a low rate of owner occupied homes, a high rate of alcoholism, and a lack of housing stock that is fair market priced. For other characteristics, minorities viewed the minority community as less positive; for example, a higher percent of minorities responded that there were fewer two parent households. A lower percent of minorities thought that there were enough public services like garbage pickup and street cleaning, and the same was true for slow response times for police and fire. More than half of the minority respondents believed that there was “appreciation for the benefits of education” in the minority community, versus a little more than one third of white respondents. Both groups agreed that a strong sense of community is present in a “typical” minority community. Minority Community Characteristic Minority White Enough services are provided (e.g., garbage, street cleaning) 26.1% 42.7% High crime rate 68.2% 61.8% Strong sense of community (neighbors know each other and associate with each other) 55.7% 50.3% Appreciation for the benefits of education 51.1% 34% Middle to low income workers and families 75% 58.8% Low or no income families 77.3% 65.2% Two parent households 34.1% 23.5% Single parent households -male head of household 38.6% 21.9% Single parent households -female head of household 78.4% 64.9% Fair market home prices 20.5% 23.8% Owner occupied homes 15.9% 15.5% Abandoned homes 71.6% 63.2% Slow police and fire response times 67% 39.8% Drugs being sold 75% 66.3% Gang-free zones 23.9% 16.2% Domestic violence 62.5% 60.9% High rate of alcoholism 51.1% 52.6% Respondents were asked about two “typical” communities, one with mostly minority residents, and the other with mostly white residents.
  • 14.
    14 neighborhoodperceptions Characteristic Minority White Enoughservices are provided (e.g., garbage, street cleaning) 77.3% 66.6% High crime rate 21.6% 13.2% Strong sense of community (neighbors know each other and associate with each other) 63.6% 51% Appreciation for the benefits of education 72.7% 64.7% Middle to low income workers and families 58% 58% Low or no income families 39.8% 34.3% Two parent households 73.9% 60.6% Single parent households -male head of household 50% 40.1% Single parent households -female head of household 36.4% 38% Fair market home prices 68.2% 56.5% Owner occupied homes 76.1% 65.1% Abandoned homes 13.6% 18.9% Slow police and fire response times 13.6% 14.8% Drugs being sold 45.5% 43.9% Gang-free zones 56.8% 44.8% Domestic violence 64.8% 55% High rate of alcoholism 67% 52.6% White Community Formostcategories,therespondents’perceptionsofthe “typical”whitecommunityweremorepositivethanforthe “typical”minoritycommunity;forexample,thatthereare more services and a lower crime rate. Minoritiestendedtoviewthewhitecommunityasmore positivethandidwhiterespondents.Inevaluating“typical” whitecommunities,ahigherpercentofminoritythanwhite respondentsreportedabeliefthatwhitecommunitieshave astrongsenseofcommunity,publicservicesprovided, appreciationforthebenefitofeducation,andtwoparent households.Morethanhalfofboththewhiteandminority respondentsagreedthatthewhitecommunityhasmore middletolowincomeworkersorfamilies,comparedtolow or no income workers or families. The “typical” white community is viewed by more minorityrespondentsthanwhiterespondentsashaving owner-occupiedhomesthatarefairmarketpriced.The whitecommunityisviewedalsobyminorityrespondentsas havinggang-freezonesmorethanthewhiterespondents. A higher number of minority respondents viewed the white community as characterized by the selling of drugs,domesticviolence,andalcoholismthandidwhite respondents.
  • 15.
    15 racerelations Strategies to improverace relations in the County Improving Race Relations in Westmoreland County 95.8% of minority respondents and 86.8% of white respondents said that it is important to improve race relations in the County. A higher percent of minority respondents than white respondents thought that each of the strategies listed in the survey would be helpful. For both groups, over half selected “Encourage early childhood reading/exposure to books about people of color,” and “Provide enrichment programs for children.” White Minority Encourage early childhood reading/exposure to books about people of color in libraries 53.8% 62.5% Provide enrichment programs (such as history, art, and music) for children 53.6% 60.2% Public service announcements that focus on value in diversity and successful cross-cultural communication 28.6% 4.5% Integrate Black history into educational curriculum 29.2% 59.1% Increase parents’ involvement in children’s education 49.6% 53.4% Support minority-owned businesses 39.6% 53.4% Encourage minorities to run for elected office 35.7% 50% Increase community engagement 49.6% 58% Encourage conversations about race 42.4% 56.8% White Respondents (86.8%) Minority Respondents (95.8%)
  • 16.
    16 businessperceptions My place ofemployment is racially diverse. Racial diversity at my place of employment is beneficial to my company. 60% of the minority business owners checked “strongly agree” or “agree” that their place of employment is racially diverse, compared with 23.1% of white respondents. Of those who checked “strongly disagree” or “disagree,” 33% were white and 20% were minority. 73.3% of the minority business owners checked “strongly agree” or “agree” that racial diversity at their place of employment is beneficial to their company, compared with 41.8% of white business owners. Of those who checked “strongly disagree” or “disagree,” 20% were minority and 8.8% were white. Therefore, there was a higher percent of minority responses at both ends of the spectrum, with a much higher percent of white business owners selecting “neither agree nor disagree.” 0 10 20 30 40 50 Strongly Disagree Strongly Disagree Disagree Disagree Disagree Somewhat Disagree Somewhat Neither Agree nor Disagree Neither Agree nor Disagree Agree Somewhat Agree Somewhat Agree Agree Strongly Agree Strongly Agree 0 10 20 30 40 50 60 Do you own or run a business in Westmoreland County? Of all respondents, 118 reported that they owned or ran a business in Westmoreland County. Of these, 102 were white and 16 minority. The remaining questions were asked only of business owners or those who run businesses in Westmoreland County. Minority WhiteKey: Although there was substantial support from white business owners to these questions, a higher percent of minority business owners expressed belief that their place of employment is racially diverse, that racial diversity is beneficial, that the County should try to increase racial diversity, that a racially diverse workforce helps to encourage economic development, and that supporting racial diversity involves challenging some people’s beliefs about race. Only one business owner said they would be willing to train unskilled minorities for open positions if unable to find skilled minorities. Summary of Business Responses Business Perceptions 0.0% 18.7% 20.0% 14.3% 0.0% 5.5% 6.7% 31.9% 13.3% 6.6% 13.3% 15.4% 46.7% 7.1% 13.3% 5.5% 6.7% 3.3% 0.0% 0.0% 6.7% 40.7% 0.0% 8.8% 13.3% 24.2% 60.0% 17.6%
  • 17.
    17 businessperceptions My company shouldtry to increase racial diversity. A racially diverse workforce helps encourage economic development. 60% of the minority business owners “strongly agreed” or “agreed” that their company should try to increase racial diversity, compared with 26.4% of white business owners. Of those who checked “strongly disagree” or “disagree”, 13.3% were minority and 17.6% were white. There was a high percent (42.9%) of white business owners selecting “neither agree nor disagree,” than minority business owners (0.0%). More than twice as many minority business owners (80%) “strongly agreed” or “agreed” that a racially diverse workforce helps to encourage economic development than did white business owners (39.6%). Of those who “strongly disagreed” or “disagreed,” 13.3% were minority and 6.6% were white. There was a higher percent of minority responses at both ends of the spectrum, with a substantial percent (37.4%) of white business owners selecting “neither agree nor disagree,” compared with no minority business owners (0.0%). 0 10 20 30 40 50 Strongly Disagree Strongly Disagree Disagree Disagree Disagree Somewhat Disagree Somewhat Neither Agree nor Disagree Neither Agree nor Disagree Agree Somewhat Agree Somewhat Agree Agree Strongly Agree Strongly Agree 0 10 20 30 40 50 Strongly Disagree Disagree Disagree Somewhat Neither Agree nor Disagree Agree Somewhat Agree Strongly Agree Supporting racial diversity involves challenging some people’s beliefs about race. Somewhatmoreminoritybusiness owners (66.7%) “strongly agreed“ or “agreed” that supporting racial diversity involves challenging some people’s beliefs about race than white business owners (52.2%). Of those who checked “strongly disagree” or “disagree,” 13.3% were minority and 4.4% were white. 25.6% of white business owners selected “neither agree nor disagree,” compared with no minority business owners (0.0%). 0 10 20 30 40 50 60 13.3% 12.1% 0.0% 5.5% 26.7% 3.3% 0.0% 42.9% 0.0% 9.9% 26.7% 18.7% 33.3% 7.7% 13.3% 4.4% 0.0% 2.2% 0.0% 5.5% 0.0% 37.4% 6.7% 11.0% 33.3% 24.2% 46.7% 15.4% 13.3% 2.2% 0.0% 2.2% 0.0% 0.0% 0.0% 25.6% 20.0 17.8% 6.7% 28.9% 60.0% 23.3%
  • 18.
    18 businessperceptions Of all respondents,only one business owner, who was white, agreed somewhat that they would be willing to train unskilled minorities for open positions, if unable to find skilled minorities. There were two other respondents, both of whom checked “neither agree nor disagree.” If I am unable to find skilled minorities, I would be willing to train unskilled minorities for open positions. Strongly Disagree Disagree Disagree Somewhat Neither Agree nor Disagree Agree Somewhat Agree Strongly Agree I am able to find skilled minorities to fill positions at my workplace. 46.2% of the minority business owners checked “strongly agree” or “agree” that they are able to find skilled minorities to fill positions at their workplace, compared with 14.6% of white business owners. The responses of “strongly disagree” or “disagree” were similar: 15.4% minority and 13.4% white. Nearly half of white business owners selected “neither agree nor disagree,” compared with 7.7% of minority business owners. 0 10 20 30 40 50 “Agree Somewhat” “Neither Agree nor Disagree”1 2 3 15.4% 6.7% 0.0% 6.7% 15.4% 13.5% 7.7% 49.4% 15.4% 9.0% 15.4% 7.9% 30.8% 6.7%
  • 19.
    19 acknowledgments Guiding Coalition Members Aspecial thank you to all those who contributed to this project in any way – participated in or sponsored a focus group; facilitated a discussion; conducted an interview; completed a survey; or made a financial contribution. The support of all the individuals and their organization serving on the Guiding Coalition; Seton Hill University and the commitment of the research team/faculty who volunteered their time and skill is greatly appreciated, as is the support of the Westmoreland Community College Black Awareness Committee and the University of Pittsburgh, Greensburg Allied Research Department. Tay Waltenbaugh CEO Westmoreland Community Action Cheri Cavanaugh Manager of Marketing and Planning Westmoreland Community Action Carlotta Paige Project Coordinator Chad Amond President Westmoreland Chamber of Commerce Patti Buhl Manager of Community Relations Excela Health Bobbi Watt Geer, PhD President United Way of Westmoreland County Bishop Carl E. Jones, Sr. President, NAACP Central Westmoreland County Phil Koch, Executive Director James Bendel, Previous Executive Director Community Foundation of Westmoreland County Dirk Matson Director of Human Services Westmoreland County Government Judith O’Toole Director/CEO Westmoreland Museum of American Art Kathy Raunikar Executive Director YWCA of Westmoreland County Marjorie Stanislaw Community Advocate Department of Juvenile Probation Rabbi Sara Perman Congregation Emanu-El Israel Lois Sculo, SC, PhD Vice President, Mission and Student Life Seton Hill University Jonathan P. Vallano, PhD Associate Professor of Psychology University of Pittsburgh, Greensburg Lynn Wackenhuth Director, Hope and Life Program Westmoreland County Housing Authority Carlene Williams Westmoreland County Community College Member/Previous President Black Awareness Committee Seton Hill Research Team David Droppa, PhD Team Leader Associate Professor, Social Work Jeff Bartel, PhD Associate Professor, Psychology DeMarquis Clarke, PhD Associate Professor and Program Director, Marriage & Family Therapy Betsy Jacobs, PhD Associate Professor, Psychology Roland E. Warfield, MBA, CPA, CIA, CGM Assistant Professor, Business
  • 20.
    20 back cover The premiseof this report is that Westmoreland County faces some challenges not just with cultural competence and the understanding of the importance of differences and change, but the imperative to accept diversity in all its forms as an asset and not a threat. This report, without question, places diversity as a priority concern and gives a powerful insight into the challenges faced by our community, its racial and ethnic minority population and all those who are different from our mainstream population. This report is aimed at individual citizens as well as elected officials, the business and academic communities and all those in positions that impact Westmoreland County’s community and economic development. It also demonstrates what issues need to be addressed without making inferences or drawing conclusions – we simply report the information from the survey – you be the judge! Westmoreland Community Action is pleased to have served as the sponsoring agency for and a supporter of this project. We will continue to share this information and to champion community education of cultural competence, understanding difference and making Westmoreland County a welcoming place for all. Tay Waltenbaugh Chief Executive Officer Westmoreland Community Action