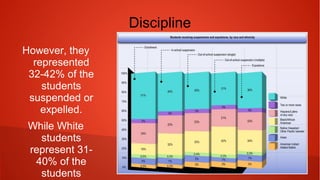
African-American Students in
Secondary Education
Matthew Braddock
Cultural Diversity
Population
In 2011-2012,
African-American students
represented 16% of the
secondary education
population.
(Office for Civil Rights)
Discipline
However, they
represented 32-42% of
the students
suspended or expelled.
While White students
represent 31-40% of
the students
suspended or expelled,
they represent 51% of
the student population.
(Office for Civil Rights)
Graduation
In 2011-2012, 80% of United States
students graduated secondary school
in 4 years.
While 86% of White students
completed secondary school on-time,
only 69% of African-American
students graduated on-time.
(National Center for Education
Statistics)
Dropouts
While the dropout rate for
African-Americans has
dropped from 12.6% to 7.3%
in the past twenty years, it is
still higher than White
students (5.0%).
(National Center for
Education Statistics)
College Readiness
The ACT exam measures college
readiness by testing four
benchmarks: English, Reading,
Mathematics, and Science.
In 2013, only 5% of
African-American students met all
4 benchmarks.
(ACT Inc.)
Test Scores
For the NAEP assessment in 2013,
White students averaged 162 in
mathematics and 297 in reading.
In contrast, African-American
students averaged 132 in
mathematics and 268 in reading, both
approximately 30 points lower.
(National Center for Education
Statistics)
Reflection
The data does not give
explanations or reasoning for
the results. Some possible
conclusions are lack of
support for minorities,
improper instructing methods,
or systemic racism in the
schooling system.
As an instructor as a high
school where
African-American students
represent 91% of the
population, I witness these
deficiencies on a daily basis.
Change must done on a
national scale.
References
[References can be viewed at bit.ly/cultural_diversity]
â—ŹACT Inc. The Condition of College and Career Readiness 2013: National.
http://www.act.org/research/policymakers/cccr13/pdf/CCCR13-NationalRead
inessRpt.pdf
â—ŹNational Center for Education Statistics. 2013 Mathematics and Reading:
Grade 12 Assessments.
http://nationsreportcard.gov/reading_math_g12_2013/#/
â—ŹNational Center for Education Statistics. Public High School Four-Year
On-Time Graduation Rates and Event Dropout Rates.
http://nces.ed.gov/pubs2014/2014391.pdf
â—ŹOffice for Civil Rights. Civil Rights Data Collection; Data Snapshot: School
Discipline.
http://www2.ed.gov/about/offices/list/ocr/docs/crdc-discipline-snapshot.pdf

Cultural Diversity Blog

  • 1.
    African-American Students in SecondaryEducation Matthew Braddock Cultural Diversity
  • 2.
    Population In 2011-2012, African-American students represented16% of the secondary education population. (Office for Civil Rights)
  • 3.
    Discipline However, they represented 32-42%of the students suspended or expelled. While White students represent 31-40% of the students suspended or expelled, they represent 51% of the student population. (Office for Civil Rights)
  • 4.
    Graduation In 2011-2012, 80%of United States students graduated secondary school in 4 years. While 86% of White students completed secondary school on-time, only 69% of African-American students graduated on-time. (National Center for Education Statistics)
  • 5.
    Dropouts While the dropoutrate for African-Americans has dropped from 12.6% to 7.3% in the past twenty years, it is still higher than White students (5.0%). (National Center for Education Statistics)
  • 6.
    College Readiness The ACTexam measures college readiness by testing four benchmarks: English, Reading, Mathematics, and Science. In 2013, only 5% of African-American students met all 4 benchmarks. (ACT Inc.)
  • 7.
    Test Scores For theNAEP assessment in 2013, White students averaged 162 in mathematics and 297 in reading. In contrast, African-American students averaged 132 in mathematics and 268 in reading, both approximately 30 points lower. (National Center for Education Statistics)
  • 8.
    Reflection The data doesnot give explanations or reasoning for the results. Some possible conclusions are lack of support for minorities, improper instructing methods, or systemic racism in the schooling system. As an instructor as a high school where African-American students represent 91% of the population, I witness these deficiencies on a daily basis. Change must done on a national scale.
  • 9.
    References [References can beviewed at bit.ly/cultural_diversity] â—ŹACT Inc. The Condition of College and Career Readiness 2013: National. http://www.act.org/research/policymakers/cccr13/pdf/CCCR13-NationalRead inessRpt.pdf â—ŹNational Center for Education Statistics. 2013 Mathematics and Reading: Grade 12 Assessments. http://nationsreportcard.gov/reading_math_g12_2013/#/ â—ŹNational Center for Education Statistics. Public High School Four-Year On-Time Graduation Rates and Event Dropout Rates. http://nces.ed.gov/pubs2014/2014391.pdf â—ŹOffice for Civil Rights. Civil Rights Data Collection; Data Snapshot: School Discipline. http://www2.ed.gov/about/offices/list/ocr/docs/crdc-discipline-snapshot.pdf