CS 3351
FOUNDATIONS OFDATA SCIENCE
PREPARED BY : MR. K. DANIEL RAJ B.TECH.,M.E.,MISTE.,
DEPARTMENT OF COMPUTER SCIENCE AND ENGINEERING ( UG & PG )
2.
Data Science: Benefitsand uses – facets of data - Data Science
Process: Overview – Defining research goals – Retrieving data –
Data preparation Exploratory Data analysis – build the model
presenting findings and building applications - Data Mining - Data
Warehousing – Basic Statistical descriptions of Data
INTRODUCTION
UNIT 1
CS 3351 FOUNDATIONS OF DATA SCIENCE DR.G.U.POPE COLLEGE OF ENGINEERING
3.
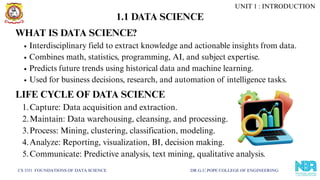
1.1 DATA SCIENCE
CS3351 FOUNDATIONS OF DATA SCIENCE DR.G.U.POPE COLLEGE OF ENGINEERING
WHAT IS DATA SCIENCE?
Interdisciplinary field to extract knowledge and actionable insights from data.
Combines math, statistics, programming, AI, and subject expertise.
Predicts future trends using historical data and machine learning.
Used for business decisions, research, and automation of intelligence tasks.
LIFE CYCLE OF DATA SCIENCE
1.Capture: Data acquisition and extraction.
2.Maintain: Data warehousing, cleansing, and processing.
3.Process: Mining, clustering, classification, modeling.
4.Analyze: Reporting, visualization, BI, decision making.
5.Communicate: Predictive analysis, text mining, qualitative analysis.
UNIT 1 : INTRODUCTION
4.
UNIT 1 :INTRODUCTION
CS 3351 FOUNDATIONS OF DATA SCIENCE DR.G.U.POPE COLLEGE OF ENGINEERING
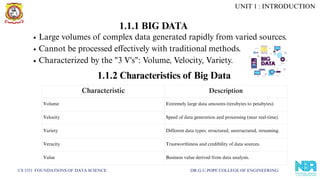
1.1.1 BIG DATA
Large volumes of complex data generated rapidly from varied sources.
Cannot be processed effectively with traditional methods.
Characterized by the "3 V's": Volume, Velocity, Variety.
1.1.2 Characteristics of Big Data
Characteristic Description
Volume Extremely large data amounts (terabytes to petabytes).
Velocity Speed of data generation and processing (near real-time).
Variety Different data types: structured, unstructured, streaming.
Veracity Trustworthiness and credibility of data sources.
Value Business value derived from data analysis.
5.
CS 3351 FOUNDATIONSOF DATA SCIENCE DR.G.U.POPE COLLEGE OF ENGINEERING
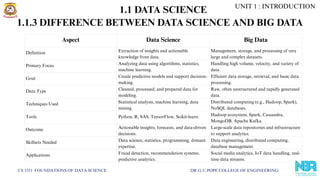
1.1.3 DIFFERENCE BETWEEN DATA SCIENCE AND BIG DATA
Aspect Data Science Big Data
Definition Extraction of insights and actionable
knowledge from data.
Management, storage, and processing of very
large and complex datasets.
Primary Focus Analyzing data using algorithms, statistics,
machine learning.
Handling high volume, velocity, and variety of
data.
Goal Create predictive models and support decision-
making.
Efficient data storage, retrieval, and basic data
processing.
Data Type Cleaned, processed, and prepared data for
modeling.
Raw, often unstructured and rapidly generated
data.
Techniques Used Statistical analysis, machine learning, data
mining.
Distributed computing (e.g., Hadoop, Spark),
NoSQL databases.
Tools Python, R, SAS, TensorFlow, Scikit-learn. Hadoop ecosystem, Spark, Cassandra,
MongoDB, Apache Kafka.
Outcome Actionable insights, forecasts, and data-driven
decisions.
Large-scale data repositories and infrastructure
to support analytics.
Skillsets Needed Data science, statistics, programming, domain
expertise.
Data engineering, distributed computing,
database management.
Applications Fraud detection, recommendation systems,
predictive analytics.
Social media analytics, IoT data handling, real-
time data streams.
UNIT 1 : INTRODUCTION
1.1 DATA SCIENCE
6.
CS 3351 FOUNDATIONSOF DATA SCIENCE DR.G.U.POPE COLLEGE OF ENGINEERING
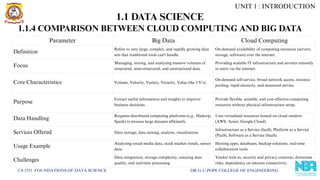
1.1.4 COMPARISON BETWEEN CLOUD COMPUTING AND BIG DATA
Parameter Big Data Cloud Computing
Definition
Refers to very large, complex, and rapidly growing data
sets that traditional tools can't handle.
On-demand availability of computing resources (servers,
storage, software) over the internet.
Focus
Managing, storing, and analyzing massive volumes of
structured, semi-structured, and unstructured data.
Providing scalable IT infrastructure and services remotely
to users via the internet.
Core Characteristics Volume, Velocity, Variety, Veracity, Value (the 5 V’s).
On-demand self-service, broad network access, resource
pooling, rapid elasticity, and measured service.
Purpose
Extract useful information and insights to improve
business decisions.
Provide flexible, scalable, and cost-effective computing
resources without physical infrastructure setup.
Data Handling
Requires distributed computing platforms (e.g., Hadoop,
Spark) to process large datasets efficiently.
Uses virtualized resources hosted on cloud vendors
(AWS, Azure, Google Cloud).
Services Offered Data storage, data mining, analysis, visualization.
Infrastructure as a Service (IaaS), Platform as a Service
(PaaS), Software as a Service (SaaS).
Usage Example
Analyzing social media data, stock market trends, sensor
data.
Hosting apps, databases, backup solutions, real-time
collaboration tools.
Challenges
Data integration, storage complexity, ensuring data
quality, and real-time processing.
Vendor lock-in, security and privacy concerns, downtime
risks, dependency on internet connectivity.
UNIT 1 : INTRODUCTION
1.1 DATA SCIENCE
7.
CS 3351 FOUNDATIONSOF DATA SCIENCE DR.G.U.POPE COLLEGE OF ENGINEERING
DATA SCIENCE VS BIG DATA
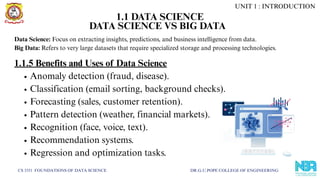
Data Science: Focus on extracting insights, predictions, and business intelligence from data.
Big Data: Refers to very large datasets that require specialized storage and processing technologies.
1.1.5 Benefits and Uses of Data Science
Anomaly detection (fraud, disease).
Classification (email sorting, background checks).
Forecasting (sales, customer retention).
Pattern detection (weather, financial markets).
Recognition (face, voice, text).
Recommendation systems.
Regression and optimization tasks.
UNIT 1 : INTRODUCTION
1.1 DATA SCIENCE
8.
CS 3351 FOUNDATIONSOF DATA SCIENCE DR.G.U.POPE COLLEGE OF ENGINEERING
DATA SCIENCE VS BIG DATA
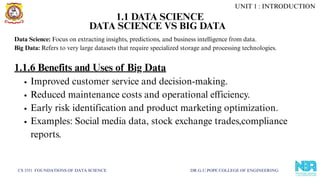
Data Science: Focus on extracting insights, predictions, and business intelligence from data.
Big Data: Refers to very large datasets that require specialized storage and processing technologies.
1.1.6 Benefits and Uses of Big Data
Improved customer service and decision-making.
Reduced maintenance costs and operational efficiency.
Early risk identification and product marketing optimization.
Examples: Social media data, stock exchange trades,compliance
reports.
UNIT 1 : INTRODUCTION
1.1 DATA SCIENCE
9.
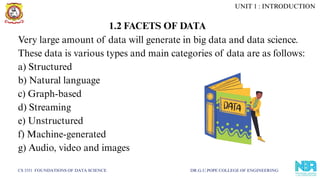
Very large amountof data will generate in big data and data science.
These data is various types and main categories of data are as follows:
a) Structured
b) Natural language
c) Graph-based
d) Streaming
e) Unstructured
f) Machine-generated
g) Audio, video and images
CS 3351 FOUNDATIONS OF DATA SCIENCE DR.G.U.POPE COLLEGE OF ENGINEERING
1.2 FACETS OF DATA
UNIT 1 : INTRODUCTION
10.
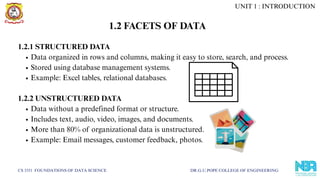
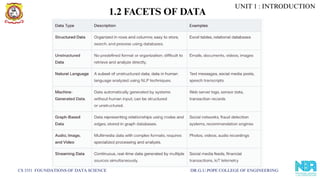
1.2.1 STRUCTURED DATA
Dataorganized in rows and columns, making it easy to store, search, and process.
Stored using database management systems.
Example: Excel tables, relational databases.
1.2.2 UNSTRUCTURED DATA
Data without a predefined format or structure.
Includes text, audio, video, images, and documents.
More than 80% of organizational data is unstructured.
Example: Email messages, customer feedback, photos.
CS 3351 FOUNDATIONS OF DATA SCIENCE DR.G.U.POPE COLLEGE OF ENGINEERING
1.2 FACETS OF DATA
UNIT 1 : INTRODUCTION
11.
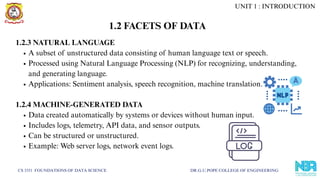
1.2.3 NATURAL LANGUAGE
Asubset of unstructured data consisting of human language text or speech.
Processed using Natural Language Processing (NLP) for recognizing, understanding,
and generating language.
Applications: Sentiment analysis, speech recognition, machine translation.
1.2.4 MACHINE-GENERATED DATA
Data created automatically by systems or devices without human input.
Includes logs, telemetry, API data, and sensor outputs.
Can be structured or unstructured.
Example: Web server logs, network event logs.
CS 3351 FOUNDATIONS OF DATA SCIENCE DR.G.U.POPE COLLEGE OF ENGINEERING
1.2 FACETS OF DATA
UNIT 1 : INTRODUCTION
12.
CS 3351 FOUNDATIONSOF DATA SCIENCE DR.G.U.POPE COLLEGE OF ENGINEERING
1.2 FACETS OF DATA
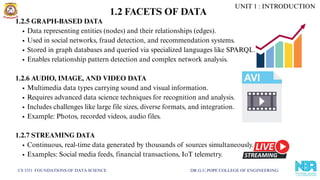
1.2.5 GRAPH-BASED DATA
Data representing entities (nodes) and their relationships (edges).
Used in social networks, fraud detection, and recommendation systems.
Stored in graph databases and queried via specialized languages like SPARQL.
Enables relationship pattern detection and complex network analysis.
1.2.6 AUDIO, IMAGE, AND VIDEO DATA
Multimedia data types carrying sound and visual information.
Requires advanced data science techniques for recognition and analysis.
Includes challenges like large file sizes, diverse formats, and integration.
Example: Photos, recorded videos, audio files.
1.2.7 STREAMING DATA
Continuous, real-time data generated by thousands of sources simultaneously.
Examples: Social media feeds, financial transactions, IoT telemetry.
UNIT 1 : INTRODUCTION
13.
CS 3351 FOUNDATIONSOF DATA SCIENCE DR.G.U.POPE COLLEGE OF ENGINEERING
1.2 FACETS OF DATA
UNIT 1 : INTRODUCTION
14.
CS 3351 FOUNDATIONSOF DATA SCIENCE DR.G.U.POPE COLLEGE OF ENGINEERING
1.2.8 DIFFERENCE BETWEEN STRUCTURED AND UNSTRUCTURED DATA
Aspect Structured Data Unstructured Data
Format
Organized tables (rows &
columns)
No fixed format or
organization
Example
Database records, Excel
sheets
Emails, videos, social media
posts
Ease of Processing
Easily processed with SQL
queries
Requires advanced tools
like NLP, image processing
Usage
Transactional, operational
data
Media files, natural
language, sensor data
UNIT 1 : INTRODUCTION
1.2 FACETS OF DATA
15.
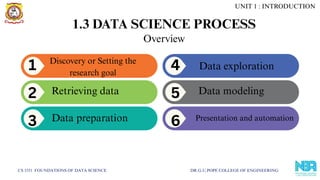
1.3 DATA SCIENCEPROCESS
CS 3351 FOUNDATIONS OF DATA SCIENCE DR.G.U.POPE COLLEGE OF ENGINEERING
Discovery or Setting the
research goal
Retrieving data
Data preparation
Data exploration
Data modeling
Presentation and automation
4
5
6
1
2
3
Overview
UNIT 1 : INTRODUCTION
16.
DATA SCIENCE PROCESS
CS3351 FOUNDATIONS OF DATA SCIENCE DR.G.U.POPE COLLEGE OF ENGINEERING
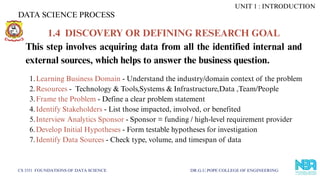
1.4 DISCOVERY OR DEFINING RESEARCH GOAL
This step involves acquiring data from all the identified internal and
external sources, which helps to answer the business question.
1.Learning Business Domain - Understand the industry/domain context of the problem
2.Resources - Technology & Tools,Systems & Infrastructure,Data ,Team/People
3.Frame the Problem - Define a clear problem statement
4.Identify Stakeholders - List those impacted, involved, or benefited
5.Interview Analytics Sponsor - Sponsor = funding / high-level requirement provider
6.Develop Initial Hypotheses - Form testable hypotheses for investigation
7.Identify Data Sources - Check type, volume, and timespan of data
UNIT 1 : INTRODUCTION
17.
DATA SCIENCE PROCESS
CS3351 FOUNDATIONS OF DATA SCIENCE DR.G.U.POPE COLLEGE OF ENGINEERING
1.5 RETRIEVING DATA
It collection of data which required for project. This is the process of
gaining a business understanding of the data user have and deciphering
what each piece of data means.
1.Internal Data – Start with company-owned data stored in repositories.
2.Data Repositories – Structured systems like warehouses, lakes, marts for
storage.
3.External Data – Acquire missing data from third-party, public, or
government sources.
4.Data Quality Checks – Clean, validate, and verify data to ensure reliability.
UNIT 1 : INTRODUCTION
18.
DATA SCIENCE PROCESS
CS3351 FOUNDATIONS OF DATA SCIENCE DR.G.U.POPE COLLEGE OF ENGINEERING
1.6 DATA PREPARATION
Data can have many inconsistencies like missing values, blank columns, an
incorrect data format, which needs to be cleaned. We need to process, explore
and condition data before modeling. The cleandata, gives the better
predictions.
1.Data Cleaning
2.Outlier Detection
3.Handling Missing Values
4.Handling Noisy Data
5.Correct Errors Early
6.Combine Data
7.Transform Data
UNIT 1 : INTRODUCTION
19.
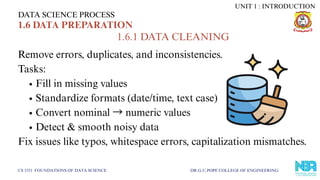
Remove errors, duplicates,and inconsistencies.
Tasks:
Fill in missing values
Standardize formats (date/time, text case)
Convert nominal →numeric values
Detect & smooth noisy data
Fix issues like typos, whitespace errors, capitalization mismatches.
DATA SCIENCE PROCESS
CS 3351 FOUNDATIONS OF DATA SCIENCE DR.G.U.POPE COLLEGE OF ENGINEERING
1.6 DATA PREPARATION
1.6.1 DATA CLEANING
UNIT 1 : INTRODUCTION
20.
DATA SCIENCE PROCESS
CS3351 FOUNDATIONS OF DATA SCIENCE DR.G.U.POPE COLLEGE OF ENGINEERING
1.6 DATA PREPARATION
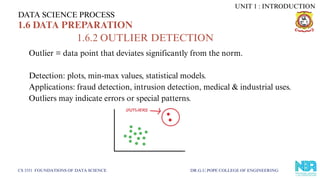
1.6.2 OUTLIER DETECTION
Outlier = data point that deviates significantly from the norm.
Detection: plots, min-max values, statistical models.
Applications: fraud detection, intrusion detection, medical & industrial uses.
Outliers may indicate errors or special patterns.
UNIT 1 : INTRODUCTION
21.
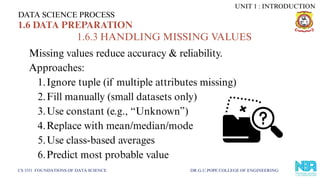
Missing values reduceaccuracy & reliability.
Approaches:
1.Ignore tuple (if multiple attributes missing)
2.Fill manually (small datasets only)
3.Use constant (e.g., “Unknown”)
4.Replace with mean/median/mode
5.Use class-based averages
6.Predict most probable value
DATA SCIENCE PROCESS
CS 3351 FOUNDATIONS OF DATA SCIENCE DR.G.U.POPE COLLEGE OF ENGINEERING
1.6 DATA PREPARATION
1.6.3 HANDLING MISSING VALUES
UNIT 1 : INTRODUCTION
22.
DATA SCIENCE PROCESS
CS3351 FOUNDATIONS OF DATA SCIENCE DR.G.U.POPE COLLEGE OF ENGINEERING
1.6 DATA PREPARATION
1.6.3.1 HANDLING NOISY DATA
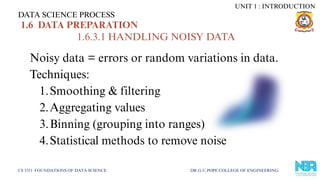
Noisy data = errors or random variations in data.
Techniques:
1.Smoothing & filtering
2.Aggregating values
3.Binning (grouping into ranges)
4.Statistical methods to remove noise
UNIT 1 : INTRODUCTION
23.
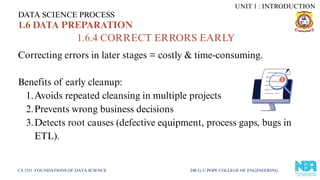
Correcting errors inlater stages = costly & time-consuming.
Benefits of early cleanup:
1.Avoids repeated cleansing in multiple projects
2.Prevents wrong business decisions
3.Detects root causes (defective equipment, process gaps, bugs in
ETL).
DATA SCIENCE PROCESS
CS 3351 FOUNDATIONS OF DATA SCIENCE DR.G.U.POPE COLLEGE OF ENGINEERING
1.6 DATA PREPARATION
1.6.4 CORRECT ERRORS EARLY
UNIT 1 : INTRODUCTION
24.
DATA SCIENCE PROCESS
CS3351 FOUNDATIONS OF DATA SCIENCE DR.G.U.POPE COLLEGE OF ENGINEERING
1.6 DATA PREPARATION
1.6.5 COMBINE DATA
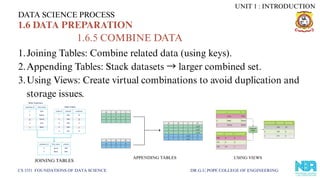
1.Joining Tables: Combine related data (using keys).
2.Appending Tables: Stack datasets →larger combined set.
3.Using Views: Create virtual combinations to avoid duplication and
storage issues.
JOINING TABLES
APPENDING TABLES USING VIEWS
UNIT 1 : INTRODUCTION
25.
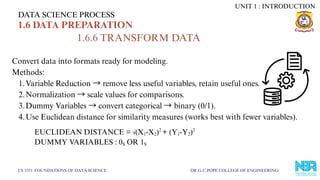
Convert data intoformats ready for modeling.
Methods:
1.Variable Reduction →remove less useful variables, retain useful ones.
2.Normalization →scale values for comparisons.
3.Dummy Variables →convert categorical →binary (0/1).
4.Use Euclidean distance for similarity measures (works best with fewer variables).
DATA SCIENCE PROCESS
CS 3351 FOUNDATIONS OF DATA SCIENCE DR.G.U.POPE COLLEGE OF ENGINEERING
1.6 DATA PREPARATION
1.6.6 TRANSFORM DATA
EUCLIDEAN DISTANCE = √(X -X ) + (Y -Y )
1 2
2
1 2
2
DUMMY VARIABLES : 0 OR 1
S S
UNIT 1 : INTRODUCTION
26.
DATA SCIENCE PROCESS
CS3351 FOUNDATIONS OF DATA SCIENCE DR.G.U.POPE COLLEGE OF ENGINEERING
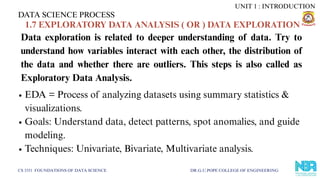
1.7 EXPLORATORY DATA ANALYSIS ( OR ) DATA EXPLORATION
Data exploration is related to deeper understanding of data. Try to
understand how variables interact with each other, the distribution of
the data and whether there are outliers. This steps is also called as
Exploratory Data Analysis.
EDA = Process of analyzing datasets using summary statistics &
visualizations.
Goals: Understand data, detect patterns, spot anomalies, and guide
modeling.
Techniques: Univariate, Bivariate, Multivariate analysis.
UNIT 1 : INTRODUCTION
27.
1.7.1 PURPOSE OFEDA
EDA helps data scientists to:
1.Maximize insight into the dataset
2.Uncover underlying structure
3.Extract key variables
4.Identify outliers & anomalies
5.Test assumptions
6.Develop simple (parsimonious) models
7.Optimize factor settings
DATA SCIENCE PROCESS
CS 3351 FOUNDATIONS OF DATA SCIENCE DR.G.U.POPE COLLEGE OF ENGINEERING
1.7 EXPLORATORY DATA ANALYSIS ( OR ) DATA EXPLORATION
UNIT 1 : INTRODUCTION
28.
DATA SCIENCE PROCESS
CS3351 FOUNDATIONS OF DATA SCIENCE DR.G.U.POPE COLLEGE OF ENGINEERING
1.7.2 KEY FUNCTIONS OF EDA
1.Describe data (basic stats, types)
2.Explore data distributions (shape, spread, skewness)
3.Check relationships between variables
4.Detect unusual patterns/outliers
5.Group data and compare across categories
6.Note differences & dependencies
UNIT 1 : INTRODUCTION
1.7 EXPLORATORY DATA ANALYSIS ( OR ) DATA EXPLORATION
29.
DATA SCIENCE PROCESS
CS3351 FOUNDATIONS OF DATA SCIENCE DR.G.U.POPE COLLEGE OF ENGINEERING
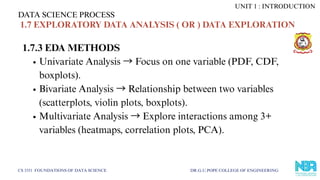
1.7.3 EDA METHODS
Univariate Analysis →Focus on one variable (PDF, CDF,
boxplots).
Bivariate Analysis →Relationship between two variables
(scatterplots, violin plots, boxplots).
Multivariate Analysis →Explore interactions among 3+
variables (heatmaps, correlation plots, PCA).
UNIT 1 : INTRODUCTION
1.7 EXPLORATORY DATA ANALYSIS ( OR ) DATA EXPLORATION
30.
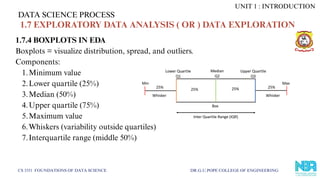
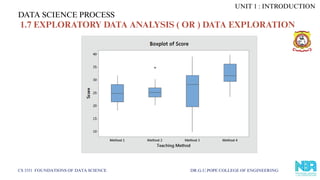
1.7.4 BOXPLOTS INEDA
Boxplots = visualize distribution, spread, and outliers.
Components:
1.Minimum value
2.Lower quartile (25%)
3.Median (50%)
4.Upper quartile (75%)
5.Maximum value
6.Whiskers (variability outside quartiles)
7.Interquartile range (middle 50%)
DATA SCIENCE PROCESS
CS 3351 FOUNDATIONS OF DATA SCIENCE DR.G.U.POPE COLLEGE OF ENGINEERING
UNIT 1 : INTRODUCTION
1.7 EXPLORATORY DATA ANALYSIS ( OR ) DATA EXPLORATION
31.
DATA SCIENCE PROCESS
CS3351 FOUNDATIONS OF DATA SCIENCE DR.G.U.POPE COLLEGE OF ENGINEERING
UNIT 1 : INTRODUCTION
1.7 EXPLORATORY DATA ANALYSIS ( OR ) DATA EXPLORATION
32.
DATA SCIENCE PROCESS
CS3351 FOUNDATIONS OF DATA SCIENCE DR.G.U.POPE COLLEGE OF ENGINEERING
1.8 BUILD THE MODELS / DATA MODELING
In this step, the actual model building process starts. Here, Data
scientist distributes datasets for training and testing. Techniques like
association, classification and clustering are applied to the training
data set. The model, once prepared, is tested against the "testing"
dataset.
1.Model & Variable Selection
2.Model Execution
3.Model Diagnostics & Comparison
8Process is iterative – refine until best model is found.
UNIT 1 : INTRODUCTION
33.
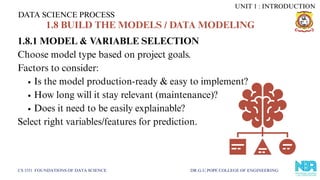
1.8.1 MODEL &VARIABLE SELECTION
Choose model type based on project goals.
Factors to consider:
Is the model production-ready & easy to implement?
How long will it stay relevant (maintenance)?
Does it need to be easily explainable?
Select right variables/features for prediction.
DATA SCIENCE PROCESS
CS 3351 FOUNDATIONS OF DATA SCIENCE DR.G.U.POPE COLLEGE OF ENGINEERING
1.8 BUILD THE MODELS / DATA MODELING
UNIT 1 : INTRODUCTION
34.
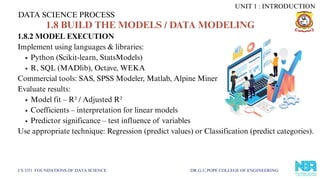
1.8.2 MODEL EXECUTION
Implementusing languages & libraries:
Python (Scikit-learn, StatsModels)
R, SQL (MADlib), Octave, WEKA
Commercial tools: SAS, SPSS Modeler, Matlab, Alpine Miner
Evaluate results:
Model fit – R² / Adjusted R²
Coefficients – interpretation for linear models
Predictor significance – test influence of variables
Use appropriate technique: Regression (predict values) or Classification (predict categories).
DATA SCIENCE PROCESS
CS 3351 FOUNDATIONS OF DATA SCIENCE DR.G.U.POPE COLLEGE OF ENGINEERING
UNIT 1 : INTRODUCTION
1.8 BUILD THE MODELS / DATA MODELING
35.
DATA SCIENCE PROCESS
CS3351 FOUNDATIONS OF DATA SCIENCE DR.G.U.POPE COLLEGE OF ENGINEERING
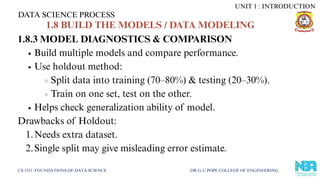
1.8.3 MODEL DIAGNOSTICS & COMPARISON
Build multiple models and compare performance.
Use holdout method:
Split data into training (70–80%) & testing (20–30%).
Train on one set, test on the other.
Helps check generalization ability of model.
Drawbacks of Holdout:
1.Needs extra dataset.
2.Single split may give misleading error estimate.
UNIT 1 : INTRODUCTION
1.8 BUILD THE MODELS / DATA MODELING
36.
DATA SCIENCE PROCESS
CS3351 FOUNDATIONS OF DATA SCIENCE DR.G.U.POPE COLLEGE OF ENGINEERING
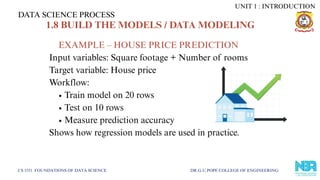
EXAMPLE – HOUSE PRICE PREDICTION
Input variables: Square footage + Number of rooms
Target variable: House price
Workflow:
Train model on 20 rows
Test on 10 rows
Measure prediction accuracy
Shows how regression models are used in practice.
UNIT 1 : INTRODUCTION
1.8 BUILD THE MODELS / DATA MODELING
37.
DATA SCIENCE PROCESS
CS3351 FOUNDATIONS OF DATA SCIENCE DR.G.U.POPE COLLEGE OF ENGINEERING
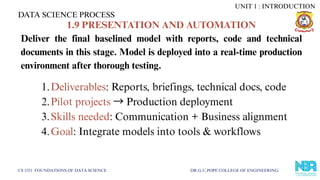
1.9 PRESENTATION AND AUTOMATION
Deliver the final baselined model with reports, code and technical
documents in this stage. Model is deployed into a real-time production
environment after thorough testing.
1.Deliverables: Reports, briefings, technical docs, code
2.Pilot projects →Production deployment
3.Skills needed: Communication + Business alignment
4.Goal: Integrate models into tools & workflows
UNIT 1 : INTRODUCTION
38.
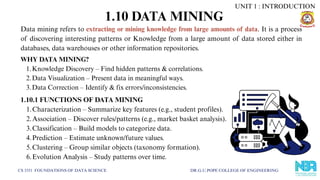
1.10 DATA MINING
CS3351 FOUNDATIONS OF DATA SCIENCE DR.G.U.POPE COLLEGE OF ENGINEERING
Data mining refers to extracting or mining knowledge from large amounts of data. It is a process
of discovering interesting patterns or Knowledge from a large amount of data stored either in
databases, data warehouses or other information repositories.
WHY DATA MINING?
1.Knowledge Discovery – Find hidden patterns & correlations.
2.Data Visualization – Present data in meaningful ways.
3.Data Correction – Identify & fix errors/inconsistencies.
1.10.1 FUNCTIONS OF DATA MINING
1.Characterization – Summarize key features (e.g., student profiles).
2.Association – Discover rules/patterns (e.g., market basket analysis).
3.Classification – Build models to categorize data.
4.Prediction – Estimate unknown/future values.
5.Clustering – Group similar objects (taxonomy formation).
6.Evolution Analysis – Study patterns over time.
UNIT 1 : INTRODUCTION
39.
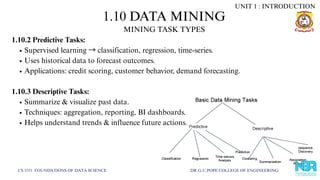
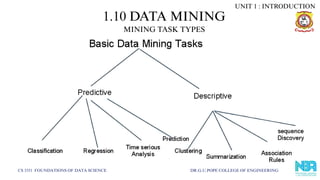
1.10.2 Predictive Tasks:
Supervisedlearning →classification, regression, time-series.
Uses historical data to forecast outcomes.
Applications: credit scoring, customer behavior, demand forecasting.
1.10.3 Descriptive Tasks:
Summarize & visualize past data.
Techniques: aggregation, reporting, BI dashboards.
Helps understand trends & influence future actions.
1.10 DATA MINING
CS 3351 FOUNDATIONS OF DATA SCIENCE DR.G.U.POPE COLLEGE OF ENGINEERING
MINING TASK TYPES
UNIT 1 : INTRODUCTION
40.
1.10 DATA MINING
CS3351 FOUNDATIONS OF DATA SCIENCE DR.G.U.POPE COLLEGE OF ENGINEERING
MINING TASK TYPES
UNIT 1 : INTRODUCTION
41.
CS 3351 FOUNDATIONSOF DATA SCIENCE DR.G.U.POPE COLLEGE OF ENGINEERING
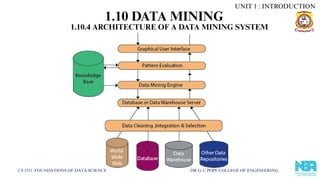
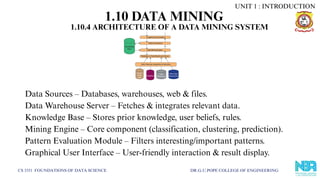
1.10.4 ARCHITECTURE OF A DATA MINING SYSTEM
UNIT 1 : INTRODUCTION
1.10 DATA MINING
42.
CS 3351 FOUNDATIONSOF DATA SCIENCE DR.G.U.POPE COLLEGE OF ENGINEERING
Data Sources – Databases, warehouses, web & files.
Data Warehouse Server – Fetches & integrates relevant data.
Knowledge Base – Stores prior knowledge, user beliefs, rules.
Mining Engine – Core component (classification, clustering, prediction).
Pattern Evaluation Module – Filters interesting/important patterns.
Graphical User Interface – User-friendly interaction & result display.
UNIT 1 : INTRODUCTION
1.10.4 ARCHITECTURE OF A DATA MINING SYSTEM
1.10 DATA MINING
43.
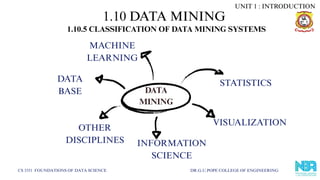
1.10 DATA MINING
CS3351 FOUNDATIONS OF DATA SCIENCE DR.G.U.POPE COLLEGE OF ENGINEERING
1.10.5 CLASSIFICATION OF DATA MINING SYSTEMS
OTHER
DISCIPLINES
VISUALIZATION
INFORMATION
SCIENCE
DATA
BASE
STATISTICS
MACHINE
LEARNING
DATA
MINING
UNIT 1 : INTRODUCTION
44.
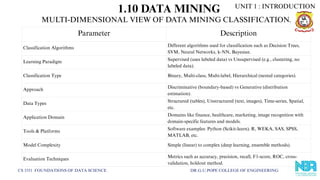
Parameter Description
Classification Algorithms
Differentalgorithms used for classification such as Decision Trees,
SVM, Neural Networks, k-NN, Bayesian.
Learning Paradigm
Supervised (uses labeled data) vs Unsupervised (e.g., clustering, no
labeled data).
Classification Type Binary, Multi-class, Multi-label, Hierarchical (nested categories).
Approach
Discriminative (boundary-based) vs Generative (distribution
estimation).
Data Types
Structured (tables), Unstructured (text, images), Time-series, Spatial,
etc.
Application Domain
Domains like finance, healthcare, marketing, image recognition with
domain-specific features and models.
Tools & Platforms
Software examples: Python (Scikit-learn), R, WEKA, SAS, SPSS,
MATLAB, etc.
Model Complexity Simple (linear) to complex (deep learning, ensemble methods).
Evaluation Techniques
Metrics such as accuracy, precision, recall, F1-score, ROC, cross-
validation, holdout method.
1.10 DATA MINING
CS 3351 FOUNDATIONS OF DATA SCIENCE DR.G.U.POPE COLLEGE OF ENGINEERING
MULTI-DIMENSIONAL VIEW OF DATA MINING CLASSIFICATION.
UNIT 1 : INTRODUCTION
45.
CS 3351 FOUNDATIONSOF DATA SCIENCE DR.G.U.POPE COLLEGE OF ENGINEERING
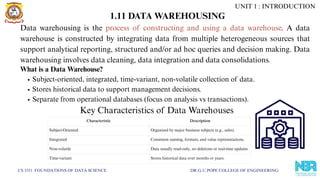
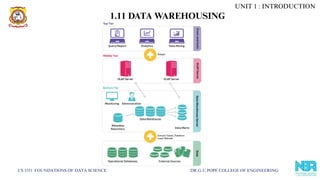
1.11 DATA WAREHOUSING
Data warehousing is the process of constructing and using a data warehouse. A data
warehouse is constructed by integrating data from multiple heterogeneous sources that
support analytical reporting, structured and/or ad hoc queries and decision making. Data
warehousing involves data cleaning, data integration and data consolidations.
What is a Data Warehouse?
Subject-oriented, integrated, time-variant, non-volatile collection of data.
Stores historical data to support management decisions.
Separate from operational databases (focus on analysis vs transactions).
Key Characteristics of Data Warehouses
Characteristic Description
Subject-Oriented Organized by major business subjects (e.g., sales).
Integrated Consistent naming, formats, and value representations.
Non-volatile Data usually read-only, no deletions or real-time updates.
Time-variant Stores historical data over months or years.
UNIT 1 : INTRODUCTION
46.
CS 3351 FOUNDATIONSOF DATA SCIENCE DR.G.U.POPE COLLEGE OF ENGINEERING
1.11 DATA WAREHOUSING
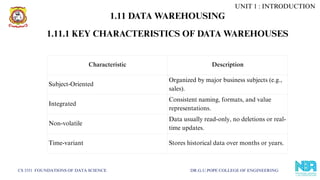
1.11.1 KEY CHARACTERISTICS OF DATA WAREHOUSES
Characteristic Description
Subject-Oriented
Organized by major business subjects (e.g.,
sales).
Integrated
Consistent naming, formats, and value
representations.
Non-volatile
Data usually read-only, no deletions or real-
time updates.
Time-variant Stores historical data over months or years.
UNIT 1 : INTRODUCTION
47.
CS 3351 FOUNDATIONSOF DATA SCIENCE DR.G.U.POPE COLLEGE OF ENGINEERING
1.11 DATA WAREHOUSING
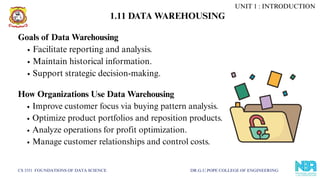
Goals of Data Warehousing
Facilitate reporting and analysis.
Maintain historical information.
Support strategic decision-making.
How Organizations Use Data Warehousing
Improve customer focus via buying pattern analysis.
Optimize product portfolios and reposition products.
Analyze operations for profit optimization.
Manage customer relationships and control costs.
UNIT 1 : INTRODUCTION
48.
CS 3351 FOUNDATIONSOF DATA SCIENCE DR.G.U.POPE COLLEGE OF ENGINEERING
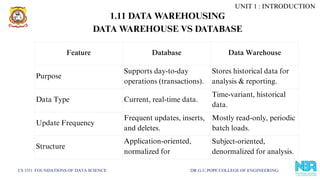
DATA WAREHOUSE VS DATABASE
Feature Database Data Warehouse
Purpose
Supports day-to-day
operations (transactions).
Stores historical data for
analysis & reporting.
Data Type Current, real-time data.
Time-variant, historical
data.
Update Frequency
Frequent updates, inserts,
and deletes.
Mostly read-only, periodic
batch loads.
Structure
Application-oriented,
normalized for
i
Subject-oriented,
denormalized for analysis.
UNIT 1 : INTRODUCTION
1.11 DATA WAREHOUSING
49.
CS 3351 FOUNDATIONSOF DATA SCIENCE DR.G.U.POPE COLLEGE OF ENGINEERING
1.11 DATA WAREHOUSING
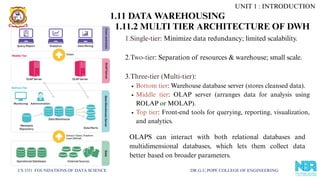
1.Single-tier: Minimize data redundancy; limited scalability.
2.Two-tier: Separation of resources & warehouse; small scale.
3.Three-tier (Multi-tier):
Bottom tier: Warehouse database server (stores cleansed data).
Middle tier: OLAP server (arranges data for analysis using
ROLAP or MOLAP).
Top tier: Front-end tools for querying, reporting, visualization,
and analytics.
OLAPS can interact with both relational databases and
multidimensional databases, which lets them collect data
better based on broader parameters.
UNIT 1 : INTRODUCTION
1.11.2 MULTI TIER ARCHITECTURE OF DWH
50.
CS 3351 FOUNDATIONSOF DATA SCIENCE DR.G.U.POPE COLLEGE OF ENGINEERING
1.11 DATA WAREHOUSING
UNIT 1 : INTRODUCTION
51.
CS 3351 FOUNDATIONSOF DATA SCIENCE DR.G.U.POPE COLLEGE OF ENGINEERING
1.11.3 NEEDS OF DATA WAREHOUSE
Business users need summarized, easy-to-understand data.
Store historical, time-variant data for trend analysis.
Support strategic decision-making.
Ensure data consistency across sources.
Provide high-speed query response for ad hoc demands.
1.11.4 BENEFITS OF DATA WAREHOUSING
Better understanding of business trends for forecasting.
Efficient handling of large data volumes with good performance.
Simplified data structure for end-user navigation & queries.
Easier to build and maintain complex queries compared to normalized databases.
Efficiently manage high demand for information.
UNIT 1 : INTRODUCTION
1.11 DATA WAREHOUSING
52.
CS 3351 FOUNDATIONSOF DATA SCIENCE DR.G.U.POPE COLLEGE OF ENGINEERING
UNIT 1 : INTRODUCTION
1.11 DATA WAREHOUSING
1.11.5 DIFFERENCE BETWEEN ODS AND DATA WAREHOUSE
Parameter Operational Data Store (ODS) Data Warehouse (DW)
Purpose
Supports day-to-day operational processes; provides
current, up-to-date data view.
Supports decision-making and analysis with historical data.
Data Content Current, volatile data; frequently updated. Historical, consolidated, and summarized data.
Query Complexity Simple and fast queries on recent data. Complex, ad hoc queries over large datasets.
Data Volatility Highly volatile; data continuously overwritten and updated. Non-volatile; data is read-only and stable over time.
Data Schema
Holds data as per source schema, smaller scope, often
normalized.
Uses denormalized schemas like star or snowflake for
analysis.
Data Integration Integrates data from multiple sources in near real-time.
Integrates and consolidates data from various sources after
ETL.
User Types Operational staff needing up-to-date transactional info.
Analysts, managers, executives requiring comprehensive
insights.
Performance Focus
Optimized for high-speed transactional queries and
updates.
Optimized for read-heavy complex analysis and reporting.
Data Volume Smaller volume focused on current operations. Large volume, stores years of data for historical analysis.
53.
CS 3351 FOUNDATIONSOF DATA SCIENCE DR.G.U.POPE COLLEGE OF ENGINEERING
1.11 DATA WAREHOUSING
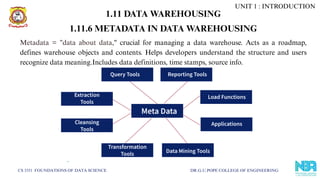
Metadata = "data about data," crucial for managing a data warehouse. Acts as a roadmap,
defines warehouse objects and contents. Helps developers understand the structure and users
recognize data meaning.Includes data definitions, time stamps, source info.
1.11.6 METADATA IN DATA WAREHOUSING
UNIT 1 : INTRODUCTION
54.
CS 3351 FOUNDATIONSOF DATA SCIENCE DR.G.U.POPE COLLEGE OF ENGINEERING
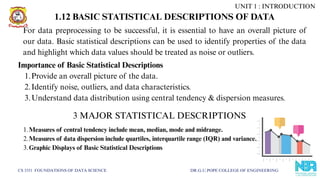
1.12 BASIC STATISTICAL DESCRIPTIONS OF DATA
Importance of Basic Statistical Descriptions
1.Provide an overall picture of the data.
2.Identify noise, outliers, and data characteristics.
3.Understand data distribution using central tendency & dispersion measures.
For data preprocessing to be successful, it is essential to have an overall picture of
our data. Basic statistical descriptions can be used to identify properties of the data
and highlight which data values should be treated as noise or outliers.
1.Measures of central tendency include mean, median, mode and midrange.
2.Measures of data dispersion include quartiles, interquartile range (IQR) and variance.
3.Graphic Displays of Basic Statistical Descriptions
3 MAJOR STATISTICAL DESCRIPTIONS
UNIT 1 : INTRODUCTION
55.
CS 3351 FOUNDATIONSOF DATA SCIENCE DR.G.U.POPE COLLEGE OF ENGINEERING
1.12 BASIC STATISTICAL DESCRIPTIONS OF DATA
1.12.1 Measures of central tendency include mean, median,
mode and midrange.
1.12.2 Measures of data dispersion include quartiles,
interquartile range (IQR) and variance.
1.12.3 Graphic Displays of Basic Statistical Descriptions
3 MAJOR STATISTICAL DESCRIPTIONS
UNIT 1 : INTRODUCTION
56.
CS 3351 FOUNDATIONSOF DATA SCIENCE DR.G.U.POPE COLLEGE OF ENGINEERING
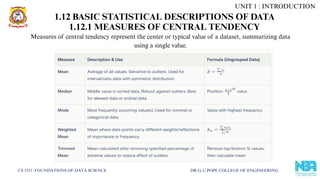
1.12.1 MEASURES OF CENTRAL TENDENCY
Measures of central tendency represent the center or typical value of a dataset, summarizing data
using a single value.
UNIT 1 : INTRODUCTION
1.12 BASIC STATISTICAL DESCRIPTIONS OF DATA
57.
CS 3351 FOUNDATIONSOF DATA SCIENCE DR.G.U.POPE COLLEGE OF ENGINEERING
1.12.1 MEASURES OF CENTRAL TENDENCY
EXAMPLE: MONTHLY SALARIES (USD)
Month Salary
January 105
February 95
March 105
April 105
May 100
Mean = (105+95+105+105+100)/5=102(105+95+105+105+100)/5=102
Median = middle value when ordered (95, 100, 105, 105, 105) = 105
Mode = most frequent value = 105
UNIT 1 : INTRODUCTION
1.12 BASIC STATISTICAL DESCRIPTIONS OF DATA
58.
CS 3351 FOUNDATIONSOF DATA SCIENCE DR.G.U.POPE COLLEGE OF ENGINEERING
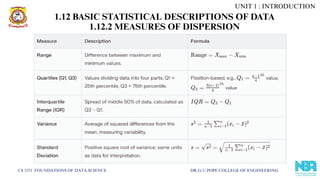
1.12.2 MEASURES OF DISPERSION
UNIT 1 : INTRODUCTION
1.12 BASIC STATISTICAL DESCRIPTIONS OF DATA
59.
CS 3351 FOUNDATIONSOF DATA SCIENCE DR.G.U.POPE COLLEGE OF ENGINEERING
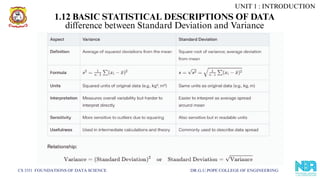
difference between Standard Deviation and Variance
UNIT 1 : INTRODUCTION
1.12 BASIC STATISTICAL DESCRIPTIONS OF DATA
60.
CS 3351 FOUNDATIONSOF DATA SCIENCE DR.G.U.POPE COLLEGE OF ENGINEERING
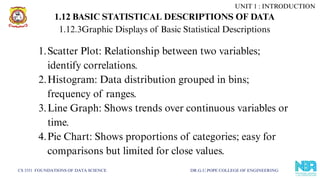
1.12.3Graphic Displays of Basic Statistical Descriptions
1.Scatter Plot: Relationship between two variables;
identify correlations.
2.Histogram: Data distribution grouped in bins;
frequency of ranges.
3.Line Graph: Shows trends over continuous variables or
time.
4.Pie Chart: Shows proportions of categories; easy for
comparisons but limited for close values.
UNIT 1 : INTRODUCTION
1.12 BASIC STATISTICAL DESCRIPTIONS OF DATA
61.
CS 3351 FOUNDATIONSOF DATA SCIENCE DR.G.U.POPE COLLEGE OF ENGINEERING
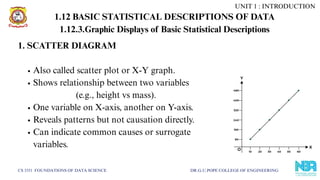
1. SCATTER DIAGRAM
Also called scatter plot or X-Y graph.
Shows relationship between two variables
(e.g., height vs mass).
One variable on X-axis, another on Y-axis.
Reveals patterns but not causation directly.
Can indicate common causes or surrogate
variables.
UNIT 1 : INTRODUCTION
1.12.3.Graphic Displays of Basic Statistical Descriptions
1.12 BASIC STATISTICAL DESCRIPTIONS OF DATA
62.
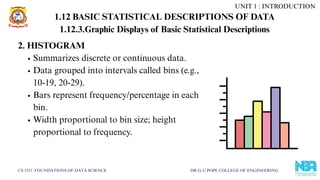
2. HISTOGRAM
Summarizes discreteor continuous data.
Data grouped into intervals called bins (e.g.,
10-19, 20-29).
Bars represent frequency/percentage in each
bin.
Width proportional to bin size; height
proportional to frequency.
CS 3351 FOUNDATIONS OF DATA SCIENCE DR.G.U.POPE COLLEGE OF ENGINEERING
UNIT 1 : INTRODUCTION
1.12.3.Graphic Displays of Basic Statistical Descriptions
1.12 BASIC STATISTICAL DESCRIPTIONS OF DATA
63.
CS 3351 FOUNDATIONSOF DATA SCIENCE DR.G.U.POPE COLLEGE OF ENGINEERING
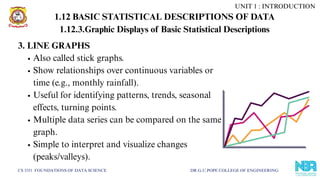
3. LINE GRAPHS
Also called stick graphs.
Show relationships over continuous variables or
time (e.g., monthly rainfall).
Useful for identifying patterns, trends, seasonal
effects, turning points.
Multiple data series can be compared on the same
graph.
Simple to interpret and visualize changes
(peaks/valleys).
UNIT 1 : INTRODUCTION
1.12.3.Graphic Displays of Basic Statistical Descriptions
1.12 BASIC STATISTICAL DESCRIPTIONS OF DATA
64.
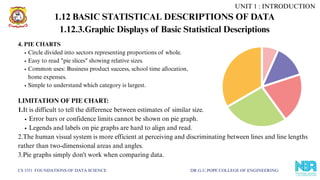
4. PIE CHARTS
Circledivided into sectors representing proportions of whole.
Easy to read "pie slices" showing relative sizes.
Common uses: Business product success, school time allocation,
home expenses.
Simple to understand which category is largest.
CS 3351 FOUNDATIONS OF DATA SCIENCE DR.G.U.POPE COLLEGE OF ENGINEERING
LIMITATION OF PIE CHART:
1.It is difficult to tell the difference between estimates of similar size.
Error bars or confidence limits cannot be shown on pie graph.
Legends and labels on pie graphs are hard to align and read.
2.The human visual system is more efficient at perceiving and discriminating between lines and line lengths
rather than two-dimensional areas and angles.
3.Pie graphs simply don't work when comparing data.
UNIT 1 : INTRODUCTION
1.12.3.Graphic Displays of Basic Statistical Descriptions
1.12 BASIC STATISTICAL DESCRIPTIONS OF DATA