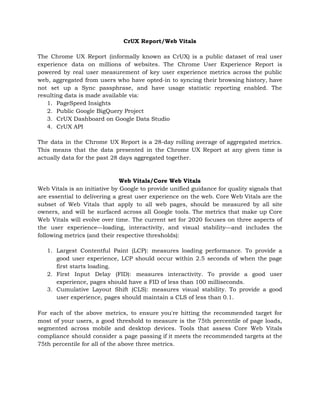
CrUX Report/Web Vitals 
 
The Chrome UX Report (informally known as CrUX) is a public dataset of real user
                             
experience data on millions of websites. The Chrome User Experience Report is
                       
powered by real user measurement of key user experience metrics across the public
                         
web, aggregated from users who have opted-in to syncing their browsing history, have
                         
not set up a Sync passphrase, and have usage statistic reporting enabled. The
                         
resulting data is made available via: 
1. PageSpeed Insights 
2. Public Google BigQuery Project 
3. CrUX Dashboard on Google Data Studio 
4. CrUX API 
 
The data in the Chrome UX Report is a 28-day rolling average of aggregated metrics.
                             
This means that the data presented in the Chrome UX Report at any given time is
                               
actually data for the past 28 days aggregated together. 
 
 
Web Vitals/Core Web Vitals 
Web Vitals is an initiative by Google to provide unified guidance for quality signals that
                             
are essential to delivering a great user experience on the web. Core Web Vitals are the
                               
subset of Web Vitals that apply to all web pages, should be measured by all site
                               
owners, and will be surfaced across all Google tools. The metrics that make up Core
                             
Web Vitals will evolve over time. The current set for 2020 focuses on three aspects of
                               
the user experience—loading, interactivity, and visual stability—and includes the
                 
following metrics (and their respective thresholds): 
 
1. Largest Contentful Paint (LCP): measures loading performance. To provide a
                   
good user experience, LCP should occur within 2.5 seconds of when the page
                         
first starts loading. 
2. First Input Delay (FID): measures interactivity. To provide a good user
                     
experience, pages should have a FID of less than 100 milliseconds. 
3. Cumulative Layout Shift (CLS): measures visual stability. To provide a good
                     
user experience, pages should maintain a CLS of less than 0.1. 
 
For each of the above metrics, to ensure you're hitting the recommended target for
                           
most of your users, a good threshold to measure is the 75th percentile of page loads,
                               
segmented across mobile and desktop devices. Tools that assess Core Web Vitals
                       
compliance should consider a page passing if it meets the recommended targets at the
                           
75th percentile for all of the above three metrics. 


About PageSpeed Insights 
PageSpeed Insights (PSI) reports on the performance of a page on both mobile and
                           
desktop devices, and provides suggestions on how that page may be improved. PSI
                         
provides both field and lab data about a page. 
 
Field Data 
When PSI is given a URL, it will look it up in the Chrome User Experience Report
                                 
(CrUX) dataset. If available, PSI reports the First Contentful Paint (FCP), First Input
                         
Delay (FID), Largest Contentful Paint (LCP), and Cumulative Layout Shift (CLS) metric
                       
data for the origin and potentially the specific page URL.  
PSI reports the 75th percentile for all metrics. The 75th percentile is selected so that
                             
developers can understand the most frustrating user experiences on their site. These
                       
field metric values are classified as good/needs improvement/poor by applying the
                     
same thresholds shown above. 
 
Lab Data 
PSI uses Lighthouse to analyze the given URL, generating a performance score that
                         
estimates the page's performance on different metrics 
 
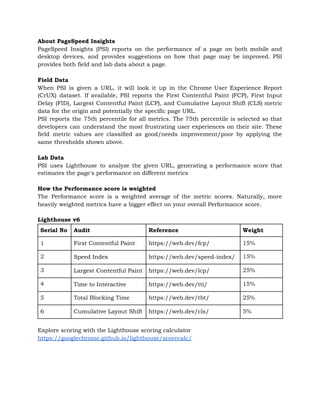
How the Performance score is weighted 
The Performance score is a weighted average of the metric scores. Naturally, more
                         
heavily weighted metrics have a bigger effect on your overall Performance score. 
 
Lighthouse v6 
 
Explore scoring with the Lighthouse scoring calculator 
https://googlechrome.github.io/lighthouse/scorecalc/ 


Serial No  Audit  Reference  Weight 
1  First Contentful Paint  https://web.dev/fcp/  15% 
2  Speed Index  https://web.dev/speed-index/  15% 
3  Largest Contentful Paint  https://web.dev/lcp/  25% 
4  Time to Interactive  https://web.dev/tti/  15% 
5  Total Blocking Time  https://web.dev/tbt/  25% 
6  Cumulative Layout Shift  https://web.dev/cls/  5% 
References 
https://developers.google.com/web/tools/chrome-user-experience-report 
https://web.dev/chrome-ux-report/ 
https://web.dev/vitals/ 
https://developers.google.com/speed/docs/insights/v5/about 

CrUx Report and Improving Web vitals

  • 1.
    CrUX Report/Web Vitals    TheChrome UX Report (informally known as CrUX) is a public dataset of real user                               experience data on millions of websites. The Chrome User Experience Report is                         powered by real user measurement of key user experience metrics across the public                           web, aggregated from users who have opted-in to syncing their browsing history, have                           not set up a Sync passphrase, and have usage statistic reporting enabled. The                           resulting data is made available via:  1. PageSpeed Insights  2. Public Google BigQuery Project  3. CrUX Dashboard on Google Data Studio  4. CrUX API    The data in the Chrome UX Report is a 28-day rolling average of aggregated metrics.                               This means that the data presented in the Chrome UX Report at any given time is                                 actually data for the past 28 days aggregated together.      Web Vitals/Core Web Vitals  Web Vitals is an initiative by Google to provide unified guidance for quality signals that                               are essential to delivering a great user experience on the web. Core Web Vitals are the                                 subset of Web Vitals that apply to all web pages, should be measured by all site                                 owners, and will be surfaced across all Google tools. The metrics that make up Core                               Web Vitals will evolve over time. The current set for 2020 focuses on three aspects of                                 the user experience—loading, interactivity, and visual stability—and includes the                   following metrics (and their respective thresholds):    1. Largest Contentful Paint (LCP): measures loading performance. To provide a                     good user experience, LCP should occur within 2.5 seconds of when the page                           first starts loading.  2. First Input Delay (FID): measures interactivity. To provide a good user                       experience, pages should have a FID of less than 100 milliseconds.  3. Cumulative Layout Shift (CLS): measures visual stability. To provide a good                       user experience, pages should maintain a CLS of less than 0.1.    For each of the above metrics, to ensure you're hitting the recommended target for                             most of your users, a good threshold to measure is the 75th percentile of page loads,                                 segmented across mobile and desktop devices. Tools that assess Core Web Vitals                         compliance should consider a page passing if it meets the recommended targets at the                             75th percentile for all of the above three metrics.       
  • 2.
    About PageSpeed Insights  PageSpeedInsights (PSI) reports on the performance of a page on both mobile and                             desktop devices, and provides suggestions on how that page may be improved. PSI                           provides both field and lab data about a page.    Field Data  When PSI is given a URL, it will look it up in the Chrome User Experience Report                                   (CrUX) dataset. If available, PSI reports the First Contentful Paint (FCP), First Input                           Delay (FID), Largest Contentful Paint (LCP), and Cumulative Layout Shift (CLS) metric                         data for the origin and potentially the specific page URL.   PSI reports the 75th percentile for all metrics. The 75th percentile is selected so that                               developers can understand the most frustrating user experiences on their site. These                         field metric values are classified as good/needs improvement/poor by applying the                       same thresholds shown above.    Lab Data  PSI uses Lighthouse to analyze the given URL, generating a performance score that                           estimates the page's performance on different metrics    How the Performance score is weighted  The Performance score is a weighted average of the metric scores. Naturally, more                           heavily weighted metrics have a bigger effect on your overall Performance score.    Lighthouse v6    Explore scoring with the Lighthouse scoring calculator  https://googlechrome.github.io/lighthouse/scorecalc/          Serial No  Audit  Reference  Weight  1  First Contentful Paint  https://web.dev/fcp/  15%  2  Speed Index  https://web.dev/speed-index/  15%  3  Largest Contentful Paint  https://web.dev/lcp/  25%  4  Time to Interactive  https://web.dev/tti/  15%  5  Total Blocking Time  https://web.dev/tbt/  25%  6  Cumulative Layout Shift  https://web.dev/cls/  5% 
  • 3.