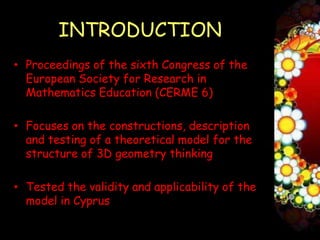
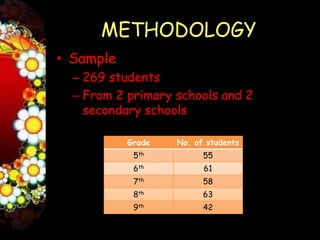
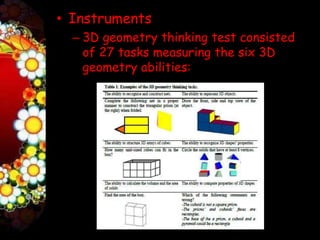
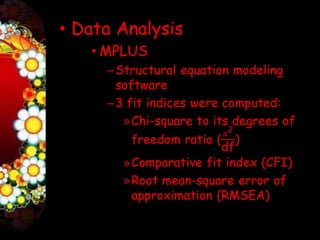
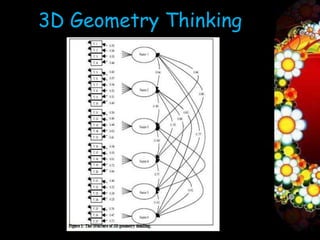
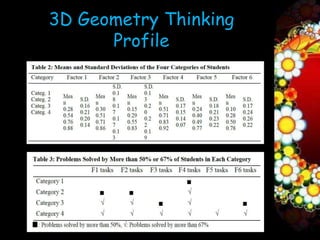
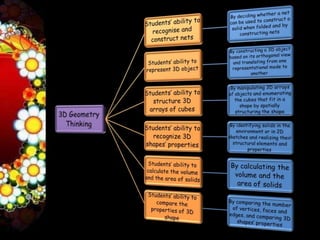
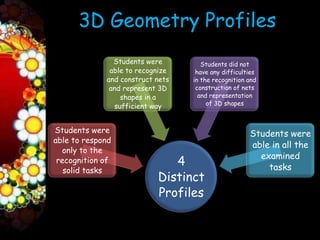
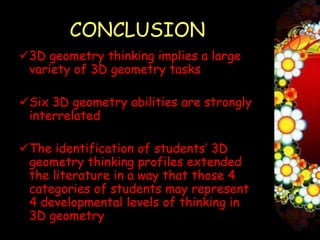
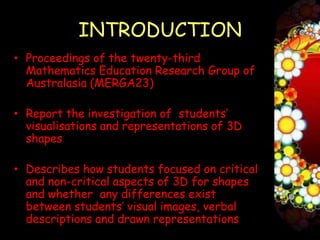
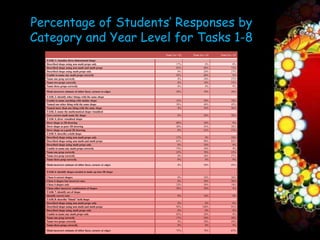
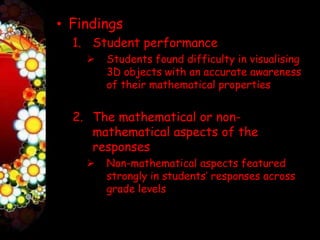
PS 4227
                    C & T: Mathematics III


                 Critical Review


1. Students’ 3D Geometry    2. Students’ Visualisations
     Thinking Profile             of 3D Shapes


                     Presented by:
            08B0510 SUHANA BINTI HAMDAN
“Students’ 3D Geometry
   Thinking Profiles”
INTRODUCTION
• Proceedings of the sixth Congress of the
  European Society for Research in
  Mathematics Education (CERME 6)

• Focuses on the constructions, description
  and testing of a theoretical model for the
  structure of 3D geometry thinking

• Tested the validity and applicability of the
  model in Cyprus
PURPOSE OF THE RESEARCH

1) Examine the structure of 3D
   geometry abilities by validating a
   theoretical model assuming that
   3D geometry thinking consists of
   the 3D geometry abilities

2) Describe students’ 3D geometry
   thinking profiles by tracing a
   developmental trend between
   categories of students
SUMMARY


                 3D Geometry
                   Abilities
 Theoretical
Considerations   3D Geometry
                   Levels of
                   Thinking
3D Geometry Abilities
1. The ability to represent 3D
   objects
2. The ability to recognise and
   construct nets
3. The ability to structure 3D arrays
   of cubes
4. The ability to recognise 3D
   shapes’ properties and compare
   3D shapes
5. Calculate the volume and the area
   of solids
3D Geometry Levels of Thinking

                           Compare solids on a global

              1st level   perception of the shapes of
                           the solids without paying
                            attention to properties


                            Compare solids based on a
                          global perception of the solids
              2nd level   leading to the examination of
                              differences in isolated

Van Hiele’s                  mathematical properties


  Model                            Analyse
                              mathematically
              3rd level       solids and their
                                  elements

                              Anaylse the solids prior to any
                          manipulation and their reasoning based

              4th level   on the mathematical structure of the
                           solids including properties not seen
                          but formally deduced from definitions
                                    or other properties
METHODOLOGY
• Sample
  – 269 students
  – From 2 primary schools and 2
    secondary schools

           Grade   No. of students
            5th          55
            6th          61
            7th          58
            8th          63
            9th          42
• Instruments
  – 3D geometry thinking test consisted
    of 27 tasks measuring the six 3D
    geometry abilities:
RESULTS

• The results are based on:

 1) 3D Geometry Thinking
 2) 3D Geometry Profile
3D Geometry Thinking
      Profile
EVALUATION
• Format of the paper
  – Language
  – Organization of texts


• Findings
  – Structure of 3D geometry thinking
  – Students’ 3D geometry thinking
    profile
3D Geometry Profiles
               Students were         Students did not
              able to recognize    have any difficulties
             and construct nets   in the recognition and
              and represent 3D     construction of nets
                 shapes in a        and representation
               sufficient way          of 3D shapes


Students were                                        Students were
able to respond
                                                     able in all the
  only to the
                                                       examined
 recognition of               4                          tasks
   solid tasks
                           Distinct
                           Profiles
CONCLUSION
3D geometry thinking implies a large
 variety of 3D geometry tasks

Six 3D geometry abilities are strongly
 interrelated

The identification of students’ 3D
 geometry thinking profiles extended
 the literature in a way that those 4
 categories of students may represent
 4 developmental levels of thinking in
 3D geometry
“Students’ Visualisations
     of 3D Shapes”
INTRODUCTION
• Proceedings of the twenty-third
  Mathematics Education Research Group of
  Australasia (MERGA23)1

• Report the investigation of students’
  visualisations and representations of 3D
  shapes

• Describes how students focused on critical
  and non-critical aspects of 3D for shapes
  and whether any differences exist
  between students’ visual images, verbal
  descriptions and drawn representations
AIMS
1. How well do students visualise 3D
   objects?

2. In their visualisations, do students
   focus on critical or non-critical
   aspects of 3D objects? Are these
   aspects mathematical properties?

3. What are the differences, if any,
   between students’ visual images,
   verbal descriptions and drawn
   representations of 3D objects?
SUMMARY
• Research on Students’ visualisation
  abilities

  – Students who differed in spatial
    visualisation skills did not differ in their
    ability to find correct problem
    solutions, but they concluded that an
    emphasis on spatial visualisation skills will
    improve mathematics learning (Fennema &
    Tartre, 1985)

  – While visual imagery did assist many
    students in solving problems, visualisers
    could experience some disadvantages
    (Presmeg, 1986)
– Visual imagery, when properly
  developed, can make a substantial
  contribution at all levels of geometric
  thinking (Battista & Clements, 1991)

– Visual imagery was important in young
  students’ noticing features of shapes
  and in deciding how shapes could be
  used (Owens, 1994)
• Theories on the Development of
  Spatial Concepts

  – One of the most striking things about
    objects in images is how they mimic
    properties of real objects
    (Kosslyn, 1983)
– The ability to draw correct diagrams
  stems from images that students
  possess and often these images do not
  reflect student understandings in terms
  of the properties of a given figure (Pegg
  & Davey, 1989)

– Students with poor visual skills may
  focus on non-mathematical aspects of
  shapes and this may inhibit effective
  learning of geometric ideas (Gray, Pitta,
  and Tall, 1997)
METHODOLOGY
• Sample
  – 30 students
  – From a NSW Department of
    Education and Training school

           Year     No. of students
            1         10 students
            3         9 students
            5         11 students
• Instrument
  – Interviewed based assessment of
    students’ understanding and
    visualisations of 3D shapes included 8
    tasks

    • Adapted from instruments used in prior
      studies by Battista & Clements (1996),
      Shaughnessy (1999) in correspondence

    • The task also reflected sample activities
      from the NSW Mathematics K-6 syllabus
      (NSW Department of Education, 1989)

    • Were administrated on a one-one basis by
      chief investigator
Assessment Tasks
                                Task 1: Visualise a three-dimensional shapes
I want you to think about a cereal box, for example, a cornflakes or rice bubbles box. Tell me all you can
think about this box.
                                       Task 2: Identify similar shapes
Can you think of any other things or shapes in the real world that are the same shape as this cereal box
shape? Why are they the same?
                              Task 3: Name the mathematical shape visualised
Do you know the mathematical name of this cereal box shape?
                                      Task 4: Draw the visualised shape
Can you draw this cereal box shape for me? Can you explain your drawing to me?
                                       Task 5: Describe a (held) shape
I’ve got a real cereal box here. You can pick it up and turn it around if you want to. Now can you describe
the shape of this box to me? (If the description was quite different from the original visualization, the
investigator said, “You said 4 sides before, and how you have told me there are 6 sides. Why did you say
4 sides before? How was the picture in your mind different from the real box?”)
                  Task 6: Identify shapes needed to make up into three-dimensional shape
Here are some cardboard shapes. If you wanted to stick some of these shapes together to make one
cereal box, which shapes would you need? Hand them to me.
                                       Task 7: Identify net of a shape
This is the shape of a cornflakes’ box flattened out. Now if you cut out these shapes (paper with nets A-
E was shown) and folded them up along the dotted lines, which ones could you make into a small cornflakes
box shape?
                                    Task 8: describe a blank (held) shape
Now look at this box (child was shown a muesli bar box which had been folded inside out so that all faces
appear blank to avoid distraction. The student was allowed to handle the box for a few seconds. Then it
was taken from view). Now describe the shape of the box.
– Responses & Solution methods

  • Responses were recorded on an audiotape
    and students’ drawings and explanations
    were retained for later analysis

  • Solutions methods were coded for
    correct, incorrect, or non-response
    before being analysed for key
    mathematical aspects

  • Coding of responses was supervised and
    recoded by an independent coder
RESULTS

• Interview transcript were anaylsed
  and responses classified according
  to:
  1. Student performance
  2. The mathematical or non-
     mathematical aspects of the
     responses
  3. Differences between
     drawn, visualised and verbal
     descriptions
Percentage of Students’ Responses by
Category and Year Level for Tasks 1-8
                                                              Year 1 n = 12   Year 3 n = 11   Year 5 n = 11

  TASK 1: visualize three-dimensional shape
  Described shape using non-math props only                           17%              0%              0%
  Described shape using non-math and math props                       83%             80%             73%
  Described shape using math props only                                0%             20%             27%
  Unable to name any math props correctly                             92%             60%              9%
  Name one prop correctly                                              8%             30%             27%
  Name two props correctly                                             0%             10%             55%
  Name three props correctly                                           0%              0%              9%

  Made incorrect estimate of either faces, corners or edges           50%             70%             36%

  TASK 2: identify other things with the same shape
  Unable to name anything with similar shape                          33%             30%             18%
  Named one other thing with the same shape                           58%             40%             45%
  Named more than one thing with the same shape                        8%             30%             36%
  TASK 3: name the mathematical shape visualised
  Gave correct math name for shape                                     0%             20%             36%
  TASK 4: draw visualised shape
  Drew shape as 3D drawing                                            80%             30%              9%
  Drew shape as poor 3D drawing                                       20%             45%             36%
  Drew shape as a good 3D drawing                                      0%             25%             27%
  TASK 5: describe a held shape
  Described shape using non-math props only                           17%              0%             18%
  Described shape using non-math and math props                       83%             90%             82%
  Described shape using math props only                                0%             10%              0%
  Unable to name any math props correctly                             75%             10%              9%
  Name one prop correctly                                             25%             70%             55%
  Name two prop correctly                                              0%             20%             27%
  Name three prop correctly                                            0%              0%              9%

  Made incorrect estimate of either faces, corners or edges            8%             50%             45%

  TASK 6: identify shapes needed to make up into 3D shape

  Chose 6 correct shapes                                               0%             30%             36%
  Chose 6 shapes but incorrect ones                                    8%             20%             36%
  Chose 4 shapes only                                                 33%             30%             18%
  Chose other incorrect combination of shapes                         58%             20%              9%
  TASK 7: identify net of shape
  Identify correct nets                                                0%             10%              0%
  TASK 8: describe “blank” held shape
  Described shape using non-math props only                            8%              0%              0%
  Described shape using non-math and math props                       92%            100%             91%
  Described shape using math props only                                0%              0%              9%
  Unable to name any math props only                                  83%             30%              9%
  Name one prop correctly                                             17%             50%             36%
  Name two props correctly                                             0%             20%             45%
  Name three props correctly                                           0%              0%              9%

  Made incorrect estimate of either faces, corners or edges           75%             70%             67%
EVALUATION
• Format of the paper

  – Language

  – Data analysis

  – Organizations of texts
• Findings
  1. Student performance
       Students found difficulty in visualising
        3D objects with an accurate awareness
        of their mathematical properties


  2. The mathematical or non-
     mathematical aspects of the
     responses
       Non-mathematical aspects featured
        strongly in students’ responses across
        grade levels
3. Differences between drawn,
   visualised and verbal descriptions
     There are considerable differences
      between students’ abilities on these 3
      aspects
CONCLUSION
 The accuracy of drawing a 3D shape
  which a student has just visualised
  does not necessarily reflect the
  student’s visualisation ability

 The quality of some student’s
  visualisations may improve with grade
  level, but that students may remain
  focused on non-mathematical or non-
  critical aspects of shapes
Critical review ct maths3

Critical review ct maths3

  • 1.
    PS 4227 C & T: Mathematics III Critical Review 1. Students’ 3D Geometry 2. Students’ Visualisations Thinking Profile of 3D Shapes Presented by: 08B0510 SUHANA BINTI HAMDAN
  • 2.
    “Students’ 3D Geometry Thinking Profiles”
  • 3.
    INTRODUCTION • Proceedings ofthe sixth Congress of the European Society for Research in Mathematics Education (CERME 6) • Focuses on the constructions, description and testing of a theoretical model for the structure of 3D geometry thinking • Tested the validity and applicability of the model in Cyprus
  • 4.
    PURPOSE OF THERESEARCH 1) Examine the structure of 3D geometry abilities by validating a theoretical model assuming that 3D geometry thinking consists of the 3D geometry abilities 2) Describe students’ 3D geometry thinking profiles by tracing a developmental trend between categories of students
  • 5.
    SUMMARY 3D Geometry Abilities Theoretical Considerations 3D Geometry Levels of Thinking
  • 6.
    3D Geometry Abilities 1.The ability to represent 3D objects 2. The ability to recognise and construct nets 3. The ability to structure 3D arrays of cubes 4. The ability to recognise 3D shapes’ properties and compare 3D shapes 5. Calculate the volume and the area of solids
  • 7.
    3D Geometry Levelsof Thinking Compare solids on a global 1st level perception of the shapes of the solids without paying attention to properties Compare solids based on a global perception of the solids 2nd level leading to the examination of differences in isolated Van Hiele’s mathematical properties Model Analyse mathematically 3rd level solids and their elements Anaylse the solids prior to any manipulation and their reasoning based 4th level on the mathematical structure of the solids including properties not seen but formally deduced from definitions or other properties
  • 8.
    METHODOLOGY • Sample – 269 students – From 2 primary schools and 2 secondary schools Grade No. of students 5th 55 6th 61 7th 58 8th 63 9th 42
  • 9.
    • Instruments – 3D geometry thinking test consisted of 27 tasks measuring the six 3D geometry abilities:
  • 11.
    RESULTS • The resultsare based on: 1) 3D Geometry Thinking 2) 3D Geometry Profile
  • 12.
  • 13.
  • 14.
    EVALUATION • Format ofthe paper – Language – Organization of texts • Findings – Structure of 3D geometry thinking – Students’ 3D geometry thinking profile
  • 16.
    3D Geometry Profiles Students were Students did not able to recognize have any difficulties and construct nets in the recognition and and represent 3D construction of nets shapes in a and representation sufficient way of 3D shapes Students were Students were able to respond able in all the only to the examined recognition of 4 tasks solid tasks Distinct Profiles
  • 17.
    CONCLUSION 3D geometry thinkingimplies a large variety of 3D geometry tasks Six 3D geometry abilities are strongly interrelated The identification of students’ 3D geometry thinking profiles extended the literature in a way that those 4 categories of students may represent 4 developmental levels of thinking in 3D geometry
  • 18.
  • 19.
    INTRODUCTION • Proceedings ofthe twenty-third Mathematics Education Research Group of Australasia (MERGA23)1 • Report the investigation of students’ visualisations and representations of 3D shapes • Describes how students focused on critical and non-critical aspects of 3D for shapes and whether any differences exist between students’ visual images, verbal descriptions and drawn representations
  • 20.
    AIMS 1. How welldo students visualise 3D objects? 2. In their visualisations, do students focus on critical or non-critical aspects of 3D objects? Are these aspects mathematical properties? 3. What are the differences, if any, between students’ visual images, verbal descriptions and drawn representations of 3D objects?
  • 21.
    SUMMARY • Research onStudents’ visualisation abilities – Students who differed in spatial visualisation skills did not differ in their ability to find correct problem solutions, but they concluded that an emphasis on spatial visualisation skills will improve mathematics learning (Fennema & Tartre, 1985) – While visual imagery did assist many students in solving problems, visualisers could experience some disadvantages (Presmeg, 1986)
  • 22.
    – Visual imagery,when properly developed, can make a substantial contribution at all levels of geometric thinking (Battista & Clements, 1991) – Visual imagery was important in young students’ noticing features of shapes and in deciding how shapes could be used (Owens, 1994)
  • 23.
    • Theories onthe Development of Spatial Concepts – One of the most striking things about objects in images is how they mimic properties of real objects (Kosslyn, 1983)
  • 24.
    – The abilityto draw correct diagrams stems from images that students possess and often these images do not reflect student understandings in terms of the properties of a given figure (Pegg & Davey, 1989) – Students with poor visual skills may focus on non-mathematical aspects of shapes and this may inhibit effective learning of geometric ideas (Gray, Pitta, and Tall, 1997)
  • 25.
    METHODOLOGY • Sample – 30 students – From a NSW Department of Education and Training school Year No. of students 1 10 students 3 9 students 5 11 students
  • 26.
    • Instrument – Interviewed based assessment of students’ understanding and visualisations of 3D shapes included 8 tasks • Adapted from instruments used in prior studies by Battista & Clements (1996), Shaughnessy (1999) in correspondence • The task also reflected sample activities from the NSW Mathematics K-6 syllabus (NSW Department of Education, 1989) • Were administrated on a one-one basis by chief investigator
  • 27.
    Assessment Tasks Task 1: Visualise a three-dimensional shapes I want you to think about a cereal box, for example, a cornflakes or rice bubbles box. Tell me all you can think about this box. Task 2: Identify similar shapes Can you think of any other things or shapes in the real world that are the same shape as this cereal box shape? Why are they the same? Task 3: Name the mathematical shape visualised Do you know the mathematical name of this cereal box shape? Task 4: Draw the visualised shape Can you draw this cereal box shape for me? Can you explain your drawing to me? Task 5: Describe a (held) shape I’ve got a real cereal box here. You can pick it up and turn it around if you want to. Now can you describe the shape of this box to me? (If the description was quite different from the original visualization, the investigator said, “You said 4 sides before, and how you have told me there are 6 sides. Why did you say 4 sides before? How was the picture in your mind different from the real box?”) Task 6: Identify shapes needed to make up into three-dimensional shape Here are some cardboard shapes. If you wanted to stick some of these shapes together to make one cereal box, which shapes would you need? Hand them to me. Task 7: Identify net of a shape This is the shape of a cornflakes’ box flattened out. Now if you cut out these shapes (paper with nets A- E was shown) and folded them up along the dotted lines, which ones could you make into a small cornflakes box shape? Task 8: describe a blank (held) shape Now look at this box (child was shown a muesli bar box which had been folded inside out so that all faces appear blank to avoid distraction. The student was allowed to handle the box for a few seconds. Then it was taken from view). Now describe the shape of the box.
  • 28.
    – Responses &Solution methods • Responses were recorded on an audiotape and students’ drawings and explanations were retained for later analysis • Solutions methods were coded for correct, incorrect, or non-response before being analysed for key mathematical aspects • Coding of responses was supervised and recoded by an independent coder
  • 29.
    RESULTS • Interview transcriptwere anaylsed and responses classified according to: 1. Student performance 2. The mathematical or non- mathematical aspects of the responses 3. Differences between drawn, visualised and verbal descriptions
  • 30.
    Percentage of Students’Responses by Category and Year Level for Tasks 1-8 Year 1 n = 12 Year 3 n = 11 Year 5 n = 11 TASK 1: visualize three-dimensional shape Described shape using non-math props only 17% 0% 0% Described shape using non-math and math props 83% 80% 73% Described shape using math props only 0% 20% 27% Unable to name any math props correctly 92% 60% 9% Name one prop correctly 8% 30% 27% Name two props correctly 0% 10% 55% Name three props correctly 0% 0% 9% Made incorrect estimate of either faces, corners or edges 50% 70% 36% TASK 2: identify other things with the same shape Unable to name anything with similar shape 33% 30% 18% Named one other thing with the same shape 58% 40% 45% Named more than one thing with the same shape 8% 30% 36% TASK 3: name the mathematical shape visualised Gave correct math name for shape 0% 20% 36% TASK 4: draw visualised shape Drew shape as 3D drawing 80% 30% 9% Drew shape as poor 3D drawing 20% 45% 36% Drew shape as a good 3D drawing 0% 25% 27% TASK 5: describe a held shape Described shape using non-math props only 17% 0% 18% Described shape using non-math and math props 83% 90% 82% Described shape using math props only 0% 10% 0% Unable to name any math props correctly 75% 10% 9% Name one prop correctly 25% 70% 55% Name two prop correctly 0% 20% 27% Name three prop correctly 0% 0% 9% Made incorrect estimate of either faces, corners or edges 8% 50% 45% TASK 6: identify shapes needed to make up into 3D shape Chose 6 correct shapes 0% 30% 36% Chose 6 shapes but incorrect ones 8% 20% 36% Chose 4 shapes only 33% 30% 18% Chose other incorrect combination of shapes 58% 20% 9% TASK 7: identify net of shape Identify correct nets 0% 10% 0% TASK 8: describe “blank” held shape Described shape using non-math props only 8% 0% 0% Described shape using non-math and math props 92% 100% 91% Described shape using math props only 0% 0% 9% Unable to name any math props only 83% 30% 9% Name one prop correctly 17% 50% 36% Name two props correctly 0% 20% 45% Name three props correctly 0% 0% 9% Made incorrect estimate of either faces, corners or edges 75% 70% 67%
  • 31.
    EVALUATION • Format ofthe paper – Language – Data analysis – Organizations of texts
  • 32.
    • Findings 1. Student performance  Students found difficulty in visualising 3D objects with an accurate awareness of their mathematical properties 2. The mathematical or non- mathematical aspects of the responses  Non-mathematical aspects featured strongly in students’ responses across grade levels
  • 33.
    3. Differences betweendrawn, visualised and verbal descriptions  There are considerable differences between students’ abilities on these 3 aspects
  • 34.
    CONCLUSION  The accuracyof drawing a 3D shape which a student has just visualised does not necessarily reflect the student’s visualisation ability  The quality of some student’s visualisations may improve with grade level, but that students may remain focused on non-mathematical or non- critical aspects of shapes

Editor's Notes