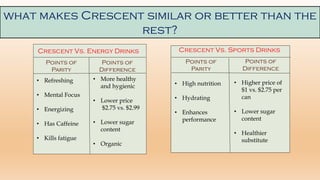
CRESCENT
PURE
Positioning a special drink
A
Harvard Business School
Case Study
Company Analysis
• Peter Hooper founded Crescent in 2008
• Product was an all natural beverage infused with
organic juices, herbal stimulants and electrolytes
• A refreshing and energizing drink having the same
energy effect as a cup of coffee yet having lesser than
70% of the sugar content in an average energy or
sports drink
• Sold for $3.75 for an 8 oz. can and 1000 cases per
month
• High demand among both men and women.
• Sold out before inventory could be replenished even
when retailers hiked prices by 25%
• Portland Drake
Beverages(PDB) was a
manufacturer of organic juices
and sparkling water
• Revenues hit $120.5 million in
2012
• Acquired Crescent in 2013 for
expanding into the functional
beverage sector
• Planned to launch the product
nation-wide in 2015
• Reduced its price to $2.75 to
reflect the company’s pricing
strategy
Production capacity constraints
prevented PDB from the full scale
launching of the drink in 2015
PDB planned a soft launch of the
drink in 2014 in only three states
before all the other major companies
came out with their products in 2015
A proper positioning strategy had to
be decided for maximizing the
revenues of the product
Michael Booth, CEO of PDB, gave
this task to Sarah Ryan, VP –
Marketing
So who are
the players
involved?
Michael Booth,
CEO of PDB
Sarah Ryan, VP
of Marketing,
PDB
Matt Levor,
Director of Market
Research, PDB
Peter Hooper,
Founder of
Crescent Pure
Three Market Positioning Options
are available
OPTION 1:
ENERGY DRINK
ENERGY DRINKS MARKET
Characteristics
• This market had grown by 40%.
• Estimated to be $8.5 billion in 2013 to a projected $13.5 billion in
2018
• Largest group consists of males aged 18 and 34 with parents of
children also more likely to consume energy drinks
• Main competitors are Fright, Razor, Torque and Stellar
OPPORTUNITTES
Sales of energy drinks with lower levels of caffeine and pure ingredients
were rising due to consumer demand for healthier food and beverage
choices
THREATS
• News stories were highlighting the alleged health risks of the drink
• High market share, about 85%, by the top players
• Only 32% of consumers over 18 had drank an energy drink in the last 6
months
• 11% of whom had decreased consumption due to health and concerns
OPTION 2:
Sports drinks
SPORTS DRINKS MARKET
Characteristics
• This market had increased only 9% between 2007 and 2012
• In 2012, it reached $6.3 billion and was expected to grow to $9.58 billion
by 2017
• Half of men and about a third of women drank sports drinks
• Appealed to younger consumers
• Main competitors were Gleam and Drip
OPPORTUNITTES
• New diet and low sugar sports drinks were the growth areas
• Diet and low-sugar sports beverages had grown by 33% taking market
share from traditional sports drinks
• The market size for these drinks was expected to increase from $1.4
billion in 2012 to $2.97 billion in 2017
Threats
Concern regarding rising childhood obesity rates resulted in government-
mandated guidelines to remove high-calorie sugar drinks like sports
drinks from school vending machines
Perceptual map of energy and sports
drinks with respect to nutrition vs.
taste
Perceptual map of energy
drinks and sports drinks
with respect to hydration
vs. energy
And Finally
option 3:
Organic
Drinks
ORGANIC DRINKS MARKET
CHARACTERISTICS
• Comprises health conscious consumers who consistently purchase
organic and all-natural products
• Consumers avoided traditional energy and sports drinks because of
their ingredients
• Commands a premium pricing(on average 25%) over conventional
beverages
OPPORTUNITIES
• Growing market
• Targets a wider consumer base
• Consumers who consume organic drinks focus on quality and are not
deterred by the premium price and hence bigger profit margin
THREATS
• A $750,000 ad budget may not be sufficient to target a wide range of
consumers
• More distributors and retailers would have to be evaluated which will
be difficult because of the limited time constraint
CRESCENT VS THE REST
what makes Crescent similar or better than the
rest?
Crescent Vs. Energy Drinks Crescent Vs. Sports Drinks
Points of
Parity
Points of
Difference
• Refreshing
• Mental Focus
• Energizing
• Has Caffeine
• Kills fatigue
• More healthy
and hygienic
• Lower price
$2.75 vs. $2.99
• Lower sugar
content
• Organic
Points of
Parity
Points of
Difference
• High nutrition
• Hydrating
• Enhances
performance
• Higher price of
$1 vs. $2.75 per
can
• Lower sugar
content
• Healthier
substitute
Will
CRESCENT
REACH THE
CREST?
Here’s why it will beat the
rest
• Contains almost 70% less sugar than every other
sports and energy drink in the market
• Contains 80mg of caffeine for a 8 oz. can which
provides the energy effect equivalent to a cup of
coffee
• Refreshing taste, hydrating effect and above all
certified organic which will draw health conscious
consumers as well
• For $2.75 per can it is a one-of-a-kind drink which
combines all the effects of an energy drink, a
sports drink and an organic drink without
jeopardizing the quality
FEEDBACK
received
What do the Retailers
say about Crescent?
• Their inventory of Crescent depleted quickly
• Despite increasing the price by 25% in some of the stores,
the stock still sold out before the inventory was
replenished
• Most popular among consumers aged 18 to 30
• A higher percentage of women purchased Crescent than
they expected
• Younger men purchased six or more cans at a time
Most
importantly
what do these
people say?
• Crescent’s taste appealed to most
consumers and there were no
unfavorable reactions.
• Only 25% of the surveyed people
remained concerned about the energy
content.
• Customers of every age and
demographic profile appreciated the
healthy ingredients and the good taste.
• Most people were happily surprised to
know the lesser price of the product
which they had hoped to be greater
than the quoted $2.75.
Some Demographics
0%
10%
20%
30%
40%
50%
60%
Energy Drinks Sports Drinks Crescent
Age Ranges of Crescent
Consumers
18-24 25-34 35-44 45-54 55+
Gender
Male Female
Annual Income
of Crescent
consumers:
$42500
College Degree
Holders: 62%
SARAH’S RECOMMENDATION
Crescent Pure should be positioned as an Organic Energy Drink because:
• Consumers viewed “Energy” as the most describing character.
• At $2.75 for an 8 oz. can, it is cheaper than all other energy drinks while at
the same time has the same energy effect coupled with an extremely low
sugar content which will appeal to the consumer base of both the markets.
• Also because of this pricing, it cannot be labelled as a sports drink because
all other drinks are priced at $1-$2 for 12 oz. and 24 oz. cans
• Both the energy drinks and organic drinks market are growing at a fast
rate and PDB could capitalize at this junction if they enter the market early
and with a bang.
• The certified organic label will be able to draw in consumers who are
health conscious as well as those who are looking to energize and refresh
themselves as it will be a healthy alternative to high-calorie, sugary energy
drinks.
• At $2.75 it is a fair price for an organic drink which also promises quality
• As an organic energy drink which is healthier and comparatively cheaper,
it will draw interest from consumers of every age group and demographic
profile.
Profit Margin of every level in the supply
chain
Selling Price Variable Price Gross Margin
Manufacturer $1.24 $1.02 18%
Distributor $1.65 $1.24 25%
Retailer $2.75 $1.65 40%
BREAK EVEN ANALYSIS
• Advertising Budget
• Cans per case
• Cases sold per month
• Cases sold annually
• Wholesale price per can
• Variable Cost per can
• Variable Cost per case
• Manufacturer’s wholesale price to distributor per case
• Manufacturer’s margin per case
• Manufacturer’s margin per case monthly
• Manufacturer’s margin per case annually
$750,000
24
12000
144000
$1.24
$1.02
$24.48
$29.76
$5.28
$63360
$760320
Net Profit $10320
Break Even Number of cases 142046
BREAKEVEN REACHED!!!
DISCLAIMER
This project was created by Sourav Sen, St. Xavier’s College, Kolkata during a
Marketing Internship under Prof. Sameer Mathur of IIM Lucknow
P.S. – All images have been taken from Google and shutterstock.com

Crescent Pure Case Study

  • 1.
    CRESCENT PURE Positioning a specialdrink A Harvard Business School Case Study
  • 2.
    Company Analysis • PeterHooper founded Crescent in 2008 • Product was an all natural beverage infused with organic juices, herbal stimulants and electrolytes • A refreshing and energizing drink having the same energy effect as a cup of coffee yet having lesser than 70% of the sugar content in an average energy or sports drink • Sold for $3.75 for an 8 oz. can and 1000 cases per month • High demand among both men and women. • Sold out before inventory could be replenished even when retailers hiked prices by 25%
  • 3.
    • Portland Drake Beverages(PDB)was a manufacturer of organic juices and sparkling water • Revenues hit $120.5 million in 2012 • Acquired Crescent in 2013 for expanding into the functional beverage sector • Planned to launch the product nation-wide in 2015 • Reduced its price to $2.75 to reflect the company’s pricing strategy
  • 5.
    Production capacity constraints preventedPDB from the full scale launching of the drink in 2015 PDB planned a soft launch of the drink in 2014 in only three states before all the other major companies came out with their products in 2015 A proper positioning strategy had to be decided for maximizing the revenues of the product Michael Booth, CEO of PDB, gave this task to Sarah Ryan, VP – Marketing
  • 6.
    So who are theplayers involved?
  • 7.
    Michael Booth, CEO ofPDB Sarah Ryan, VP of Marketing, PDB Matt Levor, Director of Market Research, PDB Peter Hooper, Founder of Crescent Pure
  • 9.
    Three Market PositioningOptions are available
  • 10.
  • 11.
    ENERGY DRINKS MARKET Characteristics •This market had grown by 40%. • Estimated to be $8.5 billion in 2013 to a projected $13.5 billion in 2018 • Largest group consists of males aged 18 and 34 with parents of children also more likely to consume energy drinks • Main competitors are Fright, Razor, Torque and Stellar OPPORTUNITTES Sales of energy drinks with lower levels of caffeine and pure ingredients were rising due to consumer demand for healthier food and beverage choices THREATS • News stories were highlighting the alleged health risks of the drink • High market share, about 85%, by the top players • Only 32% of consumers over 18 had drank an energy drink in the last 6 months • 11% of whom had decreased consumption due to health and concerns
  • 12.
  • 13.
    SPORTS DRINKS MARKET Characteristics •This market had increased only 9% between 2007 and 2012 • In 2012, it reached $6.3 billion and was expected to grow to $9.58 billion by 2017 • Half of men and about a third of women drank sports drinks • Appealed to younger consumers • Main competitors were Gleam and Drip OPPORTUNITTES • New diet and low sugar sports drinks were the growth areas • Diet and low-sugar sports beverages had grown by 33% taking market share from traditional sports drinks • The market size for these drinks was expected to increase from $1.4 billion in 2012 to $2.97 billion in 2017 Threats Concern regarding rising childhood obesity rates resulted in government- mandated guidelines to remove high-calorie sugar drinks like sports drinks from school vending machines
  • 14.
    Perceptual map ofenergy and sports drinks with respect to nutrition vs. taste
  • 15.
    Perceptual map ofenergy drinks and sports drinks with respect to hydration vs. energy
  • 16.
  • 17.
    ORGANIC DRINKS MARKET CHARACTERISTICS •Comprises health conscious consumers who consistently purchase organic and all-natural products • Consumers avoided traditional energy and sports drinks because of their ingredients • Commands a premium pricing(on average 25%) over conventional beverages OPPORTUNITIES • Growing market • Targets a wider consumer base • Consumers who consume organic drinks focus on quality and are not deterred by the premium price and hence bigger profit margin THREATS • A $750,000 ad budget may not be sufficient to target a wide range of consumers • More distributors and retailers would have to be evaluated which will be difficult because of the limited time constraint
  • 18.
  • 19.
    what makes Crescentsimilar or better than the rest? Crescent Vs. Energy Drinks Crescent Vs. Sports Drinks Points of Parity Points of Difference • Refreshing • Mental Focus • Energizing • Has Caffeine • Kills fatigue • More healthy and hygienic • Lower price $2.75 vs. $2.99 • Lower sugar content • Organic Points of Parity Points of Difference • High nutrition • Hydrating • Enhances performance • Higher price of $1 vs. $2.75 per can • Lower sugar content • Healthier substitute
  • 20.
  • 21.
    Here’s why itwill beat the rest • Contains almost 70% less sugar than every other sports and energy drink in the market • Contains 80mg of caffeine for a 8 oz. can which provides the energy effect equivalent to a cup of coffee • Refreshing taste, hydrating effect and above all certified organic which will draw health conscious consumers as well • For $2.75 per can it is a one-of-a-kind drink which combines all the effects of an energy drink, a sports drink and an organic drink without jeopardizing the quality
  • 22.
  • 23.
    What do theRetailers say about Crescent? • Their inventory of Crescent depleted quickly • Despite increasing the price by 25% in some of the stores, the stock still sold out before the inventory was replenished • Most popular among consumers aged 18 to 30 • A higher percentage of women purchased Crescent than they expected • Younger men purchased six or more cans at a time
  • 24.
    Most importantly what do these peoplesay? • Crescent’s taste appealed to most consumers and there were no unfavorable reactions. • Only 25% of the surveyed people remained concerned about the energy content. • Customers of every age and demographic profile appreciated the healthy ingredients and the good taste. • Most people were happily surprised to know the lesser price of the product which they had hoped to be greater than the quoted $2.75.
  • 25.
    Some Demographics 0% 10% 20% 30% 40% 50% 60% Energy DrinksSports Drinks Crescent Age Ranges of Crescent Consumers 18-24 25-34 35-44 45-54 55+ Gender Male Female Annual Income of Crescent consumers: $42500 College Degree Holders: 62%
  • 26.
    SARAH’S RECOMMENDATION Crescent Pureshould be positioned as an Organic Energy Drink because: • Consumers viewed “Energy” as the most describing character. • At $2.75 for an 8 oz. can, it is cheaper than all other energy drinks while at the same time has the same energy effect coupled with an extremely low sugar content which will appeal to the consumer base of both the markets. • Also because of this pricing, it cannot be labelled as a sports drink because all other drinks are priced at $1-$2 for 12 oz. and 24 oz. cans • Both the energy drinks and organic drinks market are growing at a fast rate and PDB could capitalize at this junction if they enter the market early and with a bang. • The certified organic label will be able to draw in consumers who are health conscious as well as those who are looking to energize and refresh themselves as it will be a healthy alternative to high-calorie, sugary energy drinks. • At $2.75 it is a fair price for an organic drink which also promises quality • As an organic energy drink which is healthier and comparatively cheaper, it will draw interest from consumers of every age group and demographic profile.
  • 27.
    Profit Margin ofevery level in the supply chain Selling Price Variable Price Gross Margin Manufacturer $1.24 $1.02 18% Distributor $1.65 $1.24 25% Retailer $2.75 $1.65 40%
  • 28.
    BREAK EVEN ANALYSIS •Advertising Budget • Cans per case • Cases sold per month • Cases sold annually • Wholesale price per can • Variable Cost per can • Variable Cost per case • Manufacturer’s wholesale price to distributor per case • Manufacturer’s margin per case • Manufacturer’s margin per case monthly • Manufacturer’s margin per case annually $750,000 24 12000 144000 $1.24 $1.02 $24.48 $29.76 $5.28 $63360 $760320 Net Profit $10320 Break Even Number of cases 142046 BREAKEVEN REACHED!!!
  • 29.
    DISCLAIMER This project wascreated by Sourav Sen, St. Xavier’s College, Kolkata during a Marketing Internship under Prof. Sameer Mathur of IIM Lucknow P.S. – All images have been taken from Google and shutterstock.com