Download to read offline


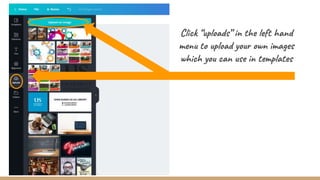

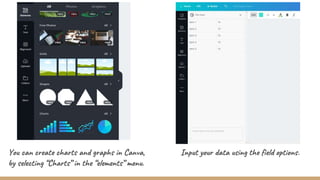


This document provides instructions for creating infographics using Canva. Canva allows you to choose from hundreds of free templates or use your own images and customize elements like fonts, colors, layout and more. The instructions explain how to sign up for an account, select a template, edit elements, add your own images, include charts and graphs, and save your work. Canva offers many options for creating beautiful, customized infographics.