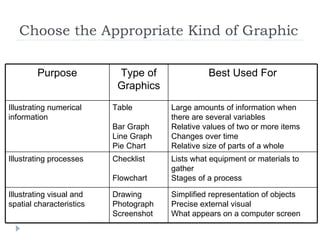
SlideShare a Scribd company logo
Creating Graphics ,[object Object]
Graphics Should Serve a Purpose
Choose the Appropriate Kind of Graphic Purpose Type of Graphics Best Used For Illustrating numerical information Table Bar Graph Line Graph Pie Chart Large amounts of information when there are several variables Relative values of two or more items Changes over time Relative size of parts of a whole Illustrating processes Checklist Flowchart Lists what equipment or materials to gather Stages of a process Illustrating visual and spatial characteristics Drawing Photograph Screenshot Simplified representation of objects Precise external visual What appears on a computer screen
Make Graphics and Text Work Together ,[object Object],Children ages six to 11 were more than two and a half times as likely to be overweight in 2003-2004 as they were in 1976-1980 (19 percent versus 7 percent, respectively). During the same period, the percentage of adolescents ages 12 to 19 who were overweight tripled from 5 percent in 1976-1980 to 17 percent in 2003-2004. (See Figure 1.)
 
Clearly Label Your Graphics
 
Use Graphics to Show Action

More Related Content

What's hot

Uses of maps and illustrations in newspaper
Uses of maps and illustrations in newspaperUses of maps and illustrations in newspaper
Uses of maps and illustrations in newspaper
Roshan Mastana
 
Graphic aids 5 graphs A lecture By Allah Dad Khan VP The University Of Agric...
Graphic aids 5 graphs A lecture  By Allah Dad Khan VP The University Of Agric...Graphic aids 5 graphs A lecture  By Allah Dad Khan VP The University Of Agric...
Graphic aids 5 graphs A lecture By Allah Dad Khan VP The University Of Agric...
Mr.Allah Dad Khan
 
A Tour through the Data Vizualization Zoo - Communications of the ACM
A Tour through the Data Vizualization Zoo - Communications of the ACMA Tour through the Data Vizualization Zoo - Communications of the ACM
A Tour through the Data Vizualization Zoo - Communications of the ACM
Reynolds Center for Business Journalism
 
An Introduction to Watson Analytics
An Introduction to Watson AnalyticsAn Introduction to Watson Analytics
An Introduction to Watson Analytics
Paul Schumann
 
Figures design
Figures designFigures design
Figures design
Eric Z.
 
Qualitative Analysis of urbanization using Open datasets
 Qualitative Analysis of urbanization using Open datasets Qualitative Analysis of urbanization using Open datasets
Qualitative Analysis of urbanization using Open datasets
AJAY KUMAR
 
Aug 27th
Aug 27thAug 27th
Aug 27th
cirilah
 
Biotech day 4
Biotech   day 4Biotech   day 4
Biotech day 4
jmori
 
2.6b scatter plots and lines of best fit
2.6b scatter plots and lines of best fit2.6b scatter plots and lines of best fit
2.6b scatter plots and lines of best fit
hartcher
 
Data Visualization by David Kretch
Data Visualization by David KretchData Visualization by David Kretch
Data Visualization by David Kretch
Summit Consulting, LLC
 
Ia ventures framing_talk_oct2010
Ia ventures framing_talk_oct2010Ia ventures framing_talk_oct2010
Ia ventures framing_talk_oct2010
Michael Driscoll
 
GREY SYSTEM THEORY with example | Data mining
GREY SYSTEM THEORY with example  | Data miningGREY SYSTEM THEORY with example  | Data mining
GREY SYSTEM THEORY with example | Data mining
nomanbarki
 
100% training accuracy without overfitting
100% training accuracy without overfitting100% training accuracy without overfitting
100% training accuracy without overfitting
LibgirlTeam
 
Optimizing the Visual Presentation of Your Data
Optimizing the Visual Presentation of Your DataOptimizing the Visual Presentation of Your Data
Optimizing the Visual Presentation of Your Data
Mary Beth Hasselquist, MD
 
Chapter 1, Lesson 6
Chapter 1, Lesson 6Chapter 1, Lesson 6
Chapter 1, Lesson 6
Pine Crest School
 
Application of Geographical concepts and Spatial Technology to the “Internet ...
Application of Geographical concepts and Spatial Technology to the “Internet ...Application of Geographical concepts and Spatial Technology to the “Internet ...
Application of Geographical concepts and Spatial Technology to the “Internet ...
AkashBorse2
 
Biotech day 3a
Biotech   day 3aBiotech   day 3a
Biotech day 3a
jmori
 
Biotech Day 4
Biotech   Day 4Biotech   Day 4
Biotech Day 4
jmori
 
Biotech day 3
Biotech   day 3Biotech   day 3
Biotech day 3
jmori
 
Team 1: Easy-to-Use Satellite Images Discovery in a Map Viewer
Team 1: Easy-to-Use Satellite Images Discovery in a Map Viewer Team 1: Easy-to-Use Satellite Images Discovery in a Map Viewer
Team 1: Easy-to-Use Satellite Images Discovery in a Map Viewer
plan4all
 

What's hot (20)

Uses of maps and illustrations in newspaper
Uses of maps and illustrations in newspaperUses of maps and illustrations in newspaper
Uses of maps and illustrations in newspaper
 
Graphic aids 5 graphs A lecture By Allah Dad Khan VP The University Of Agric...
Graphic aids 5 graphs A lecture  By Allah Dad Khan VP The University Of Agric...Graphic aids 5 graphs A lecture  By Allah Dad Khan VP The University Of Agric...
Graphic aids 5 graphs A lecture By Allah Dad Khan VP The University Of Agric...
 
A Tour through the Data Vizualization Zoo - Communications of the ACM
A Tour through the Data Vizualization Zoo - Communications of the ACMA Tour through the Data Vizualization Zoo - Communications of the ACM
A Tour through the Data Vizualization Zoo - Communications of the ACM
 
An Introduction to Watson Analytics
An Introduction to Watson AnalyticsAn Introduction to Watson Analytics
An Introduction to Watson Analytics
 
Figures design
Figures designFigures design
Figures design
 
Qualitative Analysis of urbanization using Open datasets
 Qualitative Analysis of urbanization using Open datasets Qualitative Analysis of urbanization using Open datasets
Qualitative Analysis of urbanization using Open datasets
 
Aug 27th
Aug 27thAug 27th
Aug 27th
 
Biotech day 4
Biotech   day 4Biotech   day 4
Biotech day 4
 
2.6b scatter plots and lines of best fit
2.6b scatter plots and lines of best fit2.6b scatter plots and lines of best fit
2.6b scatter plots and lines of best fit
 
Data Visualization by David Kretch
Data Visualization by David KretchData Visualization by David Kretch
Data Visualization by David Kretch
 
Ia ventures framing_talk_oct2010
Ia ventures framing_talk_oct2010Ia ventures framing_talk_oct2010
Ia ventures framing_talk_oct2010
 
GREY SYSTEM THEORY with example | Data mining
GREY SYSTEM THEORY with example  | Data miningGREY SYSTEM THEORY with example  | Data mining
GREY SYSTEM THEORY with example | Data mining
 
100% training accuracy without overfitting
100% training accuracy without overfitting100% training accuracy without overfitting
100% training accuracy without overfitting
 
Optimizing the Visual Presentation of Your Data
Optimizing the Visual Presentation of Your DataOptimizing the Visual Presentation of Your Data
Optimizing the Visual Presentation of Your Data
 
Chapter 1, Lesson 6
Chapter 1, Lesson 6Chapter 1, Lesson 6
Chapter 1, Lesson 6
 
Application of Geographical concepts and Spatial Technology to the “Internet ...
Application of Geographical concepts and Spatial Technology to the “Internet ...Application of Geographical concepts and Spatial Technology to the “Internet ...
Application of Geographical concepts and Spatial Technology to the “Internet ...
 
Biotech day 3a
Biotech   day 3aBiotech   day 3a
Biotech day 3a
 
Biotech Day 4
Biotech   Day 4Biotech   Day 4
Biotech Day 4
 
Biotech day 3
Biotech   day 3Biotech   day 3
Biotech day 3
 
Team 1: Easy-to-Use Satellite Images Discovery in a Map Viewer
Team 1: Easy-to-Use Satellite Images Discovery in a Map Viewer Team 1: Easy-to-Use Satellite Images Discovery in a Map Viewer
Team 1: Easy-to-Use Satellite Images Discovery in a Map Viewer
 

Similar to Creating Graphics

Communicating quantitative information (pecha kucha)
Communicating quantitative information (pecha kucha)Communicating quantitative information (pecha kucha)
Communicating quantitative information (pecha kucha)
tsteks
 
MELJUN CORTES research seminar_1_presentation_techniques
MELJUN CORTES research seminar_1_presentation_techniquesMELJUN CORTES research seminar_1_presentation_techniques
MELJUN CORTES research seminar_1_presentation_techniques
MELJUN CORTES
 
Descriptive statistics
Descriptive statisticsDescriptive statistics
Descriptive statistics
Sr Edith Bogue
 
Visual Aids.pptx
Visual Aids.pptxVisual Aids.pptx
Visual Aids.pptx
VinothKumarasamy2
 
Statistics
StatisticsStatistics
Statistics
diereck
 
Types of graphs and charts and their uses with examples and pics
Types of graphs and charts and their uses  with examples and picsTypes of graphs and charts and their uses  with examples and pics
Types of graphs and charts and their uses with examples and pics
Makati Science High School
 
Analysing charts and graphics
Analysing charts and graphicsAnalysing charts and graphics
Analysing charts and graphics
Škola Futura
 
How to visualize web analytics data and choose a graph?
How to visualize web analytics data and choose a graph?How to visualize web analytics data and choose a graph?
How to visualize web analytics data and choose a graph?
Janvi Arora
 

Similar to Creating Graphics (8)

Communicating quantitative information (pecha kucha)
Communicating quantitative information (pecha kucha)Communicating quantitative information (pecha kucha)
Communicating quantitative information (pecha kucha)
 
MELJUN CORTES research seminar_1_presentation_techniques
MELJUN CORTES research seminar_1_presentation_techniquesMELJUN CORTES research seminar_1_presentation_techniques
MELJUN CORTES research seminar_1_presentation_techniques
 
Descriptive statistics
Descriptive statisticsDescriptive statistics
Descriptive statistics
 
Visual Aids.pptx
Visual Aids.pptxVisual Aids.pptx
Visual Aids.pptx
 
Statistics
StatisticsStatistics
Statistics
 
Types of graphs and charts and their uses with examples and pics
Types of graphs and charts and their uses  with examples and picsTypes of graphs and charts and their uses  with examples and pics
Types of graphs and charts and their uses with examples and pics
 
Analysing charts and graphics
Analysing charts and graphicsAnalysing charts and graphics
Analysing charts and graphics
 
How to visualize web analytics data and choose a graph?
How to visualize web analytics data and choose a graph?How to visualize web analytics data and choose a graph?
How to visualize web analytics data and choose a graph?
 

Recently uploaded

Digital Marketing with a Focus on Sustainability
Digital Marketing with a Focus on SustainabilityDigital Marketing with a Focus on Sustainability
Digital Marketing with a Focus on Sustainability
sssourabhsharma
 
Innovative Uses of Revit in Urban Planning and Design
Innovative Uses of Revit in Urban Planning and DesignInnovative Uses of Revit in Urban Planning and Design
Innovative Uses of Revit in Urban Planning and Design
Chandresh Chudasama
 
Profiles of Iconic Fashion Personalities.pdf
Profiles of Iconic Fashion Personalities.pdfProfiles of Iconic Fashion Personalities.pdf
Profiles of Iconic Fashion Personalities.pdf
TTop Threads
 
Call8328958814 satta matka Kalyan result satta guessing
Call8328958814 satta matka Kalyan result satta guessingCall8328958814 satta matka Kalyan result satta guessing
Call8328958814 satta matka Kalyan result satta guessing
➑➌➋➑➒➎➑➑➊➍
 
Income Tax exemption for Start up : Section 80 IAC
Income Tax  exemption for Start up : Section 80 IACIncome Tax  exemption for Start up : Section 80 IAC
Income Tax exemption for Start up : Section 80 IAC
CA Dr. Prithvi Ranjan Parhi
 
Presentation by Herman Kienhuis (Curiosity VC) on Investing in AI for ABS Alu...
Presentation by Herman Kienhuis (Curiosity VC) on Investing in AI for ABS Alu...Presentation by Herman Kienhuis (Curiosity VC) on Investing in AI for ABS Alu...
Presentation by Herman Kienhuis (Curiosity VC) on Investing in AI for ABS Alu...
Herman Kienhuis
 
Sustainable Logistics for Cost Reduction_ IPLTech Electric's Eco-Friendly Tra...
Sustainable Logistics for Cost Reduction_ IPLTech Electric's Eco-Friendly Tra...Sustainable Logistics for Cost Reduction_ IPLTech Electric's Eco-Friendly Tra...
Sustainable Logistics for Cost Reduction_ IPLTech Electric's Eco-Friendly Tra...
IPLTech Electric
 
Best Forex Brokers Comparison in INDIA 2024
Best Forex Brokers Comparison in INDIA 2024Best Forex Brokers Comparison in INDIA 2024
Best Forex Brokers Comparison in INDIA 2024
Top Forex Brokers Review
 
GKohler - Retail Scavenger Hunt Presentation
GKohler - Retail Scavenger Hunt PresentationGKohler - Retail Scavenger Hunt Presentation
GKohler - Retail Scavenger Hunt Presentation
GraceKohler1
 
Ellen Burstyn: From Detroit Dreamer to Hollywood Legend | CIO Women Magazine
Ellen Burstyn: From Detroit Dreamer to Hollywood Legend | CIO Women MagazineEllen Burstyn: From Detroit Dreamer to Hollywood Legend | CIO Women Magazine
Ellen Burstyn: From Detroit Dreamer to Hollywood Legend | CIO Women Magazine
CIOWomenMagazine
 
Brian Fitzsimmons on the Business Strategy and Content Flywheel of Barstool S...
Brian Fitzsimmons on the Business Strategy and Content Flywheel of Barstool S...Brian Fitzsimmons on the Business Strategy and Content Flywheel of Barstool S...
Brian Fitzsimmons on the Business Strategy and Content Flywheel of Barstool S...
Neil Horowitz
 
Innovation Management Frameworks: Your Guide to Creativity & Innovation
Innovation Management Frameworks: Your Guide to Creativity & InnovationInnovation Management Frameworks: Your Guide to Creativity & Innovation
Innovation Management Frameworks: Your Guide to Creativity & Innovation
Operational Excellence Consulting
 
2022 Vintage Roman Numerals Men Rings
2022 Vintage Roman  Numerals  Men  Rings2022 Vintage Roman  Numerals  Men  Rings
2022 Vintage Roman Numerals Men Rings
aragme
 
Pitch Deck Teardown: Kinnect's $250k Angel deck
Pitch Deck Teardown: Kinnect's $250k Angel deckPitch Deck Teardown: Kinnect's $250k Angel deck
Pitch Deck Teardown: Kinnect's $250k Angel deck
HajeJanKamps
 
Business storytelling: key ingredients to a story
Business storytelling: key ingredients to a storyBusiness storytelling: key ingredients to a story
Business storytelling: key ingredients to a story
Alexandra Fulford
 
DearbornMusic-KatherineJasperFullSailUni
DearbornMusic-KatherineJasperFullSailUniDearbornMusic-KatherineJasperFullSailUni
DearbornMusic-KatherineJasperFullSailUni
katiejasper96
 
Anny Serafina Love - Letter of Recommendation by Kellen Harkins, MS.
Anny Serafina Love - Letter of Recommendation by Kellen Harkins, MS.Anny Serafina Love - Letter of Recommendation by Kellen Harkins, MS.
Anny Serafina Love - Letter of Recommendation by Kellen Harkins, MS.
AnnySerafinaLove
 
Dpboss Matka Guessing Satta Matta Matka Kalyan panel Chart Indian Matka Dpbos...
Dpboss Matka Guessing Satta Matta Matka Kalyan panel Chart Indian Matka Dpbos...Dpboss Matka Guessing Satta Matta Matka Kalyan panel Chart Indian Matka Dpbos...
Dpboss Matka Guessing Satta Matta Matka Kalyan panel Chart Indian Matka Dpbos...
➒➌➎➏➑➐➋➑➐➐Dpboss Matka Guessing Satta Matka Kalyan Chart Indian Matka
 
Part 2 Deep Dive: Navigating the 2024 Slowdown
Part 2 Deep Dive: Navigating the 2024 SlowdownPart 2 Deep Dive: Navigating the 2024 Slowdown
Part 2 Deep Dive: Navigating the 2024 Slowdown
jeffkluth1
 
The Genesis of BriansClub.cm Famous Dark WEb Platform
The Genesis of BriansClub.cm Famous Dark WEb PlatformThe Genesis of BriansClub.cm Famous Dark WEb Platform
The Genesis of BriansClub.cm Famous Dark WEb Platform
SabaaSudozai
 

Recently uploaded (20)

Digital Marketing with a Focus on Sustainability
Digital Marketing with a Focus on SustainabilityDigital Marketing with a Focus on Sustainability
Digital Marketing with a Focus on Sustainability
 
Innovative Uses of Revit in Urban Planning and Design
Innovative Uses of Revit in Urban Planning and DesignInnovative Uses of Revit in Urban Planning and Design
Innovative Uses of Revit in Urban Planning and Design
 
Profiles of Iconic Fashion Personalities.pdf
Profiles of Iconic Fashion Personalities.pdfProfiles of Iconic Fashion Personalities.pdf
Profiles of Iconic Fashion Personalities.pdf
 
Call8328958814 satta matka Kalyan result satta guessing
Call8328958814 satta matka Kalyan result satta guessingCall8328958814 satta matka Kalyan result satta guessing
Call8328958814 satta matka Kalyan result satta guessing
 
Income Tax exemption for Start up : Section 80 IAC
Income Tax  exemption for Start up : Section 80 IACIncome Tax  exemption for Start up : Section 80 IAC
Income Tax exemption for Start up : Section 80 IAC
 
Presentation by Herman Kienhuis (Curiosity VC) on Investing in AI for ABS Alu...
Presentation by Herman Kienhuis (Curiosity VC) on Investing in AI for ABS Alu...Presentation by Herman Kienhuis (Curiosity VC) on Investing in AI for ABS Alu...
Presentation by Herman Kienhuis (Curiosity VC) on Investing in AI for ABS Alu...
 
Sustainable Logistics for Cost Reduction_ IPLTech Electric's Eco-Friendly Tra...
Sustainable Logistics for Cost Reduction_ IPLTech Electric's Eco-Friendly Tra...Sustainable Logistics for Cost Reduction_ IPLTech Electric's Eco-Friendly Tra...
Sustainable Logistics for Cost Reduction_ IPLTech Electric's Eco-Friendly Tra...
 
Best Forex Brokers Comparison in INDIA 2024
Best Forex Brokers Comparison in INDIA 2024Best Forex Brokers Comparison in INDIA 2024
Best Forex Brokers Comparison in INDIA 2024
 
GKohler - Retail Scavenger Hunt Presentation
GKohler - Retail Scavenger Hunt PresentationGKohler - Retail Scavenger Hunt Presentation
GKohler - Retail Scavenger Hunt Presentation
 
Ellen Burstyn: From Detroit Dreamer to Hollywood Legend | CIO Women Magazine
Ellen Burstyn: From Detroit Dreamer to Hollywood Legend | CIO Women MagazineEllen Burstyn: From Detroit Dreamer to Hollywood Legend | CIO Women Magazine
Ellen Burstyn: From Detroit Dreamer to Hollywood Legend | CIO Women Magazine
 
Brian Fitzsimmons on the Business Strategy and Content Flywheel of Barstool S...
Brian Fitzsimmons on the Business Strategy and Content Flywheel of Barstool S...Brian Fitzsimmons on the Business Strategy and Content Flywheel of Barstool S...
Brian Fitzsimmons on the Business Strategy and Content Flywheel of Barstool S...
 
Innovation Management Frameworks: Your Guide to Creativity & Innovation
Innovation Management Frameworks: Your Guide to Creativity & InnovationInnovation Management Frameworks: Your Guide to Creativity & Innovation
Innovation Management Frameworks: Your Guide to Creativity & Innovation
 
2022 Vintage Roman Numerals Men Rings
2022 Vintage Roman  Numerals  Men  Rings2022 Vintage Roman  Numerals  Men  Rings
2022 Vintage Roman Numerals Men Rings
 
Pitch Deck Teardown: Kinnect's $250k Angel deck
Pitch Deck Teardown: Kinnect's $250k Angel deckPitch Deck Teardown: Kinnect's $250k Angel deck
Pitch Deck Teardown: Kinnect's $250k Angel deck
 
Business storytelling: key ingredients to a story
Business storytelling: key ingredients to a storyBusiness storytelling: key ingredients to a story
Business storytelling: key ingredients to a story
 
DearbornMusic-KatherineJasperFullSailUni
DearbornMusic-KatherineJasperFullSailUniDearbornMusic-KatherineJasperFullSailUni
DearbornMusic-KatherineJasperFullSailUni
 
Anny Serafina Love - Letter of Recommendation by Kellen Harkins, MS.
Anny Serafina Love - Letter of Recommendation by Kellen Harkins, MS.Anny Serafina Love - Letter of Recommendation by Kellen Harkins, MS.
Anny Serafina Love - Letter of Recommendation by Kellen Harkins, MS.
 
Dpboss Matka Guessing Satta Matta Matka Kalyan panel Chart Indian Matka Dpbos...
Dpboss Matka Guessing Satta Matta Matka Kalyan panel Chart Indian Matka Dpbos...Dpboss Matka Guessing Satta Matta Matka Kalyan panel Chart Indian Matka Dpbos...
Dpboss Matka Guessing Satta Matta Matka Kalyan panel Chart Indian Matka Dpbos...
 
Part 2 Deep Dive: Navigating the 2024 Slowdown
Part 2 Deep Dive: Navigating the 2024 SlowdownPart 2 Deep Dive: Navigating the 2024 Slowdown
Part 2 Deep Dive: Navigating the 2024 Slowdown
 
The Genesis of BriansClub.cm Famous Dark WEb Platform
The Genesis of BriansClub.cm Famous Dark WEb PlatformThe Genesis of BriansClub.cm Famous Dark WEb Platform
The Genesis of BriansClub.cm Famous Dark WEb Platform
 

Creating Graphics

  • 1.
  • 3. Choose the Appropriate Kind of Graphic Purpose Type of Graphics Best Used For Illustrating numerical information Table Bar Graph Line Graph Pie Chart Large amounts of information when there are several variables Relative values of two or more items Changes over time Relative size of parts of a whole Illustrating processes Checklist Flowchart Lists what equipment or materials to gather Stages of a process Illustrating visual and spatial characteristics Drawing Photograph Screenshot Simplified representation of objects Precise external visual What appears on a computer screen
  • 4.
  • 5.  
  • 7.  
  • 8. Use Graphics to Show Action