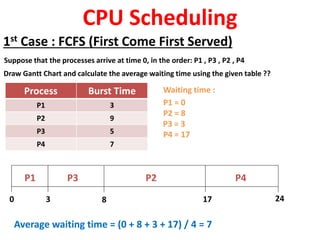
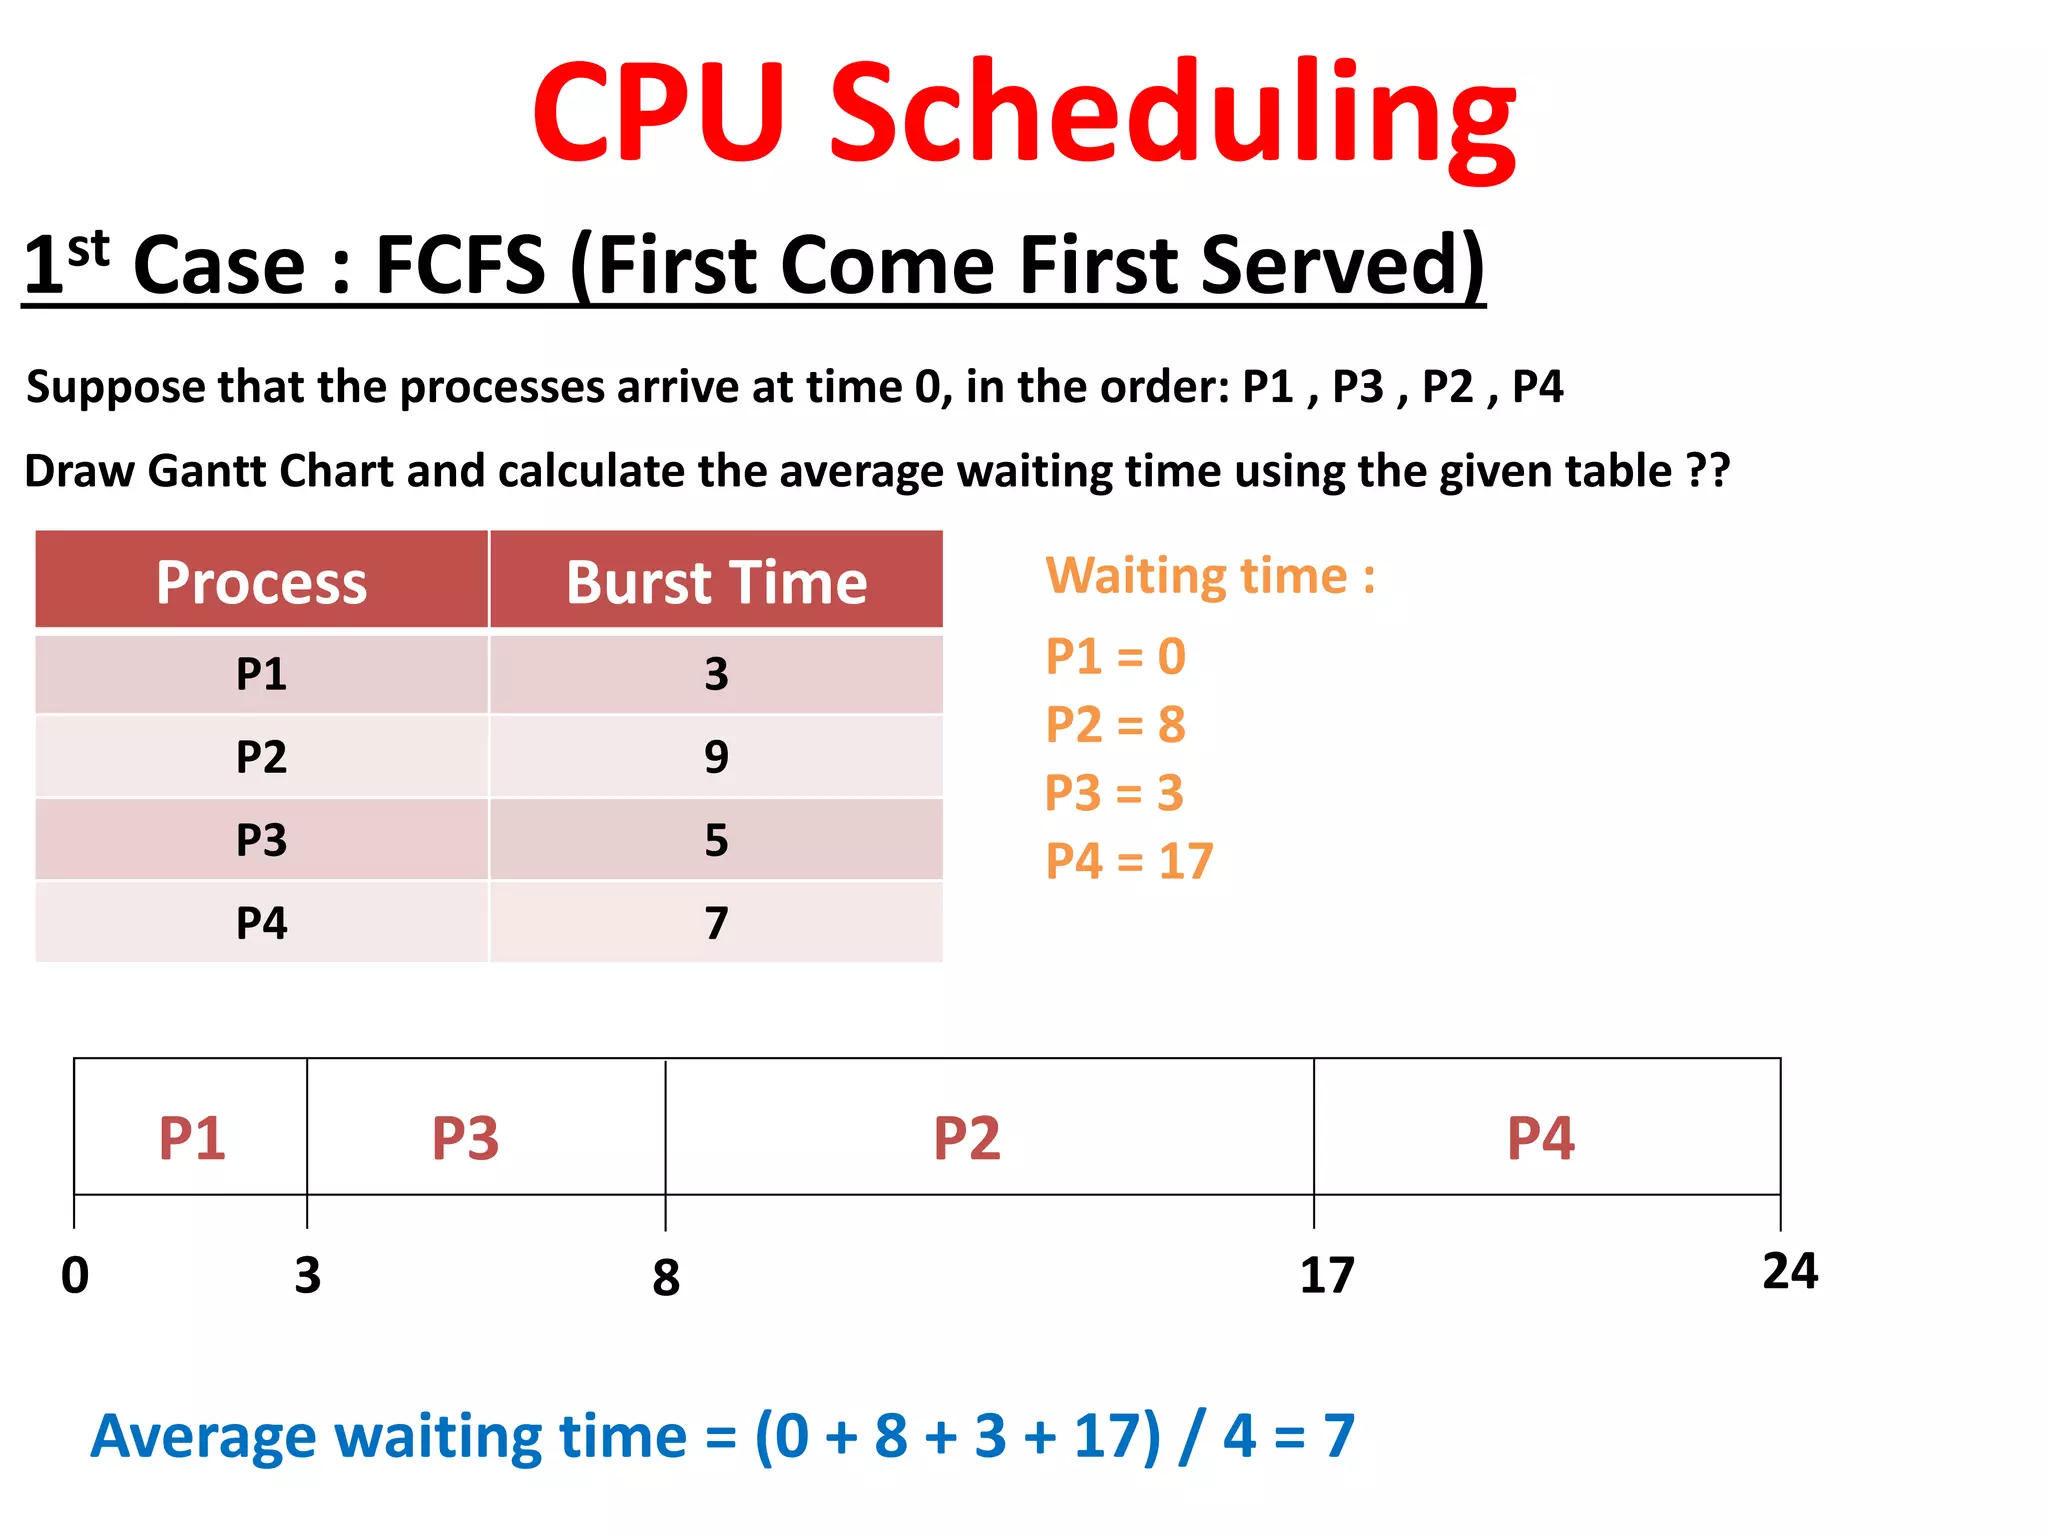
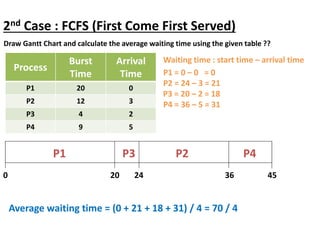
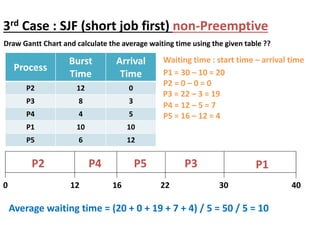
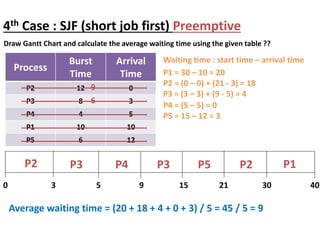
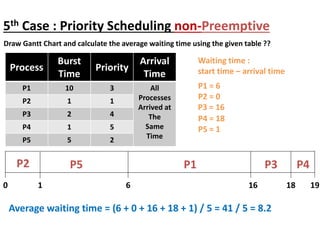
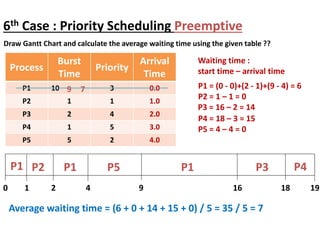
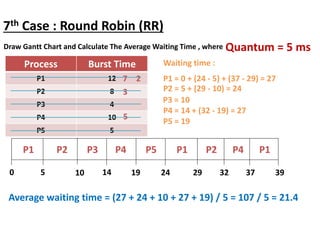
1st Case : FCFS (First Come First Served)
CPU Scheduling
Process Burst Time
P1 3
P2 9
P3 5
P4 7
Draw Gantt Chart and calculate the average waiting time using the given table ??
Suppose that the processes arrive at time 0, in the order: P1 , P3 , P2 , P4
P1 P3 P2 P4
0 3 8 17 24
Waiting time :
P1 = 0
P2 = 8
P3 = 3
P4 = 17
Average waiting time = (0 + 8 + 3 + 17) / 4 = 7
2nd Case : FCFS (First Come First Served)
Process
Burst
Time
Arrival
Time
P1 20 0
P2 12 3
P3 4 2
P4 9 5
Draw Gantt Chart and calculate the average waiting time using the given table ??
0
Waiting time : start time – arrival time
P1 = 0 – 0 = 0
P2 = 24 – 3 = 21
P3 = 20 – 2 = 18
P4 = 36 – 5 = 31
20 24
P1 P3 P2 P4
36 45
Average waiting time = (0 + 21 + 18 + 31) / 4 = 70 / 4
3rd Case : SJF (short job first) non-Preemptive
Process
Burst
Time
Arrival
Time
P2 12 0
P3 8 3
P4 4 5
P1 10 10
P5 6 12
Draw Gantt Chart and calculate the average waiting time using the given table ??
0
Waiting time : start time – arrival time
P1 = 30 – 10 = 20
P2 = 0 – 0 = 0
P3 = 22 – 3 = 19
P4 = 12 – 5 = 7
12 16
P2 P4 P5 P3
22 40
Average waiting time = (20 + 0 + 19 + 7 + 4) / 5 = 50 / 5 = 10
P1
30
P5 = 16 – 12 = 4
4th Case : SJF (short job first) Preemptive
Process
Burst
Time
Arrival
Time
P2 12 0
P3 8 3
P4 4 5
P1 10 10
P5 6 12
Draw Gantt Chart and calculate the average waiting time using the given table ??
0
Waiting time : start time – arrival time
P1 = 30 – 10 = 20
P2 = (0 – 0) + (21 - 3) = 18
P3 = (3 – 3) + (9 - 5) = 4
P4 = (5 – 5) = 0
3 5
P2
9 21
Average waiting time = (20 + 18 + 4 + 0 + 3) / 5 = 45 / 5 = 9
15
P5 = 15 – 12 = 3
30 40
P3 P4 P3 P5 P2 P1
9
6
5th Case : Priority Scheduling non-Preemptive
Process
Burst
Time
Priority
Arrival
Time
P1 10 3 All
Processes
Arrived at
The
Same
Time
P2 1 1
P3 2 4
P4 1 5
P5 5 2
Draw Gantt Chart and calculate the average waiting time using the given table ??
0
Waiting time :
start time – arrival time
P1 = 6
P2 = 0
P3 = 16
P4 = 18
1 6
P2
16
Average waiting time = (6 + 0 + 16 + 18 + 1) / 5 = 41 / 5 = 8.2
18
P5 = 1
19
P5 P1 P3 P4
6th Case : Priority Scheduling Preemptive
Process
Burst
Time
Priority
Arrival
Time
P1 10 3 0.0
P2 1 1 1.0
P3 2 4 2.0
P4 1 5 3.0
P5 5 2 4.0
Draw Gantt Chart and calculate the average waiting time using the given table ??
Waiting time :
start time – arrival time
P1 = (0 - 0)+(2 - 1)+(9 - 4) = 6
P2 = 1 – 1 = 0
P3 = 16 – 2 = 14
P4 = 18 – 3 = 15
Average waiting time = (6 + 0 + 14 + 15 + 0) / 5 = 35 / 5 = 7
P5 = 4 – 4 = 0
0 1 2
P1
4 16
9 18 19
P2 P1 P5 P1 P3 P4
9 7
7th Case : Round Robin (RR)
Process Burst Time
P1 12
P2 8
P3 4
P4 10
P5 5
Draw Gantt Chart and Calculate The Average Waiting Time , where
P1 P2 P5 P4
0 5 10 14 19
Waiting time :
P1 = 0 + (24 - 5) + (37 - 29) = 27
P2 = 5 + (29 - 10) = 24
P3 = 10
P4 = 14 + (32 - 19) = 27
Average waiting time = (27 + 24 + 10 + 27 + 19) / 5 = 107 / 5 = 21.4
P3 P4 P1 P2 P1
24 29 32 37 39
7 2
3
5
Quantum = 5 ms
P5 = 19
Thank You For Watching
Good Luck
(
. .

Cpu Scheduling.pptx

  • 1.
    1st Case :FCFS (First Come First Served) CPU Scheduling Process Burst Time P1 3 P2 9 P3 5 P4 7 Draw Gantt Chart and calculate the average waiting time using the given table ?? Suppose that the processes arrive at time 0, in the order: P1 , P3 , P2 , P4 P1 P3 P2 P4 0 3 8 17 24 Waiting time : P1 = 0 P2 = 8 P3 = 3 P4 = 17 Average waiting time = (0 + 8 + 3 + 17) / 4 = 7
  • 2.
    2nd Case :FCFS (First Come First Served) Process Burst Time Arrival Time P1 20 0 P2 12 3 P3 4 2 P4 9 5 Draw Gantt Chart and calculate the average waiting time using the given table ?? 0 Waiting time : start time – arrival time P1 = 0 – 0 = 0 P2 = 24 – 3 = 21 P3 = 20 – 2 = 18 P4 = 36 – 5 = 31 20 24 P1 P3 P2 P4 36 45 Average waiting time = (0 + 21 + 18 + 31) / 4 = 70 / 4
  • 3.
    3rd Case :SJF (short job first) non-Preemptive Process Burst Time Arrival Time P2 12 0 P3 8 3 P4 4 5 P1 10 10 P5 6 12 Draw Gantt Chart and calculate the average waiting time using the given table ?? 0 Waiting time : start time – arrival time P1 = 30 – 10 = 20 P2 = 0 – 0 = 0 P3 = 22 – 3 = 19 P4 = 12 – 5 = 7 12 16 P2 P4 P5 P3 22 40 Average waiting time = (20 + 0 + 19 + 7 + 4) / 5 = 50 / 5 = 10 P1 30 P5 = 16 – 12 = 4
  • 4.
    4th Case :SJF (short job first) Preemptive Process Burst Time Arrival Time P2 12 0 P3 8 3 P4 4 5 P1 10 10 P5 6 12 Draw Gantt Chart and calculate the average waiting time using the given table ?? 0 Waiting time : start time – arrival time P1 = 30 – 10 = 20 P2 = (0 – 0) + (21 - 3) = 18 P3 = (3 – 3) + (9 - 5) = 4 P4 = (5 – 5) = 0 3 5 P2 9 21 Average waiting time = (20 + 18 + 4 + 0 + 3) / 5 = 45 / 5 = 9 15 P5 = 15 – 12 = 3 30 40 P3 P4 P3 P5 P2 P1 9 6
  • 5.
    5th Case :Priority Scheduling non-Preemptive Process Burst Time Priority Arrival Time P1 10 3 All Processes Arrived at The Same Time P2 1 1 P3 2 4 P4 1 5 P5 5 2 Draw Gantt Chart and calculate the average waiting time using the given table ?? 0 Waiting time : start time – arrival time P1 = 6 P2 = 0 P3 = 16 P4 = 18 1 6 P2 16 Average waiting time = (6 + 0 + 16 + 18 + 1) / 5 = 41 / 5 = 8.2 18 P5 = 1 19 P5 P1 P3 P4
  • 6.
    6th Case :Priority Scheduling Preemptive Process Burst Time Priority Arrival Time P1 10 3 0.0 P2 1 1 1.0 P3 2 4 2.0 P4 1 5 3.0 P5 5 2 4.0 Draw Gantt Chart and calculate the average waiting time using the given table ?? Waiting time : start time – arrival time P1 = (0 - 0)+(2 - 1)+(9 - 4) = 6 P2 = 1 – 1 = 0 P3 = 16 – 2 = 14 P4 = 18 – 3 = 15 Average waiting time = (6 + 0 + 14 + 15 + 0) / 5 = 35 / 5 = 7 P5 = 4 – 4 = 0 0 1 2 P1 4 16 9 18 19 P2 P1 P5 P1 P3 P4 9 7
  • 7.
    7th Case :Round Robin (RR) Process Burst Time P1 12 P2 8 P3 4 P4 10 P5 5 Draw Gantt Chart and Calculate The Average Waiting Time , where P1 P2 P5 P4 0 5 10 14 19 Waiting time : P1 = 0 + (24 - 5) + (37 - 29) = 27 P2 = 5 + (29 - 10) = 24 P3 = 10 P4 = 14 + (32 - 19) = 27 Average waiting time = (27 + 24 + 10 + 27 + 19) / 5 = 107 / 5 = 21.4 P3 P4 P1 P2 P1 24 29 32 37 39 7 2 3 5 Quantum = 5 ms P5 = 19
  • 8.
    Thank You ForWatching Good Luck ( . .