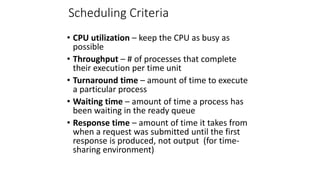
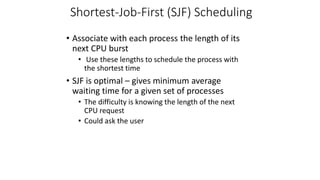
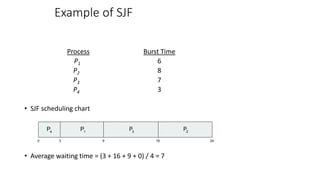
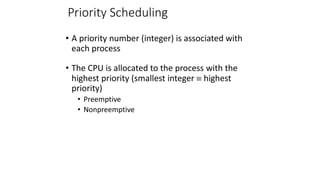
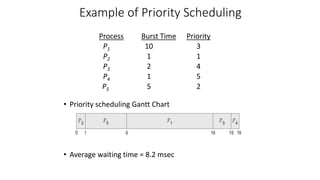
Silberschatz, Galvin and Gagne ©2013
Operating System Concepts – 9th Edition
CPU Scheduling
CPU Scheduling
• Basic Concepts
• Scheduling Criteria
• Scheduling Algorithms
Objectives
• To describe various CPU-scheduling algorithms
• To discuss evaluation criteria for selecting a
CPU-scheduling algorithm for a particular
system
• To examine the scheduling algorithms of
several operating systems
Scheduling Criteria
• CPU utilization – keep the CPU as busy as
possible
• Throughput – # of processes that complete
their execution per time unit
• Turnaround time – amount of time to execute
a particular process
• Waiting time – amount of time a process has
been waiting in the ready queue
• Response time – amount of time it takes from
when a request was submitted until the first
response is produced, not output (for time-
sharing environment)
First- Come, First-Served (FCFS) Scheduling
Process Burst Time
P1 24
P2 3
P3 3
• Suppose that the processes arrive in the order: P1 , P2 , P3
The Gantt Chart for the schedule is:
• Waiting time for P1 = 0; P2 = 24; P3 = 27
• Average waiting time: (0 + 24 + 27)/3 = 17
P P P
1 2 3
0 24 30
27
Shortest-Job-First (SJF) Scheduling
• Associate with each process the length of its
next CPU burst
• Use these lengths to schedule the process with
the shortest time
• SJF is optimal – gives minimum average
waiting time for a given set of processes
• The difficulty is knowing the length of the next
CPU request
• Could ask the user
Example of SJF
ProcessArrival Time Burst Time
P1 0.0 6
P2 2.0 8
P3 4.0 7
P4 5.0 3
• SJF scheduling chart
• Average waiting time = (3 + 16 + 9 + 0) / 4 = 7
P3
0 3 24
P4
P1
16
9
P2
Priority Scheduling
• A priority number (integer) is associated with
each process
• The CPU is allocated to the process with the
highest priority (smallest integer  highest
priority)
• Preemptive
• Nonpreemptive
Example of Priority Scheduling
ProcessAarri Burst TimeT Priority
P1 10 3
P2 1 1
P3 2 4
P4 1 5
P5 5 2
• Priority scheduling Gantt Chart
• Average waiting time = 8.2 msec

CPU Scheduling Lecture 5 - 6.pptx

  • 1.
    Silberschatz, Galvin andGagne ©2013 Operating System Concepts – 9th Edition CPU Scheduling
  • 2.
    CPU Scheduling • BasicConcepts • Scheduling Criteria • Scheduling Algorithms
  • 3.
    Objectives • To describevarious CPU-scheduling algorithms • To discuss evaluation criteria for selecting a CPU-scheduling algorithm for a particular system • To examine the scheduling algorithms of several operating systems
  • 4.
    Scheduling Criteria • CPUutilization – keep the CPU as busy as possible • Throughput – # of processes that complete their execution per time unit • Turnaround time – amount of time to execute a particular process • Waiting time – amount of time a process has been waiting in the ready queue • Response time – amount of time it takes from when a request was submitted until the first response is produced, not output (for time- sharing environment)
  • 5.
    First- Come, First-Served(FCFS) Scheduling Process Burst Time P1 24 P2 3 P3 3 • Suppose that the processes arrive in the order: P1 , P2 , P3 The Gantt Chart for the schedule is: • Waiting time for P1 = 0; P2 = 24; P3 = 27 • Average waiting time: (0 + 24 + 27)/3 = 17 P P P 1 2 3 0 24 30 27
  • 6.
    Shortest-Job-First (SJF) Scheduling •Associate with each process the length of its next CPU burst • Use these lengths to schedule the process with the shortest time • SJF is optimal – gives minimum average waiting time for a given set of processes • The difficulty is knowing the length of the next CPU request • Could ask the user
  • 7.
    Example of SJF ProcessArrivalTime Burst Time P1 0.0 6 P2 2.0 8 P3 4.0 7 P4 5.0 3 • SJF scheduling chart • Average waiting time = (3 + 16 + 9 + 0) / 4 = 7 P3 0 3 24 P4 P1 16 9 P2
  • 8.
    Priority Scheduling • Apriority number (integer) is associated with each process • The CPU is allocated to the process with the highest priority (smallest integer  highest priority) • Preemptive • Nonpreemptive
  • 9.
    Example of PriorityScheduling ProcessAarri Burst TimeT Priority P1 10 3 P2 1 1 P3 2 4 P4 1 5 P5 5 2 • Priority scheduling Gantt Chart • Average waiting time = 8.2 msec