SlideShare a Scribd company logo
1 of 3
Mekdella Woreda Chimit Masonry Dam of 06 kebele financial
feasibility and Viability Analysis
Prepared by: Gashaw Abebe-M&E Specialist at Mekdella PSNP-PWs
Mekdella Woreda
May 2016
Chimit Masonry Dam financial feasibility and Viability Analysis
Ever since 2011/12, in Mekdella Woreda Agriculture Development Office, under the support of PSNP capital budget
various types of modern river diversion had been built which create enabling environment for smallholder farmers to
improve agricultural products and productivities through commercial crop intervention in addition to stabilizing local
markets.
Profitability of irrigation schemes built before 2012/13 is earlier known since they are constructed rooted in none-
intermittent local rivers; assessing financially viable, technically implementable and socially acceptable broadly emerging
masonry dams before years of effort has been worthless (money, material, labor and time) is deemed important. To
materialize it, therefore, a result of the study conducted on Chimit Masonry Dam built in 2015 in 06 kebele is explained
bellow.
Capital outlay from PSNP budget 1,019,703 Ethiopian Birr (ETB) had been utilized to construct the dam which can irrigate
48 ha of farm land to benefit 189 household heads. In this year,the dam is limited to cultivate onion, fenugreek, lentil,
potato, etc only on 11 ha of farm land caused by el-nino crises resulted in reduction of volume of water.
Taking the labor for farming practices as an implicit cost, in the first production year of 2015/16, as an operating cost,
205,306 ETB had been utilized to purchase selected seeds,fertilizer, pest and insecticide. This cost will significantly
increase each year adding maintenance cost of the dam after two or three years.
Cash inflow has shown a little decline in the first production year related to insufficient water reservation of the dam due to
the prevailed drought. However,if the dam lasts long holding substantial amount of water in the upcoming years: more
coverage of farm land will be irrigated; many farmers will get experience to participate; farmers will prefer to be engaged
on producing high value crops and selling price will be improved and thus leading to surplus production.
Based on this fact,keeping sustainable productivity of the dam, accounting profit-cost benefit analysis of Chimit Masonry
Dam for the first five years is described here below using Payback Period, Net Present Value (NPV) and Internal Rate of
Return (IRR). Note that all unites of money in this study is Ethiopian Birr (ETB)
Activities Initial cost(0 Year) Year 1 Year 2 Year 3 Year 4 Year 5 T/Sum
A) TotalCash outflow 1,019,703 205,306 250,410 302,920 375,169 450,960 2,604,468
B) Totalcash inflow 0 940,670 1,450,179 1,965,600 2,580,911 3,124,890 10,062,250
Net cash inflow(A-B) -1,019,703 735,364 1,199,769 1,662,680 2,205,742 2,673,930 7,457,782
NPV @ 12% -1,019,703 656,606.52 956,455.85 1,183,495.62 1,401,749 1,517,187.9 5,715,494.9
1. Payback Period
Payback period uses to know how long it will take to earn back the money we invest on the project. Since the return from
the project is expected to vary from year to year, we simply add up the expected returns for each succeeding year, until we
arrive at the total cost of the project. In our case,the project would be completely paid for about 13 months in to the second
year.
Payback period =
π‘π‘Žπ‘ β„Ž π‘œπ‘’π‘‘π‘“π‘™π‘œπ‘€
π‘Žπ‘›π‘›π‘’π‘Žπ‘™ π‘π‘Žπ‘ β„Ž π‘–π‘›π‘“π‘™π‘œπ‘€
+ =
π‘’π‘›π‘π‘Žπ‘–π‘‘ π‘π‘Žπ‘ β„Ž π‘œπ‘’π‘‘ π‘“π‘™π‘œπ‘€ 𝑑𝑒𝑑𝑒𝑐𝑑𝑒𝑑 π‘“π‘Ÿπ‘œπ‘š π‘ π‘’π‘π‘œπ‘›π‘‘ π‘¦π‘’π‘Žπ‘Ÿ π‘Ÿπ‘’π‘£π‘’π‘›π‘’π‘’
π‘ π‘’π‘π‘œπ‘›π‘‘ π‘¦π‘’π‘Žπ‘Ÿ π‘π‘Žπ‘ β„Ž π‘œπ‘’π‘‘π‘“π‘™π‘œπ‘€
1+
79,033
1,450,179
= 1.0545 years (Therefore,the dam will take 385 days = 1 year & 20 days to earn back the money).
Using the payback period, we can only know the period it takes to recoup the original investment. However,it completely
ignores the time value of money and the total project return.
We therefore,use the Net Present Value (NPV) and Internal Rate of Return to solve this problem. These project evaluation
methods allow us to consider time value of money.
2. Net present value (NPV)
Basically, it allows us to know the present value in β€œto day’s birr” of the future net cash flow of a project. Then we can
compare that amount with the amount of money needed to implement the project. If NPV is positive the project is
acceptable to be implemented, if it is negative it could be rejected. Zero value projects are determined by the investor either
to succeed or stop.
Using this approach and the table illustrated above, NPV is calculated as follows:
Net present value (NPV) = PVB – PVC
Where,PVB = present value of benefit
PVC = present value of cost
𝑁𝑃𝑉 = βˆ‘
𝐡𝑑
(1+π‘Ÿ)
𝑛
𝑖=0 βˆ’ βˆ‘
𝐢𝑑
(1+π‘Ÿ)
𝑛
𝑖=0
Where,B = Benefits; C = Costs; r = discount rate; t = time period;
n = number of time periods
NPV equals the summation from t = 0 (the initial start-up of the program) to t =n (the final year of the program) of
[(Bt –Ct) / (1 + r) t].
𝑁𝑃𝑉 = βˆ‘
𝐡𝑑
(1+π‘Ÿ)
𝑛
𝑖=0 βˆ’ βˆ‘
𝐢𝑑
(1+π‘Ÿ)
𝑛
𝑖=0
NPV @ 12% = 5,715,494.9 -1,019,703 = 4,695,791.87
The project is financially viable since NPV is positive.
3. Internal Rate ofReturn(IRR)
Essentially, IRR allows us to find the interest rate that is equivalent to the birr returns we expect from our project or the birr
return should be higher than we have discounted the project. Once we know the rate, we can compare it to the rates we
could earn by investing our money in our intended project or other investments.
If IRR is less than the prevailing discount rate,the project will definitely be worthless. Therefore,it is to be acceptable,a
project must be expected to earn an IRR that is as a minimum severalpercentages higher than the cost of investment, to
implement the project for its risk, time and the trouble associated with it. IRR has the following method of calculation.
IRR = βˆ‘
𝐡𝑑
(1+π‘Ÿ)
𝑛
𝑖=0 βˆ’ βˆ‘
𝐢𝑑
(1+π‘Ÿ)
𝑛
𝑖=0 =0
Using rules of linear algebra, IRR can be computed as;
8,477,485
(1+𝐼𝑅𝑅)
= 1,019,703
1,019,703(1+IRR) = 8,477,485
IRR=
8,477,485
1,019,703
-1= 7.3136805520823 IRR =731%
Since by severalpercentages IRR is greater r (731% >12%) , this project is certainly acceptable to be implemented.
In both methods, the project (Chimit Masonry Dam) is financially viable, technically implementable and socially
acceptable.
The following chart displays incremental change of net cash inflow and NPV each year.
-1,500,000
-1,000,000
-500,000
0
500,000
1,000,000
1,500,000
2,000,000
2,500,000
3,000,000
Intial Year Year 1 Year 2 Year 3 Year 4 Year 5
Net cash inflow -1,019,703 735,364 1,199,769 1,662,680 2,205,742 2,673,930
NPV @12% -1,019,703 656,606.52 956,455.85 1,183,495.62 1,401,749 1,517,187.90
-1,019,703
735,364
1,199,769
1,662,680
2,205,742
2,673,930
-1,019,703
656,606.52 956,455.85 1,183,495.62
1,401,749
1,517,187.90
Mekdella Woreda Chimit Masonry Dam, diagramatic
illustration of cost benefit analysis from 2015-2020
Net
cash
inflow
NPV @12%

More Related Content

What's hot

Payback period by harikrishnanan
Payback period by harikrishnananPayback period by harikrishnanan
Payback period by harikrishnananHari krishna
Β 
Capital investment theory
Capital investment theoryCapital investment theory
Capital investment theorySumit Biswas
Β 
Cap budget [autosaved]
Cap budget [autosaved]Cap budget [autosaved]
Cap budget [autosaved]Kinnar Majithia
Β 
Pay back period ..chapter solution to problems...
Pay back period ..chapter solution to problems...Pay back period ..chapter solution to problems...
Pay back period ..chapter solution to problems...mianmohsinmumtazshb
Β 
Capital budgeting
Capital budgetingCapital budgeting
Capital budgetingTaha Qureshi
Β 
CAPITAL BUDGETING TECHNIQUES
CAPITAL BUDGETING TECHNIQUESCAPITAL BUDGETING TECHNIQUES
CAPITAL BUDGETING TECHNIQUESKhiemmy dela Torre
Β 
Time value of money
Time value of moneyTime value of money
Time value of moneyAmeen San
Β 
Chap009
Chap009Chap009
Chap009LUXSVB
Β 
Project Evaluation Report
Project Evaluation ReportProject Evaluation Report
Project Evaluation ReportJawad Ahmed
Β 
Average rate 0f return
Average rate 0f returnAverage rate 0f return
Average rate 0f returnSaurabh Sharma
Β 
Captial bugting
Captial bugtingCaptial bugting
Captial bugting3prem
Β 
Capital budgeting ppt
Capital budgeting pptCapital budgeting ppt
Capital budgeting pptDr. Sonam Arora
Β 
Capital Budgeting Er. S Sood
Capital Budgeting Er. S SoodCapital Budgeting Er. S Sood
Capital Budgeting Er. S Soodshart sood
Β 
Cf Capital Budgeting 6
Cf Capital Budgeting 6Cf Capital Budgeting 6
Cf Capital Budgeting 6rajeevgupta
Β 
Cf Capital Budgeting 6
Cf Capital Budgeting 6Cf Capital Budgeting 6
Cf Capital Budgeting 6rajeevgupta
Β 
fm_formula__ipcc-2.pdf
fm_formula__ipcc-2.pdffm_formula__ipcc-2.pdf
fm_formula__ipcc-2.pdfhitishaagrawal
Β 

What's hot (20)

Payback period by harikrishnanan
Payback period by harikrishnananPayback period by harikrishnanan
Payback period by harikrishnanan
Β 
Payback Analysis
Payback AnalysisPayback Analysis
Payback Analysis
Β 
Capital investment theory
Capital investment theoryCapital investment theory
Capital investment theory
Β 
Cap budget [autosaved]
Cap budget [autosaved]Cap budget [autosaved]
Cap budget [autosaved]
Β 
Pay back period ..chapter solution to problems...
Pay back period ..chapter solution to problems...Pay back period ..chapter solution to problems...
Pay back period ..chapter solution to problems...
Β 
Capital budgeting
Capital budgetingCapital budgeting
Capital budgeting
Β 
CAPITAL BUDGETING TECHNIQUES
CAPITAL BUDGETING TECHNIQUESCAPITAL BUDGETING TECHNIQUES
CAPITAL BUDGETING TECHNIQUES
Β 
Time value of money
Time value of moneyTime value of money
Time value of money
Β 
Chap009
Chap009Chap009
Chap009
Β 
Chapter 9 q&p
Chapter 9 q&pChapter 9 q&p
Chapter 9 q&p
Β 
Project Evaluation Report
Project Evaluation ReportProject Evaluation Report
Project Evaluation Report
Β 
Chap008
Chap008Chap008
Chap008
Β 
Average rate 0f return
Average rate 0f returnAverage rate 0f return
Average rate 0f return
Β 
Captial bugting
Captial bugtingCaptial bugting
Captial bugting
Β 
Capital budgeting ppt
Capital budgeting pptCapital budgeting ppt
Capital budgeting ppt
Β 
Capital Budgeting Er. S Sood
Capital Budgeting Er. S SoodCapital Budgeting Er. S Sood
Capital Budgeting Er. S Sood
Β 
Investment
InvestmentInvestment
Investment
Β 
Cf Capital Budgeting 6
Cf Capital Budgeting 6Cf Capital Budgeting 6
Cf Capital Budgeting 6
Β 
Cf Capital Budgeting 6
Cf Capital Budgeting 6Cf Capital Budgeting 6
Cf Capital Budgeting 6
Β 
fm_formula__ipcc-2.pdf
fm_formula__ipcc-2.pdffm_formula__ipcc-2.pdf
fm_formula__ipcc-2.pdf
Β 

Similar to Mekdella Woreda Chimit Masonry Dam CBA

Capital budgeting methods lecture notes
Capital budgeting methods lecture notesCapital budgeting methods lecture notes
Capital budgeting methods lecture notesWarui Maina
Β 
Chapter 9: Capital Budgeting Techniques
Chapter 9: Capital Budgeting TechniquesChapter 9: Capital Budgeting Techniques
Chapter 9: Capital Budgeting TechniquesFiaz Ahmad
Β 
Chapter 9:Capital Budgeting Techniques
Chapter 9:Capital Budgeting TechniquesChapter 9:Capital Budgeting Techniques
Chapter 9:Capital Budgeting TechniquesInocentshuja Ahmad
Β 
Slide 1 8-1Capital Budgetingβ€’ Analysis of potent.docx
Slide 1 8-1Capital Budgetingβ€’ Analysis of potent.docxSlide 1 8-1Capital Budgetingβ€’ Analysis of potent.docx
Slide 1 8-1Capital Budgetingβ€’ Analysis of potent.docxedgar6wallace88877
Β 
FM Ch6 Capital Budgeting.pptx
FM Ch6 Capital Budgeting.pptxFM Ch6 Capital Budgeting.pptx
FM Ch6 Capital Budgeting.pptxBarzalaCarcar
Β 
Lecture cash flow evaluation new
Lecture cash flow evaluation newLecture cash flow evaluation new
Lecture cash flow evaluation newBsgr Planmin
Β 
Lecture cash flow evaluation new
Lecture cash flow evaluation newLecture cash flow evaluation new
Lecture cash flow evaluation newBsgr Planmin
Β 
THAI MUSIC-Mariestela e
THAI MUSIC-Mariestela eTHAI MUSIC-Mariestela e
THAI MUSIC-Mariestela eMj Rufin
Β 
Fin 2732 investment decisions
Fin 2732 investment decisionsFin 2732 investment decisions
Fin 2732 investment decisionsYashGupta744
Β 
Cf%20 Capital%20 Budgeting%206
Cf%20 Capital%20 Budgeting%206Cf%20 Capital%20 Budgeting%206
Cf%20 Capital%20 Budgeting%206rajeevgupta
Β 
A ppt on capital expenditure by corporate for Mba
A ppt on capital expenditure by corporate for MbaA ppt on capital expenditure by corporate for Mba
A ppt on capital expenditure by corporate for MbaVishalMotwani15
Β 
CF (GROUP 9) SS.pptx
CF (GROUP 9)   SS.pptxCF (GROUP 9)   SS.pptx
CF (GROUP 9) SS.pptxSaksham950820
Β 
CAPITAL BUDGETING DECISIONS.ppt
CAPITAL BUDGETING DECISIONS.pptCAPITAL BUDGETING DECISIONS.ppt
CAPITAL BUDGETING DECISIONS.pptDr.K.Sivaperumal
Β 
Investment Decisions I.pptx
Investment Decisions I.pptxInvestment Decisions I.pptx
Investment Decisions I.pptxssuser2bba051
Β 
present worth analysis.ppt
present worth analysis.pptpresent worth analysis.ppt
present worth analysis.pptashwinigupta38
Β 
Chapter13 specialdecisionsituations
Chapter13 specialdecisionsituationsChapter13 specialdecisionsituations
Chapter13 specialdecisionsituationsAKSHAYA0000
Β 

Similar to Mekdella Woreda Chimit Masonry Dam CBA (20)

Priyankabba
PriyankabbaPriyankabba
Priyankabba
Β 
Lecture 3
Lecture 3Lecture 3
Lecture 3
Β 
Introduction to project economics in oil and gas upstream industry
Introduction to project economics in oil and gas upstream industryIntroduction to project economics in oil and gas upstream industry
Introduction to project economics in oil and gas upstream industry
Β 
Capital budgeting methods lecture notes
Capital budgeting methods lecture notesCapital budgeting methods lecture notes
Capital budgeting methods lecture notes
Β 
Chapter 9: Capital Budgeting Techniques
Chapter 9: Capital Budgeting TechniquesChapter 9: Capital Budgeting Techniques
Chapter 9: Capital Budgeting Techniques
Β 
Chapter 9:Capital Budgeting Techniques
Chapter 9:Capital Budgeting TechniquesChapter 9:Capital Budgeting Techniques
Chapter 9:Capital Budgeting Techniques
Β 
Slide 1 8-1Capital Budgetingβ€’ Analysis of potent.docx
Slide 1 8-1Capital Budgetingβ€’ Analysis of potent.docxSlide 1 8-1Capital Budgetingβ€’ Analysis of potent.docx
Slide 1 8-1Capital Budgetingβ€’ Analysis of potent.docx
Β 
FM Ch6 Capital Budgeting.pptx
FM Ch6 Capital Budgeting.pptxFM Ch6 Capital Budgeting.pptx
FM Ch6 Capital Budgeting.pptx
Β 
Capital budgeting
Capital budgetingCapital budgeting
Capital budgeting
Β 
Lecture cash flow evaluation new
Lecture cash flow evaluation newLecture cash flow evaluation new
Lecture cash flow evaluation new
Β 
Lecture cash flow evaluation new
Lecture cash flow evaluation newLecture cash flow evaluation new
Lecture cash flow evaluation new
Β 
THAI MUSIC-Mariestela e
THAI MUSIC-Mariestela eTHAI MUSIC-Mariestela e
THAI MUSIC-Mariestela e
Β 
Fin 2732 investment decisions
Fin 2732 investment decisionsFin 2732 investment decisions
Fin 2732 investment decisions
Β 
Cf%20 Capital%20 Budgeting%206
Cf%20 Capital%20 Budgeting%206Cf%20 Capital%20 Budgeting%206
Cf%20 Capital%20 Budgeting%206
Β 
A ppt on capital expenditure by corporate for Mba
A ppt on capital expenditure by corporate for MbaA ppt on capital expenditure by corporate for Mba
A ppt on capital expenditure by corporate for Mba
Β 
CF (GROUP 9) SS.pptx
CF (GROUP 9)   SS.pptxCF (GROUP 9)   SS.pptx
CF (GROUP 9) SS.pptx
Β 
CAPITAL BUDGETING DECISIONS.ppt
CAPITAL BUDGETING DECISIONS.pptCAPITAL BUDGETING DECISIONS.ppt
CAPITAL BUDGETING DECISIONS.ppt
Β 
Investment Decisions I.pptx
Investment Decisions I.pptxInvestment Decisions I.pptx
Investment Decisions I.pptx
Β 
present worth analysis.ppt
present worth analysis.pptpresent worth analysis.ppt
present worth analysis.ppt
Β 
Chapter13 specialdecisionsituations
Chapter13 specialdecisionsituationsChapter13 specialdecisionsituations
Chapter13 specialdecisionsituations
Β 

Mekdella Woreda Chimit Masonry Dam CBA

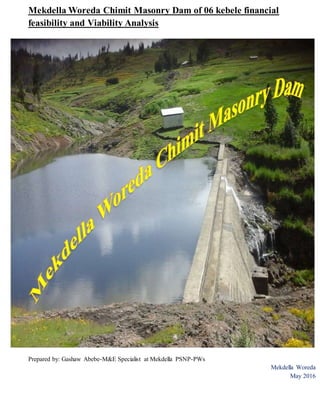
  • 1. Mekdella Woreda Chimit Masonry Dam of 06 kebele financial feasibility and Viability Analysis Prepared by: Gashaw Abebe-M&E Specialist at Mekdella PSNP-PWs Mekdella Woreda May 2016
  • 2. Chimit Masonry Dam financial feasibility and Viability Analysis Ever since 2011/12, in Mekdella Woreda Agriculture Development Office, under the support of PSNP capital budget various types of modern river diversion had been built which create enabling environment for smallholder farmers to improve agricultural products and productivities through commercial crop intervention in addition to stabilizing local markets. Profitability of irrigation schemes built before 2012/13 is earlier known since they are constructed rooted in none- intermittent local rivers; assessing financially viable, technically implementable and socially acceptable broadly emerging masonry dams before years of effort has been worthless (money, material, labor and time) is deemed important. To materialize it, therefore, a result of the study conducted on Chimit Masonry Dam built in 2015 in 06 kebele is explained bellow. Capital outlay from PSNP budget 1,019,703 Ethiopian Birr (ETB) had been utilized to construct the dam which can irrigate 48 ha of farm land to benefit 189 household heads. In this year,the dam is limited to cultivate onion, fenugreek, lentil, potato, etc only on 11 ha of farm land caused by el-nino crises resulted in reduction of volume of water. Taking the labor for farming practices as an implicit cost, in the first production year of 2015/16, as an operating cost, 205,306 ETB had been utilized to purchase selected seeds,fertilizer, pest and insecticide. This cost will significantly increase each year adding maintenance cost of the dam after two or three years. Cash inflow has shown a little decline in the first production year related to insufficient water reservation of the dam due to the prevailed drought. However,if the dam lasts long holding substantial amount of water in the upcoming years: more coverage of farm land will be irrigated; many farmers will get experience to participate; farmers will prefer to be engaged on producing high value crops and selling price will be improved and thus leading to surplus production. Based on this fact,keeping sustainable productivity of the dam, accounting profit-cost benefit analysis of Chimit Masonry Dam for the first five years is described here below using Payback Period, Net Present Value (NPV) and Internal Rate of Return (IRR). Note that all unites of money in this study is Ethiopian Birr (ETB) Activities Initial cost(0 Year) Year 1 Year 2 Year 3 Year 4 Year 5 T/Sum A) TotalCash outflow 1,019,703 205,306 250,410 302,920 375,169 450,960 2,604,468 B) Totalcash inflow 0 940,670 1,450,179 1,965,600 2,580,911 3,124,890 10,062,250 Net cash inflow(A-B) -1,019,703 735,364 1,199,769 1,662,680 2,205,742 2,673,930 7,457,782 NPV @ 12% -1,019,703 656,606.52 956,455.85 1,183,495.62 1,401,749 1,517,187.9 5,715,494.9 1. Payback Period Payback period uses to know how long it will take to earn back the money we invest on the project. Since the return from the project is expected to vary from year to year, we simply add up the expected returns for each succeeding year, until we arrive at the total cost of the project. In our case,the project would be completely paid for about 13 months in to the second year. Payback period = π‘π‘Žπ‘ β„Ž π‘œπ‘’π‘‘π‘“π‘™π‘œπ‘€ π‘Žπ‘›π‘›π‘’π‘Žπ‘™ π‘π‘Žπ‘ β„Ž π‘–π‘›π‘“π‘™π‘œπ‘€ + = π‘’π‘›π‘π‘Žπ‘–π‘‘ π‘π‘Žπ‘ β„Ž π‘œπ‘’π‘‘ π‘“π‘™π‘œπ‘€ 𝑑𝑒𝑑𝑒𝑐𝑑𝑒𝑑 π‘“π‘Ÿπ‘œπ‘š π‘ π‘’π‘π‘œπ‘›π‘‘ π‘¦π‘’π‘Žπ‘Ÿ π‘Ÿπ‘’π‘£π‘’π‘›π‘’π‘’ π‘ π‘’π‘π‘œπ‘›π‘‘ π‘¦π‘’π‘Žπ‘Ÿ π‘π‘Žπ‘ β„Ž π‘œπ‘’π‘‘π‘“π‘™π‘œπ‘€ 1+ 79,033 1,450,179 = 1.0545 years (Therefore,the dam will take 385 days = 1 year & 20 days to earn back the money). Using the payback period, we can only know the period it takes to recoup the original investment. However,it completely ignores the time value of money and the total project return. We therefore,use the Net Present Value (NPV) and Internal Rate of Return to solve this problem. These project evaluation methods allow us to consider time value of money. 2. Net present value (NPV) Basically, it allows us to know the present value in β€œto day’s birr” of the future net cash flow of a project. Then we can compare that amount with the amount of money needed to implement the project. If NPV is positive the project is acceptable to be implemented, if it is negative it could be rejected. Zero value projects are determined by the investor either to succeed or stop. Using this approach and the table illustrated above, NPV is calculated as follows: Net present value (NPV) = PVB – PVC Where,PVB = present value of benefit PVC = present value of cost 𝑁𝑃𝑉 = βˆ‘ 𝐡𝑑 (1+π‘Ÿ) 𝑛 𝑖=0 βˆ’ βˆ‘ 𝐢𝑑 (1+π‘Ÿ) 𝑛 𝑖=0 Where,B = Benefits; C = Costs; r = discount rate; t = time period; n = number of time periods
  • 3. NPV equals the summation from t = 0 (the initial start-up of the program) to t =n (the final year of the program) of [(Bt –Ct) / (1 + r) t]. 𝑁𝑃𝑉 = βˆ‘ 𝐡𝑑 (1+π‘Ÿ) 𝑛 𝑖=0 βˆ’ βˆ‘ 𝐢𝑑 (1+π‘Ÿ) 𝑛 𝑖=0 NPV @ 12% = 5,715,494.9 -1,019,703 = 4,695,791.87 The project is financially viable since NPV is positive. 3. Internal Rate ofReturn(IRR) Essentially, IRR allows us to find the interest rate that is equivalent to the birr returns we expect from our project or the birr return should be higher than we have discounted the project. Once we know the rate, we can compare it to the rates we could earn by investing our money in our intended project or other investments. If IRR is less than the prevailing discount rate,the project will definitely be worthless. Therefore,it is to be acceptable,a project must be expected to earn an IRR that is as a minimum severalpercentages higher than the cost of investment, to implement the project for its risk, time and the trouble associated with it. IRR has the following method of calculation. IRR = βˆ‘ 𝐡𝑑 (1+π‘Ÿ) 𝑛 𝑖=0 βˆ’ βˆ‘ 𝐢𝑑 (1+π‘Ÿ) 𝑛 𝑖=0 =0 Using rules of linear algebra, IRR can be computed as; 8,477,485 (1+𝐼𝑅𝑅) = 1,019,703 1,019,703(1+IRR) = 8,477,485 IRR= 8,477,485 1,019,703 -1= 7.3136805520823 IRR =731% Since by severalpercentages IRR is greater r (731% >12%) , this project is certainly acceptable to be implemented. In both methods, the project (Chimit Masonry Dam) is financially viable, technically implementable and socially acceptable. The following chart displays incremental change of net cash inflow and NPV each year. -1,500,000 -1,000,000 -500,000 0 500,000 1,000,000 1,500,000 2,000,000 2,500,000 3,000,000 Intial Year Year 1 Year 2 Year 3 Year 4 Year 5 Net cash inflow -1,019,703 735,364 1,199,769 1,662,680 2,205,742 2,673,930 NPV @12% -1,019,703 656,606.52 956,455.85 1,183,495.62 1,401,749 1,517,187.90 -1,019,703 735,364 1,199,769 1,662,680 2,205,742 2,673,930 -1,019,703 656,606.52 956,455.85 1,183,495.62 1,401,749 1,517,187.90 Mekdella Woreda Chimit Masonry Dam, diagramatic illustration of cost benefit analysis from 2015-2020 Net cash inflow NPV @12%