Download to read offline
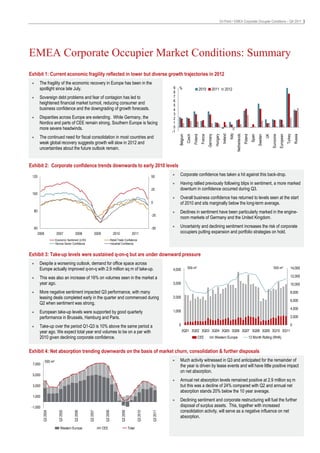


Falling corporate confidence due to the intensifying Eurozone crisis has increased pressure on corporate real estate (CRE) teams. CRE teams must pursue both cost savings and transformation agendas with limited options, as landlords are holding firm on pricing due to a lack of quality supply. Transformation is also challenging due to weak development pipelines, requiring pre-letting strategies to access quality space. Declining sentiment may cause corporations to delay expansion and portfolio strategies as uncertainties remain high. Office take-up was sustained in Q3 but is under pressure, while net absorption is trending down due to churn, consolidation, and disposals. Vacancy rates remain stable due to the availability of large volumes of poor quality stock. Completions of new space


