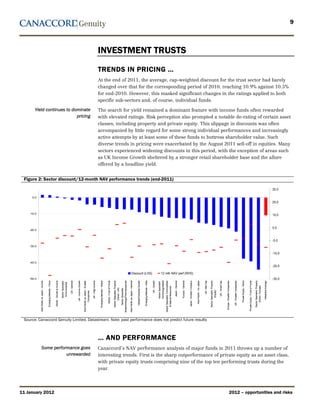
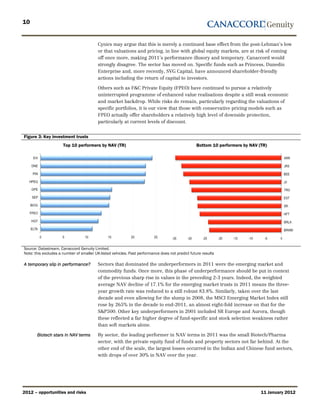
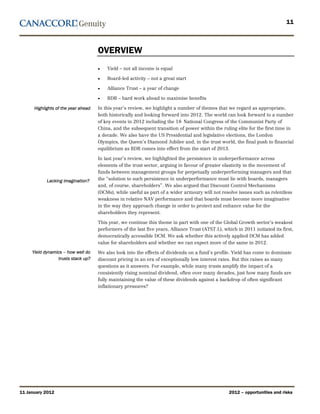
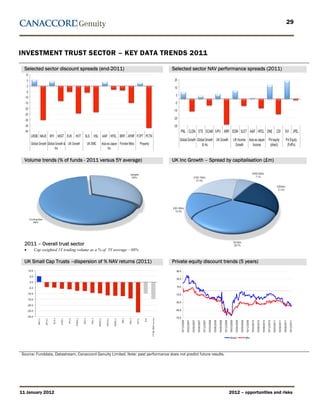
Paul Locke                                               Investment Trusts
44.20.7050.6709
plocke@canaccordgenuity.com
                                                         2012 – opportunities and risks
                                                         This is our fourth consecutive annual trust review and it comes after one of the most
                                                         tumultuous years for the global economy and the pricing of risk assets in a generation.
                                                         It would be a delight for us to argue the case for a strong rebound in both global growth
Inside                                                   levels and equity pricing in 2012, but the reality is that, for the west at least,
Global snapshot .................................2       structurally, little has changed thus far.
Key themes.........................................3
Investment trusts ...............................9       In last year’s review we highlighted three key questions for investors:
Overview .......................................... 11   •   Can the Euro survive its design flaws?
Portfolio strategy ............................. 20
Other stock picks for 2012............. 24               •   What will the level of US commitment be to fiscal orthodoxy (and when)?
Summary.......................................... 28     •   What are the prospects for a soft landing in China?
Key data trends for 2011 ............... 29
                                                         These questions remain unanswered, which suggests to us continued strong volatility,
                                                         uncertainty and risk in the coming year.

                                                         Political incompetence and vacillation has left the global economy floundering, with the
                                                         risk of renewed recession (or worse) and we think this could continue in 2012 as the US
                                                         heads further into its election cycle. We have moved from a financial to a sovereign debt
                                                         crisis and almost back again with a series of band-aid (monetary) policies failing to
                                                         provide a proper resolution to the key problem of excessive debt and the need for
                                                         governments and individuals to deleverage.

                                                         Companies have impressed in taking up the slack against a poor economic backdrop
                                                         and, in many cases, remain lean and profitable. But, questions remain over forward
                                                         earnings as Europe in particular heads back into recession.

                                                         Despite politicians’ inability to grasp the economic nettle, we see grounds for optimism,
                                                         though this remains on a highly selective asset class and manager-specific basis. We
                                                         hope to point out some of these potential “winners” and areas to avoid in 2012 and
                                                         beyond in the following pages.

                                                         We believe the year ahead offers a number of changes and challenges, not all of which
                                                         will be negative. It will be a demanding time for trusts, their managers and boards as
                                                         market uncertainties continue but also as we move towards the introduction of the
                                                         Retail Distribution Review (RDR) at the year-end. Investors will need to be nimble and
                                                         selective to profit from the current market environment, but we are of the view that the
                                                         broader closed-end fund sector remains the best place to generate excess returns.


This research note is produced by Canaccord Genuity Limited which is authorized and regulated by the Financial Services Authority (FSA).
This is non-independent research and a marketing communication under the FSA Conduct of Business rules. Please see the important disclosures section in
the appendix of this note which are an integral part of it or visit http://www.canaccordgenuity.com/EN/about/Pages/UKDisclosures.aspx for more
information.


11 January 2012                                                                                                                               2012-004
2


GLOBAL SNAPSHOT                                                      Yield dynamics – 10Y yield and % point change

Strategy drivers for 2012
•   Macro concerns continue to dominate – another difficult
    year.
•   Possible collapse or (at minimum) transformation of the
    Euro – more European QE likely.
•   Equities – a mixed picture:
    -   Emerging markets start to outperform developed
        markets from H2.
    -   Low interest rates will continue to reward income –
        but not all yields are alike.
    -   Markets are not normalised – key thematic drivers
        and herd mentality will drive profits.
•   Commodities – risks and opportunities abound, but
                                                                     Key market trends - 2011
    drivers will be stock and sector specific:
    -    Risks of a Chinese hard-landing imply continued,
         sentiment-driven volatility.
    -    Significant opportunities in constrained supply
         assets (gold, shale gas).
    -    Oil market volatility to intensify – supply not
         constrained, but political risks are rising (particularly
         over Iran).
•   Property – prime assets to continue to drive NAV growth.
•   Defensive assets will maintain their advantage.
•   Growing risk of global socio and geo-political unrest –
    disenfranchised populations carry risk and where next
    after the Arab spring?                                           Inflation (Current annual rate - %)
•   Extended recession in the West and risks of rising global
    protectionism.
•   Emerging market – monetary easing provides some (but
    not sufficient) support to global markets.
•   2012 pricing suggests an even stronger reliance on QE
    and corporate earnings to underpin equity growth.

Notable elections in 2012
January        Egypt & Taiwan
February       Greece & Yemen
March          Egypt & Russia (both presidential). Iran
April          Korea, France (presidential 1st round)
May            Palestine, France (presidential 2nd round)            Budget deficits (% of GDP)
June           Bahamas, Serbia, France
July           Mexico, Mali
August
September      Hong Kong
               Venezuela & Slovenia (both presidential). Ukraine,
October
               Georgia and Lithuania
November       US & Romania
December       Korea (presidential)


                                                                     Source for all charts: Canaccord Genuity Limited, Datastream


2012 – opportunities and risks                                                                                              11 January 2012
3


                                       KEY THEMES
                                       MACRO
                         All aboard    If investors thought 2011 was a rollercoaster ride, 2012 risks shaping up to be even more
                                       unpredictable. For four years, we have argued that the crisis of the west has been
                                       structural in nature rather than cyclical and, therefore, something that can be resolved by
                                       a resumption of growth. Many, if not most, structural issues (excess debt and the need for
                                       individuals and governments to deleverage) remain fundamentally unresolved, while new
                                       distortions in lending, debt and broader financial markets have been created (notably
                                       state ownership of its own asset base in the West through newly printed money).

              Dealing with change      A key concept for investors to accept is that the world has changed and continues to
                                       change. The crisis of 2008 accelerated this process and we believe the eventual winners
                                       could be many of the larger emerging states such as Brazil, India and China. However,
                                       this is not guaranteed and these states, along with Russia, the fourth member of the
                                       BRIC quartet, have their own problems to overcome in 2012. Therefore, we do not
                                       expect a repeat of post-Lehman’s 2008 when China expanded its own balance sheet to
                                       support the global economy this time around (or at least not to the same extent).

                                       As we have argued previously, however, there is always room for pricing growth in a
                                       variety of asset classes. Part of this could be general, supported by still more monetary
                                       expansion as the US, Europe and the UK deploy yet more quantitative easing (despite the
                                       largely still unproven case for its use thus far). But more likely, in our view, is that
                                       investors will have to delve deeper to unearth the pricing gems in 2012, amid a backdrop
                                       of sluggish economic growth, heightened fears for corporate earnings and, ultimately,
                                       the still strong risk of sovereign and bank sector default.


                                       KEY EVENT RISK
                                       Below we explore some areas that we see as the key geopolitical and economic risks
                                       moving into 2012 and, more crucially, how some anticipated events could be used
                                       through exposure to specific funds.

      Instability in the Middle East   Key event risks in 2012 could centre on a number of different but inter-linked points in
                                       the Middle East. Public aspirations from the Arab spring of 2011 remain, as yet, almost
                                       entirely unsatisfied and further violence should be expected. Where political pluralism of
                                       some kind has taken hold, the clear winners have been Islamic-focussed organisations,
                                       which is likely to raise concerns in the west, so long the supporter of a number of the
                                       region’s autocratic regimes.

                                       But the Arab spring has now spread to one of the region’s lynchpin states in Syria and
                                       the collapse of the Assad regime carries risks far beyond Syria’s borders, with a likely
                                       impact on Iran, Lebanon, Turkey and Israel. Elsewhere, an increasingly fractured Iraq is
                                       more and more coming under Iran’s influence (a final humiliation in wake of the Iraq
                                       war), while prospects for a strategic military strike against Iran also remain.

                                       This may or may not be linked to that country’s nuclear ambitions, or to a growing
                                       power struggle from within the Middle East itself. Syria’s collapse could ultimately
                                       provide for growing internal divisions within Iran (a second Green revolution, perhaps)
                                       while pressures for an oil embargo to be imposed on Iran could spark a more aggressive


11 January 2012                                                                                    2012 – opportunities and risks
4


                                      response. Similarly, despite spending billions of dollars on welfare projects in an attempt
                                      to placate its own population, discontent within the Shia minority in Saudi Arabia
                                      remains and may surface further in 2012.

                                      This all has implications for the oil sector. While OPEC has the capacity to raise output
                                      (and could have done so already as the most vivid sign of its support for the global
                                      economy), an event-driven spike in oil prices, with all its implications for economic well
                                      being, cannot be dismissed in 2012.

              Hard landing in China   However, this appears unlikely to us, particularly with the transition in power of much of
                                      the political establishment that is due to take place in early 2013. But investors should be
                                      prepared for such an eventuality, which could spark (at least in the short term) a
                                      potential collapse in commodity pricing, with implications for a vast number of states
                                      including the producer states in Latin America as well as Australia and Canada. Once
                                      more, we highlight that while attention in recent years has been focussed on Chinese
                                      demand as the key underpin for commodities pricing, this ignores fundamental supply
                                      factors and any notable correction in pricing should be viewed opportunistically. Chinese
                                      authorities have room to ease monetary policy further, though not to the same extent as
                                      in 2008. However, we expect the government will, above all else, be keen to oversee a
                                      smooth transition to the new political leadership that takes control in 2013, which
                                      suggests it will do everything possible to avert any economic hard landing.

    China – a changing of the guard   One of the key changes for 2012 will be the run up to an effective changing of the old
                                      guard in China – this after a decade in power. Amid a backdrop of growing structural
                                      weakness and imbalance in the Chinese economy, the country is due to replace much of
                                      its political leadership in late-2012, for just the fifth time since the revolution and with its
                                      new leaders set to rule for the next decade. The Communist Party has already indicated a
                                      dramatic shift away from what some say is a failing system of firstly export-led growth
                                      and subsequently investment-led expansion.

                                      As well as Vice-President Xi Jinping and Vice-Premier Li Keqiang being likely to succeed
                                      the current incumbents, President Hu Jintao and PM Wen Jibao effective from the
                                      Congress of late-2012 (officially from March 2013), there are due to be significant changes
                                      to the higher ranks of the People’s Liberation Army (PLA) as a number of its leading
                                      figures reach mandatory retirement. Orderly transition will be the priority, which will
                                      include doing everything to ensure continuity in economic well-being for the populace.

                                      However, this political accession will also be accompanied by strong economic transition
                                      from 2013 onwards and particularly in 2013-15 (external situation allowing) as attempts
                                      are made to refocus towards a more consumption-based growth strategy. This will not
                                      be easy and perhaps key here will be how the new government reacts to any signs of
                                      civil unrest.

                  Sovereign default   Arguably, the key western developed states have escaped lightly thus far. With global
                                      interest rates low and the emphasis firmly on creative book keeping, debt burdens have
                                      been manageable. However, 2013-15 offers one of the largest roll-over periods in history
                                      for a number of western economies. With this backdrop, one has to ask whether these
                                      highly developed but indebted states could cope with another banking or liquidity crisis.
                                      The answer has to be no, but even in the absence of such a crisis, sovereigns face a wall
                                      of repayment, excessive debts and a likely increase in financing costs as interest rates
                                      eventually rise (or new debt terms are secured). The European authorities have already
                                      pushed forward vast sums in the form of a new borrowing facility in a bid to ensure


2012 – opportunities and risks                                                                                       11 January 2012
5


                                     monetary stability and minimise risks of a banking crisis. This may actually prove more
                                     beneficial, given its specific targeting, than the broad-brush QE approach adopted
                                     elsewhere. However, we cannot dismiss the risk of sovereign default and a renewed
                                     banking crisis in 2012.
Prospects for the other BRICs (and   Time has already been called by some on the BRIC phenomenon. However, while we
                emerging markets)    agree that the BRICs face significant problems in H1/12, they again have room to ease
                                     monetary policy as the global economy slows. Indian inflation appears increasingly
                                     structurally ingrained, which raises concerns, while Russian autocracy looks likely to
                                     come under ever greater scrutiny. However, broader trends such as young populations
                                     (ex-China where demographic problems will grow), ever expanding credit, mortgage and
                                     consumer markets and the sheer dynamics of many emerging market companies appear
                                     likely to continue to underpin the BRIC and broader emerging market phenomenon for
                                     some time.

                     US elections    The US elections will perhaps be the defining event of 2012, as well as just how well the
                                     US and global economies cope. Key will be the ability of political figures to rise above the
                                     mud-slinging and enact necessary fiscal reforms (or even extend or manage existing
                                     legislation). Signs are not positive that this can be achieved, though we see no reasons to
                                     be excessively pessimistic at this stage. Much will depend ultimately on the choice of
                                     Republican candidate to face President Obama which, as yet, is undecided. Any
                                     polarisation of politics does not bode particularly well for strong and decisive legislative
                                     action with prospects for either damaging tax cuts on one hand or a failure to rein in
                                     spending excess on the other.


11 January 2012                                                                                    2012 – opportunities and risks
6


Figure 1: Scenario analysis
    Scenario                                  Key fund exposure                   Focus/dynamic
    Capital protection                        Personal Assets Trust; Premia       Personal Assets may not suit all investors with concerns over two
                                              Plus                                key portfolio dynamics – US Treasuries and Gold (some 50% of
                                                                                  NAV). Premia Plus will succeed IVPH.L from end-February 2011
                                                                                  and offers a proven methodology through a futures-based
                                                                                  allocation model and will provide an original concept for
                                                                                  investors in 2012.
    Chinese hard landing                                                          All commodity funds will be hard hit, but indirect exposure will go
                                                                                  significantly further. Chinese centred funds and those exposed to
                                                                                  producer nations in, for example, Brazil, Australia and Canada
                                                                                  could be expected to suffer disproportionately
    Commodities                               City Natural Resources High Yield   Potential for a shock and continued escalated volatility on
                                                                                  Chinese hard landing prospects. Yet key themes such as shale
                                                                                  gas/oil and margin growth at gold miners continue to underpin
                                                                                  this fund relative to its peers, while M&A activity is also expected
                                                                                  to be supportive
    Cyclical recovery – emerging markets      Templeton Emerging Markets.         We still advise caution on many emerging market equities in Q1-
                                                                                  Q2, but monetary policies are now being eased and the long-
                                                                                  term case for the asset class and particular high profile states
                                                                                  remains fundamentally intact. Key emerging markets will be the
                                                                                  long-term winners of the West’s current crisis.
    Discount to cash                          Federated Enhanced Treasury         See page 27
                                              Income Fund (FTT.N)
    Discounted yield                          Guggenheim Enhanced Equity          A covered call fund, GGE strongly outperformed the S&P500 in
                                              Strategy (GGE.N)                    2011 and more than doubled its yield (to an indicated 7.7%, with
                                                                                  3% from income). Yet this elevated distribution policy has yet to
                                                                                  be fully reflected in its discounted rating (-14.5%).
    Europe                                    Jupiter European Opportunities      Positive stock and country allocation with strong management.
    Inflation protection                      Western Asset/Claymore Inflation-   While UK-listed funds offering “inflation protection” attract
                                              linked Opps (WIW.N); Western        significant premiums (such as those in the PFI arena), WIW and
                                              Asset/Claymore Inflation-linked     WIA both attract double-digit discounts, offer yields of circa 4%
                                              Secs (WIA.N)                        and are at least 80% invested in inflation-linked securities and
                                                                                  has strongly outperformed the S&P500 in the last 5 years.
    Innovation & development                  Biotech Growth Trust                A vibrant performer in its own right, BIOG also benefits from
                                                                                  accelerated bid activity in the sector, including that for key
                                                                                  holding Pharmasset. With cash-rich pharma stocks seeking to
                                                                                  buy rather than develop new product lines, we see the potential
                                                                                  for further growth in the BIOG NAV.
    Japan                                     Baillie Gifford Japan               Stronger GDP growth prospects as the post-earthquake recovery
                                                                                  continues, combined with exceptional stock selection from
                                                                                  manager Sarah Whitley.
    Oil price spike                           Artemis Alpha; Petroleum &          Over one-third of the ATS portfolio is exposed to oil and gas
                                              Resources Corp (PEO.N)              producers with, markets allowing, still strong upside value to be
                                                                                  gained from the present carrying value. PEO’s NAV effectively
                                                                                  tracks the DJ Oil & Gas Index and offers a portfolio dominated by
                                                                                  names such as Exxon Mobile and Chevron.
    Property                                  F&C Commercial Property Trust;      Continued exposure to prime assets is recommended, at least in
                                              ISIS Property Trust                 H1/12. Strong and proven managers at F&C REIT, with IPT also
                                                                                  commanding a significantly higher yield than the sector average.
    Yield differentiation                     New City High Yield; Middlefield    Proven manager with an exceptional track record in active
                                              Canadian Income                     portfolio management, NCYF offers both a more durable and
                                                                                  differentiated source of yield (for MCT see page 24).

Source: Canaccord Genuity Limited

                                           The death of North Korean leader Kim Jong-il in December 2011 threw another potential
    Korean peninsular – death of a         ‘hand grenade’ into the global mix. Jong-il’s death and his succession by his third son,
                          dictator
                                           Kim Jong-un, raises the prospect of heightened political uncertainty, both internally and
                                           regionally.

                                           Succession planning in North Korea has been underway since Kim Jong-il suffered a
                                           stroke in late-2008. However, the late nature of Jong-un’s move to become the preferred


2012 – opportunities and risks                                                                                                        11 January 2012
7


                                    successor over his two older brothers, together with the young General’s (as he has been
                                    termed) lack of experience, suggests his powerbase is likely to be immature and
                                    underdeveloped. This latest succession, therefore, suggests an expanded role for the
                                    military, at least in the short term.

                                    External powers are also likely to seek to raise their influence in coming months,
                                    particularly China. However, prospects for a Korean version of the Arab spring seem
                                    small in such an isolated state and, more likely, is a scenario of rising regional tensions
                                    in the broader Korean peninsular.

  A shift towards protectionism     Perhaps one of the greatest triumphs of 2011 was the lack of protectionism or new trade
                                    barriers that are often erected opportunistically during a period of global economic crisis
                                    by politicians threatened by their own inadequacies to cope with that crisis. This does
                                    not mean they will not come, however, and an extended period of stagnation or renewed
                                    recession in the west would dramatically increase the likelihood of an escalation in trade
                                    tensions and the imposition of punitive sanctions by certain states.


                                    ON A BRIGHTER NOTE …
                                    The most favourable scenarios for 2012 generally point to a further year of muddling
                                    through for the global economy with the possibility (though not probability) of a surprise
                                    on the upside for global growth given that sentiment is so weak. Investors may also
                                    benefit from a herd mentality in following the continued risk-on, risk-off movements and
                                    close correlations of major asset classes in Q1 in particular. But, we recommend being
                                    quick to take profits on both sectors and outperforming stocks.

                                    In terms of governmental support, key will be to watch for further supportive action from
                                    the world’s monetary authorities, which equity markets have generally lapped up during
                                    the last two years. However, the risk here is that the drug of monetary stimulus will
                                    begin to wear off and the resultant equity highs will be less frequent and less euphoric.

              Corporate earnings    We think this may be the biggest determinant of equity movements in 2012 – just how
                                    well earnings growth performs both in absolute terms and relative to expectations. Apart
                                    from governments’ continued support of risk assets through monetary expansion, it has
                                    been the broad health of company balance sheets that has maintained equity expansion
                                    in recent years. While we expect this to continue in a number of areas (defensives, gold
                                    producers, emerging market consumption plays, innovative technologies), strong focus
                                    should be paid to first quarter earnings in particular and to the durability of income
                                    streams in order to determine just how well companies are performing, this as Europe
                                    and, possibly thereafter, the US head back into flat growth or outright recession.

   H2 revival in emerging markets   Many emerging markets are now at the top of their previous tightening cycle and some,
                                    including China and Brazil, have already been cutting interest rates as their economies
                                    slow. Inflation remains relatively entrenched in states such as India and Turkey (the
                                    latter offering the risk of another hard landing) and we advise caution. However,
                                    expectations are that a renewed loosening of policy during 2012 will provide support to
                                    equities. The underperformance of emerging market equities in 2011 was perhaps not
                                    surprising given their strong recovery since the post-Lehman’s era. However, we regard
                                    the asset class strongly from both a top-down and bottom-up perspective, with an
                                    emphasis firmly on managers with a bias towards stock selection rather than index
                                    replication.


11 January 2012                                                                                   2012 – opportunities and risks
8


                   Event specific    Events such as the Queen’s Diamond Jubilee (June) and the London Olympics (July-
                                     August) should not be entirely dismissed and they offer potential upside to UK-focussed
                                     equities and other asset classes in 2012. Specific analysis of the benefits of major events
                                     on stock markets is relatively limited and, of course, gains have already been derived by
                                     London and the broader UK during the construction and build-out process. However, we
                                     think additional tourism and consumption are likely to benefit key stocks in 2012.


                                     … AND MICRO
                                     We see two defining risks in the year ahead – the risk that corporate fundamentals,
                                     having been so strong in recent years, could disappoint as economies weaken once more
                                     and, secondly, the imposition of ever more restrictive regulation.

                                     Of course, the idea of tighter regulation in, for example, the banking sector, is to create a
Excessive regulation carries risks   more efficient and secure system. However, risks remain that inadequate steps will
                                     merely delay not prevent a renewed banking crisis, while excessively restrictive and
                                     hurried laws could prompt both a further decline in lending and, as we have already
                                     seen, threats by major institutions to relocate.

                                     But not all legislation is negative. After all, 31 December 2012 will see the
But RDR provides the Trust world     implementation of the FSA’s Retail Distribution Review (RDR), initially launched in 2006
              with opportunities     as a means of improving training of financial advisers and raising the transparency and
                                     fairness in the fee charging system. 2012 could, therefore, be a pivotal year for the entire
                                     investment trust sector. Will trusts themselves be sufficiently well prepared to access the
                                     distribution platforms? Which funds or groups will benefit most? And, will independent
                                     advisors be sufficiently well versed in the often esoteric workings of the trust sector?


2012 – opportunities and risks                                                                                     11 January 2012
9


                                                                                                                                                                                                                 INVESTMENT TRUSTS
                                                                                                                                                                                                                 TRENDS IN PRICING …
                                                                                                                                                                                                                 At the end of 2011, the average, cap-weighted discount for the trust sector had barely
                                                                                                                                                                                                                 changed over that for the corresponding period of 2010, reaching 10.9% against 10.5%
                                                                                                                                                                                                                 for end-2010. However, this masked significant changes in the ratings applied to both
                                                                                                                                                                                                                 specific sub-sectors and, of course, individual funds.
       Yield continues to dominate                                                                                                                                                                               The search for yield remained a dominant feature with income funds often rewarded
                            pricing                                                                                                                                                                              with elevated ratings. Risk perception also prompted a notable de-rating of certain asset
                                                                                                                                                                                                                 classes, including property and private equity. This slippage in discounts was often
                                                                                                                                                                                                                 accompanied by little regard for some strong individual performances and increasingly
                                                                                                                                                                                                                 active attempts by at least some of these funds to buttress shareholder value. Such
                                                                                                                                                                                                                 diverse trends in pricing were exacerbated by the August 2011 sell-off in equities. Many
                                                                                                                                                                                                                 sectors experienced widening discounts in this period, with the exception of areas such
                                                                                                                                                                                                                 as UK Income Growth sheltered by a stronger retail shareholder base and the allure
                                                                                                                                                                                                                 offered by a headline yield.


 Figure 2: Sector discount/12-month NAV performance trends (end-2011)

                                                                                                                                                                                                                                                                                                                                                                                                                                                                                                                                                                                                                                                                                                                                                                                                                         35.0

     0.0
                                                                                                                                                                                                                                                                                                                                                                                                                                                                                                                                                                                                                                                                                                                                                                                                                         25.0


    -10.0
                                                                                                                                                                                                                                                                                                                                                                                                                                                                                                                                                                                                                                                                                                                                                                                                                         15.0


                                                                                                                                                                                                                                                                                                                                                                                                                                                                                                                                                                                                                                                                                                                                                                                                                         5.0
    -20.0


                                                                                                                                                                                                                                                                                                                                                                                                                                                                                                                                                                                                                                                                                                                                                                                                                         -5.0
    -30.0

                                                                                                                                                                                                                                                                                                                                                                                                                                                                                                                                                                                                                                                                                                                                                                                                                         -15.0

    -40.0
                                                                                                                                                                                                                                                                                                                                                                                                                                                                                                                                                                                                                                                                                                                                                                                                                         -25.0

                                                                                                                                                                                                                                                                                                                                                   Discount (LHS)                                                                                12 mth NAV perf (RHS)
    -50.0                                                                                                                                                                                                                                                                                                                                                                                                                                                                                                                                                                                                                                                                                                                                                                                                                -35.0
                                                                                                                                                                                                                                                                                                                                                                                                                                         Technology/Media
                                                                                                                                                                                                                                                                       Sector Specialist: Property


                                                                                                                                                                                                                                                                                                                                                                                                                                                                                                                                                                                                        Sector Specialist: Property


                                                                                                                                                                                                                                                                                                                                                                                                                                                                                                                                                                                                                                                                                                                                       Private Equity - Fund of Funds

                                                                                                                                                                                                                                                                                                                                                                                                                                                                                                                                                                                                                                                                                                                                                                        Sector Specialist: Property
            Asia Pacific ex Japan - Income


                                                                        Global - Growth & Income


                                                                                                                                       UK - Income Growth


                                                                                                                                                                                                                                                                                                                                                                       Global/Overseas Growth


                                                                                                                                                                                                                                                                                                                                                                                                                           UK - Growth


                                                                                                                                                                                                                                                                                                                                                                                                                                                                                                                                                                                         UK - Mid Cap
                                                                                                                                                                                              UK - High Income


                                                                                                                                                                                                                                                                                                     Biotechnology/Pharmaceuticals


                                                                                                                                                                                                                                                                                                                                                                                                Emerging Markets - India


                                                                                                                                                                                                                                                                                                                                                                                                                                                                                                                                                              Asia Pacific - inc Japan


                                                                                                                                                                                                                                                                                                                                                                                                                                                                                                                                                                                                                                                                                                             Private Equity - Direct
                                                                                                                                                                                                                                              Global - Fund of Funds


                                                                                                                                                                                                                                                                                                                                                                                                                                                                                                                                    Japan - Smaller Company
                                             Emerging Markets - China


                                                                                                                                                                                                                                                                                                                                                                                                                                                                                                                                                                                                                                      UK - Small Cap
                                                                                                                                                            Asia Pacific ex Japan - Smaller


                                                                                                                                                                                                                                                                                                                                     Asia Pacific ex Japan - General
                                                                                                   Sector Specialist:


                                                                                                                        US - General


                                                                                                                                                                                                                                                                                                                                                                                                                                                              Sector Specialist: Commodities


                                                                                                                                                                                                                                                                                                                                                                                                                                                                                               Japan - General


                                                                                                                                                                                                                                                                                                                                                                                                                                                                                                                 Europe - General


                                                                                                                                                                                                                                                                                                                                                                                                                                                                                                                                                                                                                                                       Europe - Smaller Companies


                                                                                                                                                                                                                                                                                                                                                                                                                                                                                                                                                                                                                                                                                    US - Smaller Companies


                                                                                                                                                                                                                                                                                                                                                                                                                                                                                                                                                                                                                                                                                                                                                                                                      Weighted Average
                                                                                                                                                                                                                  Emerging Markets - Global


                                                                                                                                                                                                                                                                                                                                                                                                                                         Sector Specialist:
                                                                                                    Environmental


                                                                                                                                                                                                                                                                                                                                                                                                                                                                                                                                                                                                                                                                                                                                                                            (Direct - Europe)
                                                                                                                                                                                                                                                                                                                                                                                                                                                                   & Natural Resources
                                                                                                                                                                                                                                                                              (Direct - UK)
                                                                                                                                                                                                                                                                                                            Sector Specialist:


                                                                                                                                                                                                                                                                                                                                                                                                                                                                                                                                                                                                                 (Equity)
                                                                                                                                                                      Companies


 Source: Canaccord Genuity Limited, Datastream. Note: past performance does not predict future results


                                                                                                                                                                                                                 … AND PERFORMANCE
                   Some performance goes                                                                                                                                                                         Canaccord’s NAV performance analysis of major funds in 2011 throws up a number of
                              unrewarded                                                                                                                                                                         interesting trends. First is the sharp outperformance of private equity as an asset class,
                                                                                                                                                                                                                 with private equity trusts comprising nine of the top ten performing trusts during the
                                                                                                                                                                                                                 year.


11 January 2012                                                                                                                                                                                                                                                                                                                                                                                                                                                                                                                                                                                                                                                           2012 – opportunities and risks
10


                                          Cynics may argue that this is merely a continued base effect from the post-Lehman’s low
                                          or that valuations and pricing, in line with global equity markets, are at risk of coming
                                          off once more, making 2011’s performance illusory and temporary. Canaccord would
                                          strongly disagree. The sector has moved on. Specific funds such as Princess, Dunedin
                                          Enterprise and, more recently, SVG Capital, have announced shareholder-friendly
                                          actions including the return of capital to investors.

                                          Others such as F&C Private Equity (FPEO) have continued to pursue a relatively
                                          uninterrupted programme of enhanced value realisations despite a still weak economic
                                          and market backdrop. While risks do remain, particularly regarding the valuations of
                                          specific portfolios, it is our view that those with conservative pricing models such as
                                          FPEO actually offer shareholders a relatively high level of downside protection,
                                          particularly at current levels of discount.


Figure 3: Key investment trusts
                      Top 10 performers by NAV (TR)                                              Bottom 10 performers by NAV (TR)


Source: Datastream, Canaccord Genuity Limited.
Note: this excludes a number of smaller UK-listed vehicles. Past performance does not predict future results

A temporary slip in performance?          Sectors that dominated the underperformers in 2011 were the emerging market and
                                          commodity funds. Once more, this phase of underperformance should be put in context
                                          of the previous sharp rise in values in the preceding 2-3 years. Indeed, the weighted
                                          average NAV decline of 17.1% for the emerging market trusts in 2011 means the three-
                                          year growth rate was reduced to a still robust 83.8%. Similarly, taken over the last
                                          decade and even allowing for the slump in 2008, the MSCI Emerging Market Index still
                                          rose by 265% in the decade to end-2011, an almost eight-fold increase on that for the
                                          S&P500. Other key underperformers in 2001 included SR Europe and Aurora, though
                                          these reflected a far higher degree of fund-specific and stock selection weakness rather
                                          than soft markets alone.

       Biotech stars in NAV terms         By sector, the leading performer in NAV terms in 2011 was the small Biotech/Pharma
                                          sector, with the private equity fund of funds and property sectors not far behind. At the
                                          other end of the scale, the largest losses occurred in the Indian and Chinese fund sectors,
                                          with drops of over 30% in NAV over the year.


2012 – opportunities and risks                                                                                                11 January 2012
11


                                     OVERVIEW
                                     •   Yield – not all income is equal

                                     •   Board-led activity – not a great start

                                     •   Alliance Trust – a year of change

                                     •   RDR – hard work ahead to maximise benefits

      Highlights of the year ahead   In this year’s review, we highlight a number of themes that we regard as appropriate,
                                     both historically and looking forward into 2012. The world can look forward to a number
                                     of key events in 2012 including the 18 National Congress of the Communist Party of
                                                                             th


                                     China, and the subsequent transition of power within the ruling elite for the first time in
                                     a decade. We also have the US Presidential and legislative elections, the London
                                     Olympics, the Queen’s Diamond Jubilee and, in the trust world, the final push to financial
                                     equilibrium as RDR comes into effect from the start of 2013.

                                     In last year’s review, we highlighted the persistence in underperformance across
                                     elements of the trust sector, arguing in favour of greater elasticity in the movement of
                                     funds between management groups for perpetually underperforming managers and that
            Lacking imagination?     the “solution to such persistence in underperformance must lie with boards, managers
                                     and, of course, shareholders”. We also argued that Discount Control Mechanisms
                                     (DCMs), while useful as part of a wider armoury will not resolve issues such as relentless
                                     weakness in relative NAV performance and that boards must become more imaginative
                                     in the way they approach change in order to protect and enhance value for the
                                     shareholders they represent.

                                     This year, we continue this theme in part with one of the Global Growth sector’s weakest
                                     performers of the last five years, Alliance Trust (ATST.L), which in 2011 initiated its first,
                                     democratically accessible DCM. We ask whether this actively applied DCM has added
                                     value for shareholders and whether we can expect more of the same in 2012.
     Yield dynamics – how well do    We also look into the effects of dividends on a fund’s profile. Yield has come to dominate
                 trusts stack up?    discount pricing in an era of exceptionally low interest rates. But this raises as many
                                     questions as it answers. For example, while many trusts amplify the impact of a
                                     consistently rising nominal dividend, often over many decades, just how many funds are
                                     fully maintaining the value of these dividends against a backdrop of often significant
                                     inflationary pressures?


11 January 2012                                                                                     2012 – opportunities and risks
12


                                       YIELD - ALL INCOME IS NOT NECESSARILY EQUAL
                                       If there has been one dominant, even overriding, theme in the trust world in recent years,
Interest rates to stay low for some    it has been that of income. This is not surprising in an environment of both heightened
                            time yet   uncertainty and historically low interest rates, with both the US Federal Reserve and the
                                       Bank of England having already signalled their intent to keep rates low for the next two
                                       years. Almost all fund launches and secondary market issues in 2011 had a strong
                                       income theme, while ratings of higher-yielding trusts also remained relatively high and
                                       seemingly protected.

                                       However, a high headline yield does not necessarily translate into a good deal for
                                       investors. Indeed, shareholders will have to be increasingly savvy in the year ahead to
                                       ensure their dividend flow is not disrupted (at the stock or sector-specific level) or that the
                                       benefits of this yield are not offset by a variety of other factors.

  Three- year figures look good …      In this report we seek to analyse some of the attributes offered by higher yielding funds in
                                       recent years to determine if elevated pricing has, in effect, been worthwhile. As shown in
                                       the graphic below, on a three-year basis many high-yielding funds have delivered
                                       exceptional NAV returns, far beyond those offered by government debt. And many of
                                       these funds have been rewarded for these profiles, with elevated, often premium, ratings.


                                        Figure 4: Selected funds - yield relative to NAV total return (three years)


                                        Source: Funddata, Canaccord Genuity Limited

                                       However, over 12 months the picture looks different, with many funds that often retained
… but shorter-term dynamics raise      elevated ratings delivering a poor showing in terms of overall NAV returns. Yet this
                       questions       disparity in return profile was not always reflected in weaker pricing levels, with the
                                       glamour of a high headline yield often underpinning prices despite evident weakness and,
                                       in some cases, often strong losses on the capital side. This has begun to change, however,
                                       with heightened market volatility in the final quarter of 2011 prompting de-ratings on
                                       high-yielding funds such as TR Property Trust (TRY.L). We also saw other, even
                                       premium-rated yield plays such as Henderson Far East Income (HFEL) and Blackrock
                                       Commodities Income (BRCI.L) move back into discount territory (albeit at marginal


2012 – opportunities and risks                                                                                        11 January 2012
13


                                    levels). In these cases, market pricing finally began differentiating between not just a high
                                    headline yield, but the broader dynamics of an often poor total return profile offered by at
                                    least some of these funds.


                                     Figure 5: Selected funds - yield relative to NAV total return (12 months)


                                     Source: Funddata, Canaccord Genuity Limited

                                    One further dynamic that we believe investors should increasingly take on board is the
        And what about inflation?   current and future rate of inflation, as rising prices necessarily eat into or erode the value
                                    of a fund’s dividend income, particularly if growth in this income is not fully maintained.

                                    This is particularly pertinent going forward as central banks seem keen to foster even
                                    higher price pressures in order to monetise debt. Indeed, the priority is on loose and even
                                    highly expansionary monetary policy to support growth (almost at any cost) with pricing
                                    pressures that do exist (now and in future) of secondary concern to many governments.

                                    So where do the yields of many of our income-based funds feature relative to current
                                    levels of inflation? As can be seen in the chart below, many UK-listed funds fare poorly.
                                    Indeed, not only have many incurred capital losses over the last year, they also feature a
                                    headline yield that is below the current rate of UK inflation, offering, therefore, far more
                                    than investors would be able to generate from keeping their money in the bank, but a
                                    real terms contraction nonetheless.

                                    If UK inflation were to persist at these levels, therefore, it is not just the headline yield
                                    that is important, but the real terms adjusted level of payment and, of course, the rate of
                                    forward growth likely to be achieved in a given fund’s future dividend stream.


11 January 2012                                                                                      2012 – opportunities and risks
14


Figure 6: Selected income-focused trusts – yield relative to UK inflation


Source: Canaccord Genuity Limited, Datastream


                                       Yield growth – the real dynamic?
     Dividend growth disappoints       Much is often made in the trust sector of funds having delivered dividend growth for
                                       extended periods, often stretching into many decades. Significantly less emphasis is
                                       placed on the actual rate of dividend growth that has been delivered during these years.
                                       However, surely a real test of
                                                                         Distribution of yield growth by fund (5 year, % of total)
                                       the vibrancy of a manager’s
                                       performance is the
                                       willingness to share those
                                       benefits with the fund’s
                                       shareholders, through both
                                       Alpha delivery and dividend
                                       growth.

                                       But dividend expansion
                                       within the trust sector over
                                       the last five years has been       Source: Funddata, Canaccord Genuity Limited
                                       disappointing to say the
                                       least. There are, of course, exceptions, with funds such as City Natural Resources High
                                       Yield (CYN.L,) having delivered a doubling of its dividend in the last five years, only to see
                                       its headline yield diluted by the even more dynamic rise in the share price and NAV.
Inflation-adjusted dividend growth     But we find the overall picture disappointing in terms of the ability of many funds to
                    is even weaker     expand their payout ratios at a decent rate over time. Now, of course, many of these
                                       funds do not even claim to have a progressive dividend policy: they are growth-orientated


2012 – opportunities and risks                                                                                       11 January 2012
15


                                       and this should be taken on board. However, Canaccord analysis using an annualised
                                       rate of dividend growth for the last five years for 435 London-listed trusts reveals that a
                                       staggered 71.7% had either failed to implement any annualised increase over this five-
                                       year period or had actually experienced a contraction in their dividend payments
                                       (perhaps temporary, but a cut nonetheless). Only 28.3%, or less than one-third of trusts,
                                       experienced an annualised growth rate in their dividend over this extended five-year
                                       period under review.

                                                                                                        Yet while this may be
                                        Inflation adjusted yield growth (5 year, % of funds)            disappointing in its own
                                                                                                        right, a pure expansion or
                                                                                                        contraction in dividend
                                                                                                        growth rates does not tell
                                                                                                        the entire story. Over this
                                                                                                        five-year period, inflation
                                                                                                        in the UK averaged an
                                                                                                        annualised 3.23% or a
                                                                                                        cumulative 17.2%. Now
                                                                                                        this, to the shareholder at
                                         Source: Funddata, Canaccord Genuity Limited.                   least, should represent a
                                                                                                        natural level of dividend
                                       growth required for the level of their income to stand still. However, when adjusted on
                                       this basis, the percentage of funds that have delivered sub-inflation growth in their five-
                                       year annualised dividend rate rose to 78.6%, with only 21.4% of LSE listed trusts
                                       managing to grow their dividend at a level in excess of the cumulative rate of UK inflation
                                       in this period.
Closer scrutiny of yield dynamics is   In summary, we suggest that rather than looking at the headline yield, investors need to
                             needed    delve far deeper, looking at the level and consistency of capital growth achieved by a
                                       particular manager (as this is highly complementary to any dividend payment) and the
                                       rate of growth in dividend that has and is expected to be obtained from a particular fund.


                                       BOARD-LED ACTIVITY - NOT A GREAT START
 How active were boards in 2011?       In our 2011 forward review, we argued that persistence in NAV underperformance had
                                       become endemic in some areas of the trust sector and that Discount Control Mechanisms
                                       (DCMs) had, in some respects, simply perpetuated such underperformance. We also
                                       stated that we believed the sector lacked the “elasticity in movement” and that the
                                       answer “cannot be with yet more buybacks or tenders and removing capital from the
                                       Trust market. The answer has to be with board and investors becoming more proactive
                                       in moving assets elsewhere”.

            Not very is the answer!    Did this prove to be the case in 2011? The short answer has to be no. We did not see any
                                       dramatic upsurge in boards seeking to move assets from perpetual underperformers to
                                       higher Alpha managers or from overpopulated sectors to areas that are vastly under-
                                       represented (such as mainstream US equities).


11 January 2012                                                                                     2012 – opportunities and risks
16


                                    Funds came and went in 2011.
                                    Notable casualties included Anglo &                                                                                         Selected trust sectors by capitalisation
                                    Overseas plc and Electric & General                                                                                         (£m)
                                    Investment Trust, though assets
                                    were not retained within the trust
                                    sector by initiating something new
                                    or innovative – a move to an asset
                                    class or manager that investors
                                    wanted and would perhaps
                                    appreciate more (and price
                                    accordingly).

                                    Separately, 2011 saw one trust
                                    move away entirely from its
                                    previously tight DCM. Gartmore
                                    European (now Henderson
                                                                              Source: AIC
                                    European Focus Trust) having seen
                                    its capitalisation slip from over £400 million to under £90 million, changed tack on its
                                    DCM, investment remit and approach – this to effectively prevent a further death of a
                                    thousand cuts. While the board of Gartmore European decided to abandon a rigid system
                                    to prevent the fund moving to an illiquid rump, contrast this with Alliance Trust – which
                                    moved from perennially denying the use of buybacks to become one of its greatest
                                    advocates, at least during 2011.

STS board deserves all the praise   We would argue that the most rewarding, board-led move in the trust sector in 2011 was
                                                                                                 that of Securities Trust of
                                       Discount trends, STS versus 12-month average              Scotland (STS.L). The fund
                                            6                                                    had long struggled in the UK
                                            4                                                    Income Growth sector with a
                                            2
                                                                                                 comparatively low level of
                                            0
                                                                                                 reserves and a surplus of
                                           -2
                                                                                                 peers, with the board
                                           -4

                                           -6
                                                                                                 therefore making the decision
                                           -8                                                    to move the fund to the Global
                                          -10                                                    Growth & Income sector. A
                                                                     09/02/2011


                                                                                               09/04/2011


                                                                                                            09/05/2011


                                                                                                                         09/06/2011


                                                                                                                                                   09/08/2011


                                                                                                                                                                09/09/2011


                                                                                                                                                                                          09/11/2011


                                                                                                                                                                                                       09/12/2011
                                           09/12/2010


                                                        09/01/2011


                                                                                  09/03/2011


                                                                                                                                      09/07/2011


                                                                                                                                                                             09/10/2011


                                                                                                 simultaneous change in fund
                                                                                                 manager (while staying at
                                                                    STS    Ave                   Martin Currie) provided a
                                       Source: Canaccord Genuity Limited, Datastream             further fillip, with the move
                                                                                                 welcomed by the market with
                                    a shift to a premium rating. STS has since this period sustained a good initial
                                    performance in its new home, outperforming many of its counterparts, albeit over a very
                                    short time.
      A new style of product from   Other changes were also apparent. Invista Foundation Property Trust has moved to the
                          Invesco   stewardship of Schroders, while perhaps more exciting is the change in Invesco Perpetual
                                    Select’s Hedge Fund class to that of a conceptually new (for the trust sector), long-only
                                    model operated by the group’s Premia Plus team in Atlanta. Canaccord met with this
                                    team in late-2011 and we believe it offers a differentiated model from the Fund of Hedge
                                    Funds grouping, with a strong record in terms of minimising drawdowns (thereby
                                    enhancing overall returns) and this against a backdrop of full asset liquidity and no costly


2012 – opportunities and risks                                                                                                                                                                                      11 January 2012
17


                                    lock-ins. The transfer of this asset class does not officially take place until February 2012,
                                    although we are optimistic it will offer shareholders something different and strong,
                                    particularly amid the wild market swings we have seen in 2011 and expect to see once
                                    more in 2012.

                                    But, unfortunately, that was about it. 2011 was not a year in which boards sought to
                                    rejuvenate or rapidly improve the foundations of many poorly performing funds, with the
                                    perpetuation of underperformance for another year at least. Boards may look to the
                                    volatility of markets in 2011 as good reason to sit tight, but ultimately the sector needs to
                                    reward strong-performing managers (which it does to a reasonable degree) and penalise
                                    those that consistently fail to deliver (which it often fails to do).

                                    Perhaps 2012 will see a more proactive response from boards. However, at present, truly
                                    imaginative board initiatives remain in relatively short supply with the use of share
                                    buybacks, the occasional tender or open-ending remaining the preferred options to take.


                                    ALLIANCE TRUST - A YEAR OF CHANGE …
                                    … but did shareholders truly benefit?
   A new kid on the buyback block   Perhaps one of the most dramatic events of 2011 was the shift in corporate governance
                                    by the previously reticent Alliance Trust in finally enacting a fully democratic share
                                    buyback policy. This contrasted with the fund’s previously somewhat shallow (just two
                                    repurchases) and highly selective (favouring specific shareholders) repurchase system.

                                    The move was dramatic. Some 10.25% of the fund’s share capital has disappeared since
                                    February, with a massive 67.76 million shares repurchased and cancelled. This enhanced
                                    the NAV for those that remain by an estimated 6.48p per share (or just over 7p when
                                    calculated on a cum-income basis), with the fund’s discount moving from 16.2% at the
                                    start of the year to 14.9% at its close.

      Unleashing the big bazooka    So superficially, at least, the repurchase programme has not materially enhanced the
                                    NAV or provided significant levels of discount compression. ATST certainly used its “big
                                    bazooka” in 2011 and it could be argued that with holders of 10.2% of shares seeking an
                                    exit in the first year of the programme (this, remember, at still strong levels of discount),
                                    such a buyback system was needed. After all, without the company buying in its own
                                    shares so extensively and if the secondary market alone had been used to satisfy those
                                    shareholders seeking an exit, the fund’s discount would have been substantially wider.

                                    Yet even with this sizeable chunk of the fund’s shares repurchased and cancelled,
                                    questions remain over the validity of the programme notably for the following reasons:

                                    •   Those shareholders seeking change have not exited the fund.

                                    •   Enhancement to the NAV has, arguably, been marginal.

                                    •   No sign as yet of closure in demand by those shareholders seeking an exit.

                                    •   NAV performance, the real dynamic behind ATST’s wide discount, shows few
                                        material signs of improvement.

                                    Share buybacks have become the norm and often the first port of call rather than a “tool
                                    in the investment trust box” in recent years. This, we believe (and as we highlighted in
                                    last year’s forward review), could prove detrimental to long-term shareholders in the
                                    sector as liquidity shrinks still further.


11 January 2012                                                                                   2012 – opportunities and risks
18


                                     Figure 7: Alliance Trust – monthly share buyback analysis


                                     Source: Funddata, Bloomberg, Canaccord Genuity Limited

                                    ATST has been late to the party in terms of introducing a widely accessible buyback
                                    programme, but the inherent problems the fund faced prior to its adoption remain
                                    intractably in place – performance. There are simply too many far better performing
                                    vehicles out there for investors to choose from.

     Are share buybacks enough?     Despite the fund’s shrinkage in 2011, it remains at a sustained 5.5% discount to its peers
                                    in the Global Growth sector (against 6.9% at the end of 2010). One could argue that this
                                    discount would have been significantly higher in the absence of the new DCM, yet the
                                    reality remains that ATST’s problems of persistent underperformance, and discounted
                                    pricing (to its peers), will not go away if another 70 million shares (or more) were to be
                                    cancelled in 2012 as well.
     RDR could disproportionately   One glimmer of light for ATST is perhaps the commencement of the Retail Distribution
                    benefit ATST    Review (RDR) from the start of 2013. Given the fund’s size, marketing capacity and
                                    existing positioning within the retail market, as well as the presence of its own RDR-
                                    ready platform, it should be among the main beneficiaries of the expected increase in
                                    retail demand for trusts as discrimination in the broader funds market is removed. What
                                    percentage of the still potentially sizeable slack in institutional demand seeking an exit
                                    from ATST can be offset by higher, RDR-based retail purchases? Only time will tell.


                                    RDR - MAXIMISING THE BENEFITS
                                    2012 should prove a pivotal year for funds as we move towards the introduction of RDR
                                    from 31 December. Will RDR provide a huge surge in new client demand? Probably not,
                                    but it should be welcomed nonetheless, with far too much emphasis placed on share
                                    repurchases in recent years rather than attracting new clients into the sector.

                                    Brokers have gorged themselves on share buybacks in recent years, but the question
                                    remains as to whether this has really delivered a more vibrant and accurately priced
                                    investment trust sector, Again, the answer is probably no, but what we have now is the
                                    opportunity for the sector to offer itself to retail clients and their advisors on a level
                                    playing field and for this new source of client demand to be brought into what remains a


2012 – opportunities and risks                                                                                 11 January 2012
19


                                      fundamentally attractive means of accessing global risk assets and high quality managers
                                      (this on a long-term basis without liquidity call interruptions).
         Branded names the main       RDR by its nature is likely to favour those bigger franchises within the investment trust
        beneficiaries at the outset   sector – well known and branded management houses and the larger capitalised,
                                      relatively mainstream funds. With interest rates remaining low and gains from RDR
                                      obviously biased towards the retail client, initial attention is also expected to be focussed
                                      on higher-yielding, mainstream funds rather than those at the more esoteric end of the
                                      trust spectrum. Funds such as Alliance Trust should also benefit from the outset with its
                                      own RDR-compliant platform, while pressure will intensify for other funds to maximise
                                      their presence within the existing platform system.

                                      This market is dominated by highly interactive and all-encompassing platforms operated
                                      by CoFunds (multiple owners), FundsNetwork (managed by Fidelity) and Skandia Group’s
                                      platform. These platforms offer advisors a one-stop shop for all their pricing, trading and
                                      settlement needs as well as the usual variety of product packaging or wrapping options
                                      under which such investments are ultimately held (SIPPs, ISAs etc). According to the AIC,
                                      these three platforms currently account for 70% of the £164 billion platform market, with
                                      CoFunds alone claiming a 26% market share.

                                      A cursory glance at the websites of these groups reveals little information on the trust
                                      sector or individual trusts at this stage, which is not surprising as they do not presently
                                      offer investment companies. However, to get off the ground running, it will be crucial for
                                      trusts, their boards and their brokers to access these existing distribution networks in
                                      order to maximise potential interest in the shortest possible time.

 Overall, RDR should be welcomed      We believe RDR should be welcomed, with the long-term bias by financial advisors to
                                      higher fee-paying unit trusts set to be consigned to history. This does, however, create its
                                      own problems that will have to be overcome. The uplift in potential demand created by
                                      RDR will not necessarily be smooth or equally spread. Individual trusts will have to fight
                                      hard to establish themselves both with the platform providers and the broader advisor
                                      community.

                                      Similarly, explanation of the benefits (and risks) of investing in investment trusts will be
                                      required. Joe Public may not take kindly to being told that while their investment had
                                      outperformed the market, they had actually lost money due to a notable widening of the
                                      fund’s discount. Other key features that will assist trusts in terms of maximising upside
                                      gains from RDR will probably include a low TER and plain structure.

                                      This is perhaps understandable but a shame nonetheless. Indeed, rather than the main
                                      beneficiaries of RDR in the trust world being those funds, as is presently anticipated, from
                                      the big houses and with a greater index bias and often little managerial added-value, the
                                      real gems to be found in the trust sector are those that provide something different from
                                      the norm and where the manager is allowed to add true value.


11 January 2012                                                                                     2012 – opportunities and risks
20


                                    PORTFOLIO STRATEGY
                                    Introduction
              Cautious in H1/12     We retain a cautious outlook on global equities, particularly in the first half of 2012.
                                    Macroeconomic uncertainties persist and concerns remain over the durability of
                                    momentum in corporate earnings. Underlying companies have proved resilient post-
                                    2008, yet earnings downgrades appear to be accelerating as economic activity dampens
                                    still further. And if this materialises, markets do not necessarily look that cheap.

                                    However, our expectations are for an accelerated growth profile for certain asset classes,
                                    perhaps from end-Q1 but most likely from mid-2012, as emerging markets undertake an
                                    accelerated monetary easing and China, in particular, deploys strategies that are more
                                    accommodating in terms of forward asset growth.

                                    Indeed, it could be argued that while severe macro imbalances remain to be addressed,
                                    these could be superseded by strong socio or geo-political risks during 2012. While
                                    sovereign risks have certainly not gone away, tensions, particularly in the Middle East
                                    and South East Asia, could come to the fore in 2012 – a case of the global economy
                                    muddling through and being overtaken in importance by events elsewhere.

                  Global equities   The concept of wealth protection should therefore be a priority for investors, particularly
                                    in the first quarter of 2012. This suggests investors may be wise to take a short-term
                                    allocation to funds such as Personal Assets (PNL.L). However, with almost 50% of assets,
                                    allocated to global bonds and gold this, of course, carries its own risk dynamic. This
                                    could take the form of a sharper upturn in global growth than expected (unlikely) or a
                                    more pronounced decline in sentiment towards the increasingly distorted US Treasury
                                    market (expected to materialise at some point).

                                    For those that believe US Treasuries will retain their shine and defensive attributes, we
                                    would allocate capital to Federated Enhanced Treasury Income Fund (FTT.N). At end-
                                    November 2011, this US-listed vehicle had 90% of its assets invested in US Treasuries or
                                    cash, with just less than 10% in government agency MBS’s, yet attracted a 13% discount.

                                    Elsewhere, we continue to favour strong, stock-picking managers rather than quasi
                                    trackers, with thematic or stock-specific earnings momentum (or protection) ultimately
                                    set to be rewarded. In this respect, we continue to favour allocations to the distinctive
                                    management skills offered by, for example, Bruce Stout at the currently more defensive
                                    Murray International (MYI.L) and, for longer-term investors, Michael MacPhee and
                                    Gerald Smith at Mid Wynd (MWY.L) and Monks (MNKS.L) respectively.

                   Commodities      Concerns over a hard landing in China and the growing correlation of many asset classes
                                    (including Gold with equities) led to a sharp fall in equity pricing in this sector from April
                                    2011 onwards, with the average, market cap weighted drop in NAV among the
                                    commodity trusts reaching 23.1% for the year as a whole. This is disappointing but,
                                    perhaps, not surprising given the run up in pricing seen since late-2008 with, for
                                    example, the NAV of City Natural Resource High Yield (CYN.L) rising a staggering 270%
                                    from October 2008 to end-2011 or almost 4.5 times the level of return achieved on the
                                    FTSE100 over the same period.

                                    A combination of resource scarcity (in certain areas), high margins and new thematic
                                    drivers (shale gas in Europe, for example), continue to underpin our optimism for (highly


2012 – opportunities and risks                                                                                    11 January 2012
21


                                  selective) areas of the sector. However, we advise caution in Q1/12, with little
                                  discrimination between various sub-asset classes and concerns over the health of the
                                  Chinese economy merely set to produce intense levels of volatility. However, we do not
                                  share concerns that China is moving towards a hard landing, while cash-rich corporates
                                  eager to access new supply chains are likely to underpin further growth in the M&A
                                  market. Again, underlying market dynamics favour a more selective rather than broad-
                                  brush approach and, as a result, we continue to favour City Natural Resource High Yield
                                  as the best means of accessing the commodities space.

              Smaller companies   Last year, we asked whether the time had come again for smaller companies. Growing
                                  risk aversion over 2011 suggested this was not the case, with the FTSE Small Cap Index
                                  falling almost 15% over the year, against a drop of just 5.5% for the FTSE100.
                                  Simultaneously, discount pricing on smaller company trusts widened from an average of
                                  14% to 18%.

                                  Part of the reasoning behind our prognosis last year was that the long-awaited and
                                  required consolidation of the smaller company space had finally taken place, leaving
                                  investors with a leaner, fitter, but still diverse, selection of funds. While further
                                  consolidation appears likely, we take comfort from the performance of Strategic Equity
                                  Capital (SEC.L) and Montanaro UK Smaller Companies Trust (MTU.L), which finished in
                                  first and second place respectively in terms of NAV performance in 2011. Both also
                                  comfortably beat the FTSE Small Cap ex-ICs Index for the year as well as the FTSE100.

                                  We remain positive on both of these funds in 2012, each for their own, slightly different,
                                  reasons. SEC’s development of its portfolio continues apace and this is now a nicely
                                  maturing basket of individual stocks, often now paying dividends and achieving growth
                                  and therefore finally being credited with the pricing we believe it deserves. We cannot
                                  say the same for SEC – a fund not only offering one of the tightest DCMs in the broader
                                  trust sector, but also a NAV performance rating within its peer group of first and third
                                  respectively over both one and three years (this with a three-year NAV return of over
                                  140%). Therefore, we hope and anticipate that SEC’s managers will be more
                                  appropriately rewarded by the market in 2012.

                                  MTU also continues to perform well, benefitting greatly from the manager’s consistent
                                  approach and the stock selection skills of the broader team. By using a highly targeted
                                  and internally-driven method of stock selection and investing only in profitable
                                  companies, MTU offers shareholders strong assurances in a period of intense volatility.
                                  Yet once again, MTU stands at a discount to the small-cap sector despite having
                                  generated a similar NAV return to that of the often premium-rated Standard Life UK
                                  Smaller Companies Trust (SLS.L) over both one and three years.

              Emerging markets    In July 2010, we argued specifically in relation to Asian equities, that “irrational
                                  enthusiasm” and growing global cross winds suggested that the “market may be
                                  reaching a short-term top or a stage at which such exuberance may be quickly followed
                                  by disappointment”. The region, as measured by the MSCI Asia ex-Japan index, has
                                  dramatically underperformed the S&P500 and FTSE100 since this period providing, of
                                  course, natural disappointment for investors.

                                  Concerns remain that certain weaknesses within Asia (such as high inflation in India) are
                                  becoming more structural than cyclical in nature. However, in broad terms, we continue
                                  to favour both Asia and the broader emerging market sphere and underperformance,


11 January 2012                                                                               2012 – opportunities and risks
22


                                    particularly since August 2011 needs to be set against the dramatic rise in equity pricing
                                    that once again followed the post-Lehman’s lows.

                                    We expect further weakness in the early stages of 2012 but see the next six months as a
                                    period of accumulation on the dips and any widening in accompanying trust discounts.
                                    Caution is advised on key states – potential overheating in Turkey, risks of a hard
                                    landing in China – but the asset class contains some of the world’s most vibrant and
                                    (now) increasingly attractively priced companies. Similarly, demographic changes and
                                    shifts in middle class consumption patterns and product demand offer strong
                                    opportunities to longer-term investors. As such, while we view 2012 as likely to continue
                                    to provide some volatility in the asset class (particularly in H1), we are of the view that
                                    prospects for the next decade remain excellent.

                                    We believe short-term risks suggest a need for wider pricing on our previously favoured
                                    Aberdeen Asian Smaller Cos (AAS.L) and that discounts on the emerging generalist trusts
                                    are also uncomfortably tight given anticipated risks in H1/12. However, the Asian
                                    generalist trusts are looking increasingly attractive and we favour allocations to strong,
                                    stock-picking funds such as Aberdeen New Dawn (ABD.L) and Edinburgh Dragon
                                    (EFM.L) in the year ahead. Fidelity Asian Values’ (FAS.L) currently higher exposure to
                                    the Korean market should be noted by investors as a potential key point of both upside
                                    and downside risk.

                                    For those seeking broader global exposure to emerging markets and stock-specific rather
                                    than index-based Alpha, we would recommend exposure to funds such as Scottish
                                    Mortgage (SMT.L), Monks (MNKS.L) and Mid Wynd (MWY.L). Each of these funds has
                                    30%+ allocated to the asset class, on a highly selective, stock-specific basis rather than
                                    through simple index exposure. For those looking for an uptick in emerging market
                                    pricing after the weakness of 2011, but within the confines of a broader allocation and
                                    often at more attractive pricing levels, these funds appear to tick a number of boxes.

                   Private equity   In a period of intense volatility and uncertainty, many private equity funds generated
                                    positive and signifcant returns in
                                                                            Discount trends – Private equity funds (2011)
                                    2011 and should be
                                    congratulated for doing so. The            50.0

                                    sector also witnssed notable               30.0

                                    improvments with the adoption              10.0
                                    of shareholder-friendly policies
                                                                              -10.0
                                    such as accelerated returns of
                                    capital (from realisations),              -30.0

                                    tenders and buybacks, with                -50.0

                                    funds such as Dunedin                     -70.0
                                    Enterprise (DNE.L), Princess
                                                                              1 5 /1 2 /2 0 0 6
                                                                                                  1 5 /0 3 /2 0 0 7
                                                                                                                      1 5 /0 6 /2 0 0 7
                                                                                                                                          1 5 /0 9 /2 0 0 7
                                                                                                                                                              1 5 /1 2 /2 0 0 7
                                                                                                                                                                                  1 5 /0 3 /2 0 0 8
                                                                                                                                                                                                      1 5 /0 6 /2 0 0 8
                                                                                                                                                                                                                          1 5 /0 9 /2 0 0 8
                                                                                                                                                                                                                                              1 5 /1 2 /2 0 0 8
                                                                                                                                                                                                                                                                  1 5 /0 3 /2 0 0 9
                                                                                                                                                                                                                                                                                      1 5 /0 6 /2 0 0 9
                                                                                                                                                                                                                                                                                                          1 5 /0 9 /2 0 0 9
                                                                                                                                                                                                                                                                                                                              1 5 /1 2 /2 0 0 9
                                                                                                                                                                                                                                                                                                                                                  1 5 /0 3 /2 0 1 0
                                                                                                                                                                                                                                                                                                                                                                      1 5 /0 6 /2 0 1 0
                                                                                                                                                                                                                                                                                                                                                                                          1 5 /0 9 /2 0 1 0
                                                                                                                                                                                                                                                                                                                                                                                                              1 5 /1 2 /2 0 1 0
                                                                                                                                                                                                                                                                                                                                                                                                                                  1 5 /0 3 /2 0 1 1
                                                                                                                                                                                                                                                                                                                                                                                                                                                      1 5 /0 6 /2 0 1 1
                                                                                                                                                                                                                                                                                                                                                                                                                                                                          1 5 /0 9 /2 0 1 1
                                                                                                                                                                                                                                                                                                                                                                                                                                                                                              1 5 /1 2 /2 0 1 1


                                    (PEY.L) and SVG Capital (SVI.L)
                                    to the fore; we do, however,
                                                                                                         Direct FofFs
                                    consider SVI’s recently
                                                                            Source: Canaccord Genuity Limited, Datastream
                                    announced distribtion policy to
                                    be punitive given the amount of cash already on the balance sheet.

                                    3i and Candover aside, returns in the sector were positive and a further refocussing of
                                    balance sheets also continued. Yet such improvements and strong levels of realisation on
                                    funds such as F&C Private Equity went largerly unrewarded.


2012 – opportunities and risks                                                                                                                                                                                                                                                                                                                                                   11 January 2012
23


                  Of our four favoured funds in our forward note for 2011, three generated double-digit
                  returns for investors: LMS Capital (+23.6%), F&C Private Equity (+13.2%) and GPE
                  (+14.4%) with only one - Electra (-15.5%) - falling short of expectations. Though the
                  macro environment remains onerous, we continue to favour the sector moving forward
                  and allocations should be made primarily on the basis of portfolio valuation and
                  realisation potential. Therefore, we continue to recommend buying F&C Private Equity.

                  Further consideration should be paid by investors to this sector. We would also consider
                  HgCapital (HGT.L) in 2012. Though not cheap compared to its peers, we regard it as a
                  proven source of Alpha with a team offering a strong track record. We were previously
                  less optimistic on this vehicle, believing that the then premium ratings applied missed
                  the point of a high cash weighting and forward risks of both de-rating and, in particular,
                  that this money would take time to put to work (i.e. an extended J-curve). Well the fund
                  still has a strong cash bias, but the current estimated double-digit discount is certainly a
                  more attractive point to access this actively-managed fund.

                  As can be seen from the graph on the previous page, private equity as an asset class was
                  signfiicantly de-rated by the market in 2011 despite often strong gains in terms of NAV
                  delivery, balance sheet improvments, enhanced value realisations and, in some cases at
                  least, a still strong level of portfolio activity. Not all funds delivered, but many did and
                  some went further in dramatatically enhancing their relations with their shareholders
                  through plans to return capital.

                  It is arguable, however, that during 2011, little or no differentiation in pricing occurred
                  between the good, the bad and the downright ugly during this renewed de-rating phase.
                  For example, Dunedin Enterprise has delivered NAV growth of over 30% in the last three
                  years and introduced a new distribution policy in 2011. Other funds such as Candover
                  and 3i lost over 30% of shareholder NAV in the same timeframe. Liquidity may be one
                  thing, but long-term and proven management performance is also worth paying up for.

                  However, we do expect material differentiation to occur on a fund-specific basis in 2012
                  across the broader private equity sector and for the discounts of the strongest funds to
                  rebound positively.


11 January 2012                                                                 2012 – opportunities and risks
24


                                      OTHER STOCK PICKS FOR 2012
     Biotech Growth Trust (BIOG.L)    This trust does not always offer investors a smooth ride and we expect no difference
                                      moving forward. However, we believe the long-term fundamentals remain strong and the
                                      outlook for the sector robust, with cash-rich companies bidding for new product lines.
                                      Management has a proven track record and our prime concern here remains not the
                                      asset class, but a fairly concentrated shareholder register and an often shallow level of
                                      daily liquidity.
     Middlefield Canadian Income      With a yield of 4.8% (payable quarterly), we are of the view that MCT offers distinct
                          (MCT.L)     advantages over some of its other income counterparts. These include a strong exposure
                                      to the vibrant Canadian economy with MCT particularly well exposed to favoured sectors
                                      such as the high yielding end of the energy and real estate markets. The fund also
                                      provides far greater levels of geographic, stock and yield-specific diversification than
                                      many FTSE100-based UK income trusts, though MCT would be heavily exposed to a
                                      sharp drop in commodities pricing and a broader global economic slump. The fund
                                      offers a covered dividend and a great track record of Alpha delivery and could be used as
                                      a bolt-on strategy to a broader pool of income vehicles.

            India Fund Inc (IFN.N).   Aberdeen Asset Management assumed control of this fund in late-2011 and we expect
                                      that this will now be managed in a similar vein to the strong-performing New India Fund
                                      (NII.L). NII has added material value for investors in the last three years, versus both the
                                      Sensex and its peers, yet with a capitalisation of £115 million and an often poor trading
                                      profile, slips below the radar of at least some investors. IFN, in contrast, is capitalised
                                      almost five times larger than NII and offers a trading profile (in volume terms) over five
                                      times greater, so we believe this vehicle should appeal under its new stewardship to a
                                      broader range of clients. India itself offers further potential weakness in the short term
                                      and rising expectations for a pronounced cut in interest rates may yet be dashed amid
                                      still strong inflationary pressures. However, the supply of strong, relatively cash-rich
                                      companies is exemplary and, for longer-term investors, we believe further market
                                      weakness will provide grounds for long-term and opportunistic accumulation.

                      Premia Plus     When this share class is introduced from the end of February 2012 (in place of the
                                      existing Invesco Perpetual Select Hedge fund class), it will target a continuously balanced
                                      exposure to commodities, stocks and bonds, with ample diversification and a proven
                                      record. Canaccord met with lead managers Mark Ahnrud and Christian Ulrich in late-
                                      2011. They presently manage US$3.2 billion under this strategy and results have been
                                      exceptional, not just in terms of the level of returns (with strong capital protection), but
                                      also the stability of those returns over various market phases. In the three years to end-
                                      November 2011, the approach generated a return of 17.4% against 11.0% for the 60/40
                                      World Balanced Index (a combination of the MSCI World Equity Index and Barclays
                                      Aggregate Bond Index).

                                      The existing Fund of Hedge Funds sector contains many inadequacies, including (but not
                                      limited to) a lack of transparency, poor (relative) performance in both rising and falling
                                      markets, high fees, exposure to often lower-tier managers and costly lock-ups. But such
                                      characteristics cannot be labelled at Premia Plus. The fund will offer a balanced exposure
                                      to a variety of sub-classes within each of the commodity, equity and bond spaces, with
                                      the aim of minimising excessive drawdowns, with this blended approach also ensuring
                                      continued outperformance of at least some elements of the portfolio whatever the market


2012 – opportunities and risks                                                                                     11 January 2012
25


                                     backdrop. The use of futures to operate this strategy also allows for immediate and
                                     comparatively costless liquidation (if required) of the portfolio and we look forward to
                                     providing investors with greater detail on the strategy and people concerned in the next
                                     two months.

      Murray International (MYI.L)   Canaccord last met with manager Bruce Stout in October 2011 and his stated aim then
                                     for 2011 as a whole was to preserve capital and raise the fund’s dividend, both of which
                                     he achieved. Offering an already fairly defensive bias, Stout was at the time raising the
                                     fund’s level of security still further, with purchases of further stock in Mexican beer-
                                     producer FEMSA, which performed very well (in pricing and revenue growth terms) in
                                     2011 and the always cash-generative Johnson & Johnson.

                                     In broader terms, as readers will have seen from this report, we commend such a
                                     defensive but still stock-creative approach to global markets and portfolio construction.
                                     After all, in times of turbulence, it is good to hold stocks that are less sensitive to
                                     economic shocks. Some may argue that it is an easy call to recommend the already
                                     premium-rated MYI. Yet it is Stout’s strong simultaneous exposure to both cash-
                                     generative but still dynamic themes such as rising emerging market consumption that we
                                     salute and we expect the fund to protect on the downside in 2012 with the potential to
                                     also benefit on the upside as the cyclical recovery in emerging markets takes hold.


11 January 2012                                                                                  2012 – opportunities and risks
26


                                    US CEFS - WHERE THE ACTION IS?
 An underutilised source of Alpha   There is little doubt that the US closed end fund sector remains an attractive but under-
                                    utilised source of global exposure for many UK-based investors. Indeed, it is arguable
                                    that US CEFs should be viewed as highly complementary to the UK trust sector and, as
                                    such, we have included a number of these funds in this review. US listed vehicles operate
                                    in a different, arguably more retail-based, environment, which often provides disparities
                                    in trading patterns compared to their UK-listed counterparts. However, once these
                                    differences are understood they should not be viewed by investors as being problematic.

                                    At the time of writing this report, the US CEF sector comprised 635 funds, with net
                                    assets of US$210.9 billion. Of these funds, just over 9% were capitalised at below US$50
                                    million. The US CEF sector offers a market capitalisation-weighted discount of just 3.1%.
                                    However, this hides a huge spread of ratings, from discounts of over 30% (for example,
                                    on the small Foxby Corp, which has 17% of its assets invested in Apple Inc) to premiums
                                    in excess of 70% for Pimco’s Global StockPLUS & Income Fund (PGP.N).

     Greater and targeted choice    We believe the US CEF
                                    market provides investors         Assets and no of funds by listing
                                    with a broader choice of
                                    funds as well as
                                    differentiated types of
                                    asset, many of which are
                                    simply not available in the
                                    UK trust market. These
                                    include funds that invest in
                                    government debt, covered-
                                    call funds, emerging
                                    market debt vehicles as
                                    well as those investing in
                                    limited duration securities,
                                    a broader span of high            Source: Canaccord Genuity, AIC, Morningstar
                                    yield instruments and
                                    single country equity funds. The latter include funds exposed to, for example, Germany,
                                    Ireland, Australia, Chile, Mexico (2 funds), Korea (3 funds), Singapore, China (4 funds), of
                                    which one is an A-Share fund, Indonesia and Turkey. The sector also includes two
                                    regional Latin American equity funds, offering an alternative option for holders of, for
                                    example, Blackrock Latin American Investment Trust (BRLA.L) which has often attracted
                                    an elevated rating given its relatively unique position in the UK market.

                                    Similarly, though vastly under-represented in the UK trust sector, the US CEF market
                                    offers investors a number of discounted funds exposed to the US equity market – one of
                                    the world’s strongest equity markets in 2011 but one where UK investors have the choice
                                    of just one actively-managed trust in the form of JPMorgan American (JAM.L).
 S&P500 – under-represented in      One has to ask if JAM is so highly rated because of the manager and the benefits
           the UK Trust market      provided by the fund, or simply because of the absence of any real competition in the UK
                                    trust sector. So, for UK investors, some of these US listed funds such as Adams Express
                                    (ADX.N, -16.5% at year end) or the (recently) stronger-performing Tri-Continental Corp
                                    (-15.1%) may offer a more attractive alternative.


2012 – opportunities and risks                                                                                  11 January 2012
27


                                        Delights and dangers
                                        The US CEF market may be new to many of our readers, but that it provides
                                        opportunities that are not often available within the UK market is beyond doubt. It also,
                                        as highlighted above, provides strong complementary advantages to clients, being able to
                                        switch between similar vehicles with similar remits, but where advantages of greater
                                        liquidity, choice and managerial Alpha can, perhaps, be found in the US funds market.

                                        But there are downside risks. Corporate governance levels in the US market remain
    Corporate governance is often
                          poor …        fundamentally weak, though we are optimistic that key shareholders are now robustly
                                        taking up the challenge of improving shareholder welfare. Similarly, the bias towards
                                        high income funds within the US CEF market should always be treated with some
                                        caution. While reporting levels (and standards) have generally improved, many such
      … but key clients are driving     funds are still simply returning capital to shareholders rather than accrued income and
                    improvements        being disproportionately rewarded for doing so. For example, the high-yielding
                                        Cornerstone Total Return (CRF.N) has attracted premiums in excess of 80% during the
                                        last five years – a period in which the capital value of the fund’s NAV has dropped by
                                        almost 70% and the total return on the NAV has been a relatively shallow 17%. So an
                                        80% premium for an annualised NAV total return of 3.2% (and -14.8% on the price)
                                        seems excessive to us to say the least.

                                        Discount to “cash” anyone?
                  Irrationally priced   Federated Enhanced Treasury Income Fund (FTT.N) – US Treasuries were all the rage in
                                        2011 as everyone headed for the “security” provided by this asset class. This has come
                                        despite the minimal and often negative real terms yields on offer and risks to the
                                        downside stemming from the increasingly unbalanced state (re massive state ownership)
                                        of the Treasury market itself. But amid this rush into Treasuries, FTT was left behind,
                                        moving from a 6.4% discount at the start of the year to -12.7% at its close.

                                        At end-November 2011, the fund had 89% of its assets in US Treasuries, 9.9% in US
                                        government MBS and 1.1% cash. The average weighted coupon was a small 3.05% with
                                        the yield on the fund itself standing at 6.3%. Either way, for a “risk-free” asset that in
                                        2010 attracted a premium, we believe this fund offers some true value. And if US
                                        Treasuries are effectively “cash” given the nature and liquidity of the market, we ask why
                                        FTT trades at a near 13% discount?


11 January 2012                                                                                     2012 – opportunities and risks
28


                                    SUMMARY
                                    OUR VIEW OF THE YEAR AHEAD
                                    2012, or at least the first few months, are expected to be characterised by a need to
                                    implement fairly extensive capital protection, minimising downside risk exposure and
                                    avoiding further, government-induced, pitfalls. 2011 provided opportunities for a
                                    decisive change in government policy in the west and these opportunities were sadly not
                                    taken up (despite numerous, “last chance” summits). The end of 2011 also heightened
                                    volatility and closer correlation among asset classes.

  Don’t hide behind the curtains!   This does not mean a lack of opportunities and that clients should overweight cash and
                                    hide behind the curtains! We expect opportunistic and theme-specific events will come to
                                    the fore throughout the year and, increasingly (though not at the start of the year), we
                                    expect key emerging and other asset classes to return to profitability. Cyclical recovery in
                                    emerging markets will happen, though not on the scale seen in the post-Lehman’s era.

                                    We see little point betting against the herd in times of macroeconomic and market
                                    instability, though we advise investors to be nimble and to be prepared to take profits on
                                    a shorter duration than during normalised markets. The most optimistic scenario at this
                                    stage is that corporate profits continue to please on the upside (hence our bias towards
                                    stock-picking managers) and that the global economy muddles through. However, socio
                                    and geo-political risks such as the US election cycle and tensions in the Middle East could
                                    come to the fore, actually superseding concerns at the economic level.


                                    AND TRUSTS
                                    In terms of trusts, we advise continued allocation to higher Alpha and consistent
                                    managers – those with a natural bias towards stock selection rather than indexation and
                                    managers that have seen this cycle before and acted accordingly. Yield will continue to
                                    dominate with interest rates low, but some disappointment may be felt both with the
                                    quality and durability of this yield. We also advocate strong diversification in terms of the
                                    source (sector and fund) of this yield.
       Specific managers provide    Given the economic and market backdrop, discounts have, in many cases, remained
                   opportunities    relatively (if not overly) tight. However, numerous opportunities continue to exist within
                                    the Trust sector and the final weeks of 2011 finally started to throw up some more
                                    exciting (and reflective) risk pricing (though some funds and sectors continue to offer
                                    little on value-adjusted risk/reward basis). The US fund market, in contrast, was
                                    arguably more fully reflective of risk pricing in 2011 and we would strongly urge
                                    investors to make greater use of this space moving forward.

                                    And we now move forward onto a new stage for the trust sector with the implementation
                                    of the long-awaited RDR from the end of the year. This could present significant
                                    opportunities for the sector as a whole and specific funds, but the benefits cannot be
                                    guaranteed and managers, boards and brokers will need to work hard to make the case
                                    for investing in investment trusts.

                                    Wishing you all a very profitable 2012.


2012 – opportunities and risks                                                                                   11 January 2012
29


INVESTMENT TRUST SECTOR – KEY DATA TRENDS 2011

  Selected sector discount spreads (end-2011)                                      Selected sector NAV performance spreads (2011)


  Volume trends (% of funds - 2011 versus 5Y average)                              UK Inc Growth – Spread by capitalisation (£m)


  2011 – Overall trust sector
  •   Cap weighted 1Y trading volume as a % of 5Y average – 88%

  UK Small Cap Trusts –dispersion of % NAV returns (2011)                          Private equity discount trends (5 years)
                                                                                     50.0


                                                                                     30.0


                                                                                     10.0


                                                                                     -10.0


                                                                                     -30.0


                                                                                     -50.0

                                                                                     -70.0
                                                                                             15/12/2006

                                                                                                          15/03/2007

                                                                                                                       15/06/2007

                                                                                                                                    15/09/2007

                                                                                                                                                 15/12/2007

                                                                                                                                                              15/03/2008

                                                                                                                                                                           15/06/2008

                                                                                                                                                                                        15/09/2008

                                                                                                                                                                                                     15/12/2008

                                                                                                                                                                                                                  15/03/2009

                                                                                                                                                                                                                               15/06/2009

                                                                                                                                                                                                                                            15/09/2009

                                                                                                                                                                                                                                                         15/12/2009

                                                                                                                                                                                                                                                                      15/03/2010

                                                                                                                                                                                                                                                                                   15/06/2010

                                                                                                                                                                                                                                                                                                15/09/2010

                                                                                                                                                                                                                                                                                                             15/12/2010

                                                                                                                                                                                                                                                                                                                          15/03/2011

                                                                                                                                                                                                                                                                                                                                       15/06/2011

                                                                                                                                                                                                                                                                                                                                                    15/09/2011

                                                                                                                                                                                                                                                                                                                                                                 15/12/2011


                                                                                                                                                                                                                   Direct                            FofFs


Source: Funddata, Datastream, Canaccord Genuity Limited. Note: past performance does not predict future results.


11 January 2012                                                                                                                                                                                                   2012 – opportunities and risks
30


APPENDIX: IMPORTANT DISCLOSURES
Analyst Certification:-
Each authoring analyst of Canaccord Genuity Limited whose name appears on the front page of this research hereby certifies that (i) the
recommendations and opinions expressed in this research accurately reflect the authoring analyst’s personal, independent and objective views
about any and all of the designated investments or relevant issuers discussed herein that are within such authoring analyst’s coverage universe
and (ii) no part of the authoring analyst’s compensation was, is, or will be, directly or indirectly, related to the specific recommendations or
views expressed by the authoring analyst in the research.
Ratings/Coverage:-
None of the stocks covered in this research are under formal and regular coverage by the analyst nor are they formally rated in accordance
with the Canaccord Genuity Ratings System.
Disclosure and Disclaimer:-
For the purpose of UK regulation Canaccord Genuity Limited produces non-independent research which is a marketing communication under
the FSA Conduct of Business Rules and has not been prepared in accordance with the FSA requirements to promote independence of research
nor is it subject to the prohibition on dealing ahead of the dissemination of investment research. However, Canaccord Genuity Limited does
have procedures in place to manage conflicts which may arise in the production of research, which includes preventing dealing head and
Chinese Wall procedures.
The authoring analysts who are responsible for the preparation of this research are employed by Canaccord Genuity Limited, which is
authorised and regulated by the Financial Services Authority (FSA).
To access the specific company disclosures of relationships and other material interests please refer to
http://www.canaccordgenuity.com/EN/about/Pages/UKDisclosures.aspx
The authoring analysts who are responsible for the preparation of this research have received (or will receive) compensation based upon
(among other factors) the Corporate Finance/Investment Banking revenues and general profits of Canaccord Genuity. However, such authoring
analysts have not received, and will not receive, compensation that is directly based upon or linked to one or more specific Corporate
Finance/Investment Banking activities, or to recommendations contained in the research.
The information contained in this research has been compiled by Canaccord Genuity Limited from sources believed to be reliable, but (with the
exception of the information about Canaccord Genuity) no representation or warranty, express or implied, is made by Canaccord Genuity
Limited, its affiliated companies or any other person as to its fairness, accuracy, completeness or correctness. Canaccord Genuity has not
independently verified the facts, assumptions, and estimates contained herein. All estimates, opinions and other information contained in this
research constitute Canaccord Genuity Limited’s judgement as of the date of this research, are subject to change without notice and are
provided in good faith but without legal responsibility or liability.
Canaccord Genuity salespeople, traders, and other professionals may provide oral or written market commentary or trading strategies to our
clients and our proprietary trading desk that reflect opinions that are contrary to the opinions expressed in this research. Canaccord Genuity’s
affiliates, proprietary trading desk, and investing businesses may make investment decisions that are inconsistent with the recommendations or
views expressed in this research.
This research is provided for information purposes only and does not constitute an offer or solicitation to buy or sell any designated
investments discussed herein in any jurisdiction where such offer or solicitation would be prohibited. As a result, the designated investments
discussed in this research may not be eligible for sale in some jurisdictions. This research is not, and under no circumstances should be
construed as, a solicitation to act as a securities broker or dealer in any jurisdiction by any person or company that is not legally permitted to
carry on the business of a securities broker or dealer in that jurisdiction. This material is prepared for general circulation to clients and does
not have regard to the investment objectives, financial situation or particular needs of any particular person. Investors should obtain advice
based on their own individual circumstances before making an investment decision. To the fullest extent permitted by law, none of Canaccord
Genuity Limited, its affiliated companies or any other person accepts any liability whatsoever for any direct or consequential loss arising from
or relating to any use of the information contained in this research.
For United Kingdom and European Residents
This research is for persons who are Eligible Counterparties or Professional Clients only and is exempt from the general restrictions in section
21 of the Financial Services and Markets Act 2000 (or any analogous legislation) on the communication of invitations or inducements to engage
in investment activity on the grounds that it is being distributed in the United Kingdom only to persons of a kind described in Article 19(5)
(Investment Professionals) and 49(2) (High Net Worth companies, unincorporated associations etc) of the Financial Services and Markets Act
2000 (Financial Promotion) Order 2005 (as amended). It is not intended to be distributed or passed on, directly or indirectly, to any other class
of persons. This material is not for distribution in the United Kingdom or Europe to retail clients, as defined under the rules of the Financial
Services Authority.
For United States Residents
This research is distributed in the United States by the entity that published the research as disclosed on the front page of this report to “major
U.S. institutional investors”, as defined under Rule 15a-6 promulgated under the US Securities Exchange Act of 1934, as amended, and as
interpreted by the staff of the US Securities and Exchange Commission (SEC). Analyst(s) preparing this report are resident outside the United
States and are not associated persons or employees of any US regulated broker-dealer. Therefore the analyst(s) may not be subject to Rule 2711
restrictions on communications with a subject company, public appearances and trading securities held by a research analyst account.
Additional information is available on request.
Copyright © Canaccord Genuity Limited 2012. – Member LSE, authorized and regulated by the Financial Services Authority.
All rights reserved. All material presented in this document, unless specifically indicated otherwise, is under copyright to Canaccord Genuity
Limited. None of the material, nor its content, nor any copy of it, may be altered in any way, or transmitted to or distributed to any other party,
without the prior express written permission of the entities listed above.


 2012 – opportunities and risks                                                                                                11 January 2012
31


11 January 2012   2012 – opportunities and risks
32


Research                          Specialist Sales                       Market Making                      Corporate Finance
Paul Locke                        Nicholas Corke                         Angelo Sofocleous                  Gordon Neilly
+44 20 7050 6709                  +44 20 7050 6546                       +44 20 7050 6547                   +44 20 7050 6778
plocke@canaccordgenuity.com       ncorke@canaccordgenuity.com            asofocleous@canaccordgenuity.com   +44 131 222 9409
                                                                                                            gneilly@canaccordgenuity.com
Analytical support                Andrew Davey                           Andrew Lewis
                                  +44 20 7050 6542                       +44 20 7050 6544                   Sue Inglis
Freddie Solway
                                  adavey@canaccordgenuity.com            alewis@canaccordgenuity.com        +44 20 7050 6779
+44 20 7050 6707
                                                                                                            +44 131 222 9414
fsolway@canaccordgenuity.com
                                                                                                            singlis@canaccordgenuity.com
                                  Chris Whittingslow                     Cheyne Bunnett
                                  +44 20 7050 6528                       +44 20 7050 6545
                                  cwhittingslow@canaccordgenuity.com     cbunnett@canaccordgenuity.com      Rishi Zaveri
                                                                                                            +44 20 7050 6780
                                                                                                            rzaveri@canaccordgenuity.com


                                  Specialist Sales – US
                                  Stephen Davis
                                  +1 617 788 1678
                                  sdavis@canaccordgenuity.com
                                  Marc Loughlin
                                  +1 617 788 1676
                                  mloughlin@canaccordgenuity.com


Vancouver Head office             Toronto                              Calgary                                 Montréal 
P.O. Box 10337 Pacific Centre     BCE Place, 161 Bay Street            TransCanada Tower                       1010, rue Sherbrooke ouest 
2200‐609 Granville Street          Suite 3000, P.O. Box 516            450 1st Street SW Suite 2200            Bureau 1100 
Vancouver, British Columbia       Toronoto Ontario                     Calgary, Alberta                        Montréal, Quebec 
V7Y 1H2                           M5J 2S1                              T2P 5P8                                 H3A 2R7 
1.604.643.7000                    1.416.869.7368                       1.403.508.3800                          1.514.844.5443 
 
London                            Boston                               New York                                San Francisco 
7th Floor, Cardinal Place         99 High Street                       535 Madison Avenue                      101 Montgomery Street 
80 Victoria Street                Suite 1200                            2nd Floor                              Suite 2000 
London, SW1E 5JL                   Boston, MA                          New York, NY                            San Francisco, CA 
44.20.7050.6500                    02110                               10022                                    94104 
                                  1.617.371.3900                       1.212.849.3900                          1.415.229.7171 

2012 forward review - Opportunities & Risks

  • 1.
    Paul Locke Investment Trusts 44.20.7050.6709 plocke@canaccordgenuity.com 2012 – opportunities and risks This is our fourth consecutive annual trust review and it comes after one of the most tumultuous years for the global economy and the pricing of risk assets in a generation. It would be a delight for us to argue the case for a strong rebound in both global growth Inside levels and equity pricing in 2012, but the reality is that, for the west at least, Global snapshot .................................2 structurally, little has changed thus far. Key themes.........................................3 Investment trusts ...............................9 In last year’s review we highlighted three key questions for investors: Overview .......................................... 11 • Can the Euro survive its design flaws? Portfolio strategy ............................. 20 Other stock picks for 2012............. 24 • What will the level of US commitment be to fiscal orthodoxy (and when)? Summary.......................................... 28 • What are the prospects for a soft landing in China? Key data trends for 2011 ............... 29 These questions remain unanswered, which suggests to us continued strong volatility, uncertainty and risk in the coming year. Political incompetence and vacillation has left the global economy floundering, with the risk of renewed recession (or worse) and we think this could continue in 2012 as the US heads further into its election cycle. We have moved from a financial to a sovereign debt crisis and almost back again with a series of band-aid (monetary) policies failing to provide a proper resolution to the key problem of excessive debt and the need for governments and individuals to deleverage. Companies have impressed in taking up the slack against a poor economic backdrop and, in many cases, remain lean and profitable. But, questions remain over forward earnings as Europe in particular heads back into recession. Despite politicians’ inability to grasp the economic nettle, we see grounds for optimism, though this remains on a highly selective asset class and manager-specific basis. We hope to point out some of these potential “winners” and areas to avoid in 2012 and beyond in the following pages. We believe the year ahead offers a number of changes and challenges, not all of which will be negative. It will be a demanding time for trusts, their managers and boards as market uncertainties continue but also as we move towards the introduction of the Retail Distribution Review (RDR) at the year-end. Investors will need to be nimble and selective to profit from the current market environment, but we are of the view that the broader closed-end fund sector remains the best place to generate excess returns. This research note is produced by Canaccord Genuity Limited which is authorized and regulated by the Financial Services Authority (FSA). This is non-independent research and a marketing communication under the FSA Conduct of Business rules. Please see the important disclosures section in the appendix of this note which are an integral part of it or visit http://www.canaccordgenuity.com/EN/about/Pages/UKDisclosures.aspx for more information. 11 January 2012 2012-004
  • 2.
    2 GLOBAL SNAPSHOT Yield dynamics – 10Y yield and % point change Strategy drivers for 2012 • Macro concerns continue to dominate – another difficult year. • Possible collapse or (at minimum) transformation of the Euro – more European QE likely. • Equities – a mixed picture: - Emerging markets start to outperform developed markets from H2. - Low interest rates will continue to reward income – but not all yields are alike. - Markets are not normalised – key thematic drivers and herd mentality will drive profits. • Commodities – risks and opportunities abound, but Key market trends - 2011 drivers will be stock and sector specific: - Risks of a Chinese hard-landing imply continued, sentiment-driven volatility. - Significant opportunities in constrained supply assets (gold, shale gas). - Oil market volatility to intensify – supply not constrained, but political risks are rising (particularly over Iran). • Property – prime assets to continue to drive NAV growth. • Defensive assets will maintain their advantage. • Growing risk of global socio and geo-political unrest – disenfranchised populations carry risk and where next after the Arab spring? Inflation (Current annual rate - %) • Extended recession in the West and risks of rising global protectionism. • Emerging market – monetary easing provides some (but not sufficient) support to global markets. • 2012 pricing suggests an even stronger reliance on QE and corporate earnings to underpin equity growth. Notable elections in 2012 January Egypt & Taiwan February Greece & Yemen March Egypt & Russia (both presidential). Iran April Korea, France (presidential 1st round) May Palestine, France (presidential 2nd round) Budget deficits (% of GDP) June Bahamas, Serbia, France July Mexico, Mali August September Hong Kong Venezuela & Slovenia (both presidential). Ukraine, October Georgia and Lithuania November US & Romania December Korea (presidential) Source for all charts: Canaccord Genuity Limited, Datastream 2012 – opportunities and risks 11 January 2012
  • 3.
    3 KEY THEMES MACRO All aboard If investors thought 2011 was a rollercoaster ride, 2012 risks shaping up to be even more unpredictable. For four years, we have argued that the crisis of the west has been structural in nature rather than cyclical and, therefore, something that can be resolved by a resumption of growth. Many, if not most, structural issues (excess debt and the need for individuals and governments to deleverage) remain fundamentally unresolved, while new distortions in lending, debt and broader financial markets have been created (notably state ownership of its own asset base in the West through newly printed money). Dealing with change A key concept for investors to accept is that the world has changed and continues to change. The crisis of 2008 accelerated this process and we believe the eventual winners could be many of the larger emerging states such as Brazil, India and China. However, this is not guaranteed and these states, along with Russia, the fourth member of the BRIC quartet, have their own problems to overcome in 2012. Therefore, we do not expect a repeat of post-Lehman’s 2008 when China expanded its own balance sheet to support the global economy this time around (or at least not to the same extent). As we have argued previously, however, there is always room for pricing growth in a variety of asset classes. Part of this could be general, supported by still more monetary expansion as the US, Europe and the UK deploy yet more quantitative easing (despite the largely still unproven case for its use thus far). But more likely, in our view, is that investors will have to delve deeper to unearth the pricing gems in 2012, amid a backdrop of sluggish economic growth, heightened fears for corporate earnings and, ultimately, the still strong risk of sovereign and bank sector default. KEY EVENT RISK Below we explore some areas that we see as the key geopolitical and economic risks moving into 2012 and, more crucially, how some anticipated events could be used through exposure to specific funds. Instability in the Middle East Key event risks in 2012 could centre on a number of different but inter-linked points in the Middle East. Public aspirations from the Arab spring of 2011 remain, as yet, almost entirely unsatisfied and further violence should be expected. Where political pluralism of some kind has taken hold, the clear winners have been Islamic-focussed organisations, which is likely to raise concerns in the west, so long the supporter of a number of the region’s autocratic regimes. But the Arab spring has now spread to one of the region’s lynchpin states in Syria and the collapse of the Assad regime carries risks far beyond Syria’s borders, with a likely impact on Iran, Lebanon, Turkey and Israel. Elsewhere, an increasingly fractured Iraq is more and more coming under Iran’s influence (a final humiliation in wake of the Iraq war), while prospects for a strategic military strike against Iran also remain. This may or may not be linked to that country’s nuclear ambitions, or to a growing power struggle from within the Middle East itself. Syria’s collapse could ultimately provide for growing internal divisions within Iran (a second Green revolution, perhaps) while pressures for an oil embargo to be imposed on Iran could spark a more aggressive 11 January 2012 2012 – opportunities and risks
  • 4.
    4 response. Similarly, despite spending billions of dollars on welfare projects in an attempt to placate its own population, discontent within the Shia minority in Saudi Arabia remains and may surface further in 2012. This all has implications for the oil sector. While OPEC has the capacity to raise output (and could have done so already as the most vivid sign of its support for the global economy), an event-driven spike in oil prices, with all its implications for economic well being, cannot be dismissed in 2012. Hard landing in China However, this appears unlikely to us, particularly with the transition in power of much of the political establishment that is due to take place in early 2013. But investors should be prepared for such an eventuality, which could spark (at least in the short term) a potential collapse in commodity pricing, with implications for a vast number of states including the producer states in Latin America as well as Australia and Canada. Once more, we highlight that while attention in recent years has been focussed on Chinese demand as the key underpin for commodities pricing, this ignores fundamental supply factors and any notable correction in pricing should be viewed opportunistically. Chinese authorities have room to ease monetary policy further, though not to the same extent as in 2008. However, we expect the government will, above all else, be keen to oversee a smooth transition to the new political leadership that takes control in 2013, which suggests it will do everything possible to avert any economic hard landing. China – a changing of the guard One of the key changes for 2012 will be the run up to an effective changing of the old guard in China – this after a decade in power. Amid a backdrop of growing structural weakness and imbalance in the Chinese economy, the country is due to replace much of its political leadership in late-2012, for just the fifth time since the revolution and with its new leaders set to rule for the next decade. The Communist Party has already indicated a dramatic shift away from what some say is a failing system of firstly export-led growth and subsequently investment-led expansion. As well as Vice-President Xi Jinping and Vice-Premier Li Keqiang being likely to succeed the current incumbents, President Hu Jintao and PM Wen Jibao effective from the Congress of late-2012 (officially from March 2013), there are due to be significant changes to the higher ranks of the People’s Liberation Army (PLA) as a number of its leading figures reach mandatory retirement. Orderly transition will be the priority, which will include doing everything to ensure continuity in economic well-being for the populace. However, this political accession will also be accompanied by strong economic transition from 2013 onwards and particularly in 2013-15 (external situation allowing) as attempts are made to refocus towards a more consumption-based growth strategy. This will not be easy and perhaps key here will be how the new government reacts to any signs of civil unrest. Sovereign default Arguably, the key western developed states have escaped lightly thus far. With global interest rates low and the emphasis firmly on creative book keeping, debt burdens have been manageable. However, 2013-15 offers one of the largest roll-over periods in history for a number of western economies. With this backdrop, one has to ask whether these highly developed but indebted states could cope with another banking or liquidity crisis. The answer has to be no, but even in the absence of such a crisis, sovereigns face a wall of repayment, excessive debts and a likely increase in financing costs as interest rates eventually rise (or new debt terms are secured). The European authorities have already pushed forward vast sums in the form of a new borrowing facility in a bid to ensure 2012 – opportunities and risks 11 January 2012
  • 5.
    5 monetary stability and minimise risks of a banking crisis. This may actually prove more beneficial, given its specific targeting, than the broad-brush QE approach adopted elsewhere. However, we cannot dismiss the risk of sovereign default and a renewed banking crisis in 2012. Prospects for the other BRICs (and Time has already been called by some on the BRIC phenomenon. However, while we emerging markets) agree that the BRICs face significant problems in H1/12, they again have room to ease monetary policy as the global economy slows. Indian inflation appears increasingly structurally ingrained, which raises concerns, while Russian autocracy looks likely to come under ever greater scrutiny. However, broader trends such as young populations (ex-China where demographic problems will grow), ever expanding credit, mortgage and consumer markets and the sheer dynamics of many emerging market companies appear likely to continue to underpin the BRIC and broader emerging market phenomenon for some time. US elections The US elections will perhaps be the defining event of 2012, as well as just how well the US and global economies cope. Key will be the ability of political figures to rise above the mud-slinging and enact necessary fiscal reforms (or even extend or manage existing legislation). Signs are not positive that this can be achieved, though we see no reasons to be excessively pessimistic at this stage. Much will depend ultimately on the choice of Republican candidate to face President Obama which, as yet, is undecided. Any polarisation of politics does not bode particularly well for strong and decisive legislative action with prospects for either damaging tax cuts on one hand or a failure to rein in spending excess on the other. 11 January 2012 2012 – opportunities and risks
  • 6.
    6 Figure 1: Scenarioanalysis Scenario Key fund exposure Focus/dynamic Capital protection Personal Assets Trust; Premia Personal Assets may not suit all investors with concerns over two Plus key portfolio dynamics – US Treasuries and Gold (some 50% of NAV). Premia Plus will succeed IVPH.L from end-February 2011 and offers a proven methodology through a futures-based allocation model and will provide an original concept for investors in 2012. Chinese hard landing All commodity funds will be hard hit, but indirect exposure will go significantly further. Chinese centred funds and those exposed to producer nations in, for example, Brazil, Australia and Canada could be expected to suffer disproportionately Commodities City Natural Resources High Yield Potential for a shock and continued escalated volatility on Chinese hard landing prospects. Yet key themes such as shale gas/oil and margin growth at gold miners continue to underpin this fund relative to its peers, while M&A activity is also expected to be supportive Cyclical recovery – emerging markets Templeton Emerging Markets. We still advise caution on many emerging market equities in Q1- Q2, but monetary policies are now being eased and the long- term case for the asset class and particular high profile states remains fundamentally intact. Key emerging markets will be the long-term winners of the West’s current crisis. Discount to cash Federated Enhanced Treasury See page 27 Income Fund (FTT.N) Discounted yield Guggenheim Enhanced Equity A covered call fund, GGE strongly outperformed the S&P500 in Strategy (GGE.N) 2011 and more than doubled its yield (to an indicated 7.7%, with 3% from income). Yet this elevated distribution policy has yet to be fully reflected in its discounted rating (-14.5%). Europe Jupiter European Opportunities Positive stock and country allocation with strong management. Inflation protection Western Asset/Claymore Inflation- While UK-listed funds offering “inflation protection” attract linked Opps (WIW.N); Western significant premiums (such as those in the PFI arena), WIW and Asset/Claymore Inflation-linked WIA both attract double-digit discounts, offer yields of circa 4% Secs (WIA.N) and are at least 80% invested in inflation-linked securities and has strongly outperformed the S&P500 in the last 5 years. Innovation & development Biotech Growth Trust A vibrant performer in its own right, BIOG also benefits from accelerated bid activity in the sector, including that for key holding Pharmasset. With cash-rich pharma stocks seeking to buy rather than develop new product lines, we see the potential for further growth in the BIOG NAV. Japan Baillie Gifford Japan Stronger GDP growth prospects as the post-earthquake recovery continues, combined with exceptional stock selection from manager Sarah Whitley. Oil price spike Artemis Alpha; Petroleum & Over one-third of the ATS portfolio is exposed to oil and gas Resources Corp (PEO.N) producers with, markets allowing, still strong upside value to be gained from the present carrying value. PEO’s NAV effectively tracks the DJ Oil & Gas Index and offers a portfolio dominated by names such as Exxon Mobile and Chevron. Property F&C Commercial Property Trust; Continued exposure to prime assets is recommended, at least in ISIS Property Trust H1/12. Strong and proven managers at F&C REIT, with IPT also commanding a significantly higher yield than the sector average. Yield differentiation New City High Yield; Middlefield Proven manager with an exceptional track record in active Canadian Income portfolio management, NCYF offers both a more durable and differentiated source of yield (for MCT see page 24). Source: Canaccord Genuity Limited The death of North Korean leader Kim Jong-il in December 2011 threw another potential Korean peninsular – death of a ‘hand grenade’ into the global mix. Jong-il’s death and his succession by his third son, dictator Kim Jong-un, raises the prospect of heightened political uncertainty, both internally and regionally. Succession planning in North Korea has been underway since Kim Jong-il suffered a stroke in late-2008. However, the late nature of Jong-un’s move to become the preferred 2012 – opportunities and risks 11 January 2012
  • 7.
    7 successor over his two older brothers, together with the young General’s (as he has been termed) lack of experience, suggests his powerbase is likely to be immature and underdeveloped. This latest succession, therefore, suggests an expanded role for the military, at least in the short term. External powers are also likely to seek to raise their influence in coming months, particularly China. However, prospects for a Korean version of the Arab spring seem small in such an isolated state and, more likely, is a scenario of rising regional tensions in the broader Korean peninsular. A shift towards protectionism Perhaps one of the greatest triumphs of 2011 was the lack of protectionism or new trade barriers that are often erected opportunistically during a period of global economic crisis by politicians threatened by their own inadequacies to cope with that crisis. This does not mean they will not come, however, and an extended period of stagnation or renewed recession in the west would dramatically increase the likelihood of an escalation in trade tensions and the imposition of punitive sanctions by certain states. ON A BRIGHTER NOTE … The most favourable scenarios for 2012 generally point to a further year of muddling through for the global economy with the possibility (though not probability) of a surprise on the upside for global growth given that sentiment is so weak. Investors may also benefit from a herd mentality in following the continued risk-on, risk-off movements and close correlations of major asset classes in Q1 in particular. But, we recommend being quick to take profits on both sectors and outperforming stocks. In terms of governmental support, key will be to watch for further supportive action from the world’s monetary authorities, which equity markets have generally lapped up during the last two years. However, the risk here is that the drug of monetary stimulus will begin to wear off and the resultant equity highs will be less frequent and less euphoric. Corporate earnings We think this may be the biggest determinant of equity movements in 2012 – just how well earnings growth performs both in absolute terms and relative to expectations. Apart from governments’ continued support of risk assets through monetary expansion, it has been the broad health of company balance sheets that has maintained equity expansion in recent years. While we expect this to continue in a number of areas (defensives, gold producers, emerging market consumption plays, innovative technologies), strong focus should be paid to first quarter earnings in particular and to the durability of income streams in order to determine just how well companies are performing, this as Europe and, possibly thereafter, the US head back into flat growth or outright recession. H2 revival in emerging markets Many emerging markets are now at the top of their previous tightening cycle and some, including China and Brazil, have already been cutting interest rates as their economies slow. Inflation remains relatively entrenched in states such as India and Turkey (the latter offering the risk of another hard landing) and we advise caution. However, expectations are that a renewed loosening of policy during 2012 will provide support to equities. The underperformance of emerging market equities in 2011 was perhaps not surprising given their strong recovery since the post-Lehman’s era. However, we regard the asset class strongly from both a top-down and bottom-up perspective, with an emphasis firmly on managers with a bias towards stock selection rather than index replication. 11 January 2012 2012 – opportunities and risks
  • 8.
    8 Event specific Events such as the Queen’s Diamond Jubilee (June) and the London Olympics (July- August) should not be entirely dismissed and they offer potential upside to UK-focussed equities and other asset classes in 2012. Specific analysis of the benefits of major events on stock markets is relatively limited and, of course, gains have already been derived by London and the broader UK during the construction and build-out process. However, we think additional tourism and consumption are likely to benefit key stocks in 2012. … AND MICRO We see two defining risks in the year ahead – the risk that corporate fundamentals, having been so strong in recent years, could disappoint as economies weaken once more and, secondly, the imposition of ever more restrictive regulation. Of course, the idea of tighter regulation in, for example, the banking sector, is to create a Excessive regulation carries risks more efficient and secure system. However, risks remain that inadequate steps will merely delay not prevent a renewed banking crisis, while excessively restrictive and hurried laws could prompt both a further decline in lending and, as we have already seen, threats by major institutions to relocate. But not all legislation is negative. After all, 31 December 2012 will see the But RDR provides the Trust world implementation of the FSA’s Retail Distribution Review (RDR), initially launched in 2006 with opportunities as a means of improving training of financial advisers and raising the transparency and fairness in the fee charging system. 2012 could, therefore, be a pivotal year for the entire investment trust sector. Will trusts themselves be sufficiently well prepared to access the distribution platforms? Which funds or groups will benefit most? And, will independent advisors be sufficiently well versed in the often esoteric workings of the trust sector? 2012 – opportunities and risks 11 January 2012
  • 9.
    9 INVESTMENT TRUSTS TRENDS IN PRICING … At the end of 2011, the average, cap-weighted discount for the trust sector had barely changed over that for the corresponding period of 2010, reaching 10.9% against 10.5% for end-2010. However, this masked significant changes in the ratings applied to both specific sub-sectors and, of course, individual funds. Yield continues to dominate The search for yield remained a dominant feature with income funds often rewarded pricing with elevated ratings. Risk perception also prompted a notable de-rating of certain asset classes, including property and private equity. This slippage in discounts was often accompanied by little regard for some strong individual performances and increasingly active attempts by at least some of these funds to buttress shareholder value. Such diverse trends in pricing were exacerbated by the August 2011 sell-off in equities. Many sectors experienced widening discounts in this period, with the exception of areas such as UK Income Growth sheltered by a stronger retail shareholder base and the allure offered by a headline yield. Figure 2: Sector discount/12-month NAV performance trends (end-2011) 35.0 0.0 25.0 -10.0 15.0 5.0 -20.0 -5.0 -30.0 -15.0 -40.0 -25.0 Discount (LHS) 12 mth NAV perf (RHS) -50.0 -35.0 Technology/Media Sector Specialist: Property Sector Specialist: Property Private Equity - Fund of Funds Sector Specialist: Property Asia Pacific ex Japan - Income Global - Growth & Income UK - Income Growth Global/Overseas Growth UK - Growth UK - Mid Cap UK - High Income Biotechnology/Pharmaceuticals Emerging Markets - India Asia Pacific - inc Japan Private Equity - Direct Global - Fund of Funds Japan - Smaller Company Emerging Markets - China UK - Small Cap Asia Pacific ex Japan - Smaller Asia Pacific ex Japan - General Sector Specialist: US - General Sector Specialist: Commodities Japan - General Europe - General Europe - Smaller Companies US - Smaller Companies Weighted Average Emerging Markets - Global Sector Specialist: Environmental (Direct - Europe) & Natural Resources (Direct - UK) Sector Specialist: (Equity) Companies Source: Canaccord Genuity Limited, Datastream. Note: past performance does not predict future results … AND PERFORMANCE Some performance goes Canaccord’s NAV performance analysis of major funds in 2011 throws up a number of unrewarded interesting trends. First is the sharp outperformance of private equity as an asset class, with private equity trusts comprising nine of the top ten performing trusts during the year. 11 January 2012 2012 – opportunities and risks
  • 10.
    10 Cynics may argue that this is merely a continued base effect from the post-Lehman’s low or that valuations and pricing, in line with global equity markets, are at risk of coming off once more, making 2011’s performance illusory and temporary. Canaccord would strongly disagree. The sector has moved on. Specific funds such as Princess, Dunedin Enterprise and, more recently, SVG Capital, have announced shareholder-friendly actions including the return of capital to investors. Others such as F&C Private Equity (FPEO) have continued to pursue a relatively uninterrupted programme of enhanced value realisations despite a still weak economic and market backdrop. While risks do remain, particularly regarding the valuations of specific portfolios, it is our view that those with conservative pricing models such as FPEO actually offer shareholders a relatively high level of downside protection, particularly at current levels of discount. Figure 3: Key investment trusts Top 10 performers by NAV (TR) Bottom 10 performers by NAV (TR) Source: Datastream, Canaccord Genuity Limited. Note: this excludes a number of smaller UK-listed vehicles. Past performance does not predict future results A temporary slip in performance? Sectors that dominated the underperformers in 2011 were the emerging market and commodity funds. Once more, this phase of underperformance should be put in context of the previous sharp rise in values in the preceding 2-3 years. Indeed, the weighted average NAV decline of 17.1% for the emerging market trusts in 2011 means the three- year growth rate was reduced to a still robust 83.8%. Similarly, taken over the last decade and even allowing for the slump in 2008, the MSCI Emerging Market Index still rose by 265% in the decade to end-2011, an almost eight-fold increase on that for the S&P500. Other key underperformers in 2001 included SR Europe and Aurora, though these reflected a far higher degree of fund-specific and stock selection weakness rather than soft markets alone. Biotech stars in NAV terms By sector, the leading performer in NAV terms in 2011 was the small Biotech/Pharma sector, with the private equity fund of funds and property sectors not far behind. At the other end of the scale, the largest losses occurred in the Indian and Chinese fund sectors, with drops of over 30% in NAV over the year. 2012 – opportunities and risks 11 January 2012
  • 11.
    11 OVERVIEW • Yield – not all income is equal • Board-led activity – not a great start • Alliance Trust – a year of change • RDR – hard work ahead to maximise benefits Highlights of the year ahead In this year’s review, we highlight a number of themes that we regard as appropriate, both historically and looking forward into 2012. The world can look forward to a number of key events in 2012 including the 18 National Congress of the Communist Party of th China, and the subsequent transition of power within the ruling elite for the first time in a decade. We also have the US Presidential and legislative elections, the London Olympics, the Queen’s Diamond Jubilee and, in the trust world, the final push to financial equilibrium as RDR comes into effect from the start of 2013. In last year’s review, we highlighted the persistence in underperformance across elements of the trust sector, arguing in favour of greater elasticity in the movement of funds between management groups for perpetually underperforming managers and that Lacking imagination? the “solution to such persistence in underperformance must lie with boards, managers and, of course, shareholders”. We also argued that Discount Control Mechanisms (DCMs), while useful as part of a wider armoury will not resolve issues such as relentless weakness in relative NAV performance and that boards must become more imaginative in the way they approach change in order to protect and enhance value for the shareholders they represent. This year, we continue this theme in part with one of the Global Growth sector’s weakest performers of the last five years, Alliance Trust (ATST.L), which in 2011 initiated its first, democratically accessible DCM. We ask whether this actively applied DCM has added value for shareholders and whether we can expect more of the same in 2012. Yield dynamics – how well do We also look into the effects of dividends on a fund’s profile. Yield has come to dominate trusts stack up? discount pricing in an era of exceptionally low interest rates. But this raises as many questions as it answers. For example, while many trusts amplify the impact of a consistently rising nominal dividend, often over many decades, just how many funds are fully maintaining the value of these dividends against a backdrop of often significant inflationary pressures? 11 January 2012 2012 – opportunities and risks
  • 12.
    12 YIELD - ALL INCOME IS NOT NECESSARILY EQUAL If there has been one dominant, even overriding, theme in the trust world in recent years, Interest rates to stay low for some it has been that of income. This is not surprising in an environment of both heightened time yet uncertainty and historically low interest rates, with both the US Federal Reserve and the Bank of England having already signalled their intent to keep rates low for the next two years. Almost all fund launches and secondary market issues in 2011 had a strong income theme, while ratings of higher-yielding trusts also remained relatively high and seemingly protected. However, a high headline yield does not necessarily translate into a good deal for investors. Indeed, shareholders will have to be increasingly savvy in the year ahead to ensure their dividend flow is not disrupted (at the stock or sector-specific level) or that the benefits of this yield are not offset by a variety of other factors. Three- year figures look good … In this report we seek to analyse some of the attributes offered by higher yielding funds in recent years to determine if elevated pricing has, in effect, been worthwhile. As shown in the graphic below, on a three-year basis many high-yielding funds have delivered exceptional NAV returns, far beyond those offered by government debt. And many of these funds have been rewarded for these profiles, with elevated, often premium, ratings. Figure 4: Selected funds - yield relative to NAV total return (three years) Source: Funddata, Canaccord Genuity Limited However, over 12 months the picture looks different, with many funds that often retained … but shorter-term dynamics raise elevated ratings delivering a poor showing in terms of overall NAV returns. Yet this questions disparity in return profile was not always reflected in weaker pricing levels, with the glamour of a high headline yield often underpinning prices despite evident weakness and, in some cases, often strong losses on the capital side. This has begun to change, however, with heightened market volatility in the final quarter of 2011 prompting de-ratings on high-yielding funds such as TR Property Trust (TRY.L). We also saw other, even premium-rated yield plays such as Henderson Far East Income (HFEL) and Blackrock Commodities Income (BRCI.L) move back into discount territory (albeit at marginal 2012 – opportunities and risks 11 January 2012
  • 13.
    13 levels). In these cases, market pricing finally began differentiating between not just a high headline yield, but the broader dynamics of an often poor total return profile offered by at least some of these funds. Figure 5: Selected funds - yield relative to NAV total return (12 months) Source: Funddata, Canaccord Genuity Limited One further dynamic that we believe investors should increasingly take on board is the And what about inflation? current and future rate of inflation, as rising prices necessarily eat into or erode the value of a fund’s dividend income, particularly if growth in this income is not fully maintained. This is particularly pertinent going forward as central banks seem keen to foster even higher price pressures in order to monetise debt. Indeed, the priority is on loose and even highly expansionary monetary policy to support growth (almost at any cost) with pricing pressures that do exist (now and in future) of secondary concern to many governments. So where do the yields of many of our income-based funds feature relative to current levels of inflation? As can be seen in the chart below, many UK-listed funds fare poorly. Indeed, not only have many incurred capital losses over the last year, they also feature a headline yield that is below the current rate of UK inflation, offering, therefore, far more than investors would be able to generate from keeping their money in the bank, but a real terms contraction nonetheless. If UK inflation were to persist at these levels, therefore, it is not just the headline yield that is important, but the real terms adjusted level of payment and, of course, the rate of forward growth likely to be achieved in a given fund’s future dividend stream. 11 January 2012 2012 – opportunities and risks
  • 14.
    14 Figure 6: Selectedincome-focused trusts – yield relative to UK inflation Source: Canaccord Genuity Limited, Datastream Yield growth – the real dynamic? Dividend growth disappoints Much is often made in the trust sector of funds having delivered dividend growth for extended periods, often stretching into many decades. Significantly less emphasis is placed on the actual rate of dividend growth that has been delivered during these years. However, surely a real test of Distribution of yield growth by fund (5 year, % of total) the vibrancy of a manager’s performance is the willingness to share those benefits with the fund’s shareholders, through both Alpha delivery and dividend growth. But dividend expansion within the trust sector over the last five years has been Source: Funddata, Canaccord Genuity Limited disappointing to say the least. There are, of course, exceptions, with funds such as City Natural Resources High Yield (CYN.L,) having delivered a doubling of its dividend in the last five years, only to see its headline yield diluted by the even more dynamic rise in the share price and NAV. Inflation-adjusted dividend growth But we find the overall picture disappointing in terms of the ability of many funds to is even weaker expand their payout ratios at a decent rate over time. Now, of course, many of these funds do not even claim to have a progressive dividend policy: they are growth-orientated 2012 – opportunities and risks 11 January 2012
  • 15.
    15 and this should be taken on board. However, Canaccord analysis using an annualised rate of dividend growth for the last five years for 435 London-listed trusts reveals that a staggered 71.7% had either failed to implement any annualised increase over this five- year period or had actually experienced a contraction in their dividend payments (perhaps temporary, but a cut nonetheless). Only 28.3%, or less than one-third of trusts, experienced an annualised growth rate in their dividend over this extended five-year period under review. Yet while this may be Inflation adjusted yield growth (5 year, % of funds) disappointing in its own right, a pure expansion or contraction in dividend growth rates does not tell the entire story. Over this five-year period, inflation in the UK averaged an annualised 3.23% or a cumulative 17.2%. Now this, to the shareholder at Source: Funddata, Canaccord Genuity Limited. least, should represent a natural level of dividend growth required for the level of their income to stand still. However, when adjusted on this basis, the percentage of funds that have delivered sub-inflation growth in their five- year annualised dividend rate rose to 78.6%, with only 21.4% of LSE listed trusts managing to grow their dividend at a level in excess of the cumulative rate of UK inflation in this period. Closer scrutiny of yield dynamics is In summary, we suggest that rather than looking at the headline yield, investors need to needed delve far deeper, looking at the level and consistency of capital growth achieved by a particular manager (as this is highly complementary to any dividend payment) and the rate of growth in dividend that has and is expected to be obtained from a particular fund. BOARD-LED ACTIVITY - NOT A GREAT START How active were boards in 2011? In our 2011 forward review, we argued that persistence in NAV underperformance had become endemic in some areas of the trust sector and that Discount Control Mechanisms (DCMs) had, in some respects, simply perpetuated such underperformance. We also stated that we believed the sector lacked the “elasticity in movement” and that the answer “cannot be with yet more buybacks or tenders and removing capital from the Trust market. The answer has to be with board and investors becoming more proactive in moving assets elsewhere”. Not very is the answer! Did this prove to be the case in 2011? The short answer has to be no. We did not see any dramatic upsurge in boards seeking to move assets from perpetual underperformers to higher Alpha managers or from overpopulated sectors to areas that are vastly under- represented (such as mainstream US equities). 11 January 2012 2012 – opportunities and risks
  • 16.
    16 Funds came and went in 2011. Notable casualties included Anglo & Selected trust sectors by capitalisation Overseas plc and Electric & General (£m) Investment Trust, though assets were not retained within the trust sector by initiating something new or innovative – a move to an asset class or manager that investors wanted and would perhaps appreciate more (and price accordingly). Separately, 2011 saw one trust move away entirely from its previously tight DCM. Gartmore European (now Henderson Source: AIC European Focus Trust) having seen its capitalisation slip from over £400 million to under £90 million, changed tack on its DCM, investment remit and approach – this to effectively prevent a further death of a thousand cuts. While the board of Gartmore European decided to abandon a rigid system to prevent the fund moving to an illiquid rump, contrast this with Alliance Trust – which moved from perennially denying the use of buybacks to become one of its greatest advocates, at least during 2011. STS board deserves all the praise We would argue that the most rewarding, board-led move in the trust sector in 2011 was that of Securities Trust of Discount trends, STS versus 12-month average Scotland (STS.L). The fund 6 had long struggled in the UK 4 Income Growth sector with a 2 comparatively low level of 0 reserves and a surplus of -2 peers, with the board -4 -6 therefore making the decision -8 to move the fund to the Global -10 Growth & Income sector. A 09/02/2011 09/04/2011 09/05/2011 09/06/2011 09/08/2011 09/09/2011 09/11/2011 09/12/2011 09/12/2010 09/01/2011 09/03/2011 09/07/2011 09/10/2011 simultaneous change in fund manager (while staying at STS Ave Martin Currie) provided a Source: Canaccord Genuity Limited, Datastream further fillip, with the move welcomed by the market with a shift to a premium rating. STS has since this period sustained a good initial performance in its new home, outperforming many of its counterparts, albeit over a very short time. A new style of product from Other changes were also apparent. Invista Foundation Property Trust has moved to the Invesco stewardship of Schroders, while perhaps more exciting is the change in Invesco Perpetual Select’s Hedge Fund class to that of a conceptually new (for the trust sector), long-only model operated by the group’s Premia Plus team in Atlanta. Canaccord met with this team in late-2011 and we believe it offers a differentiated model from the Fund of Hedge Funds grouping, with a strong record in terms of minimising drawdowns (thereby enhancing overall returns) and this against a backdrop of full asset liquidity and no costly 2012 – opportunities and risks 11 January 2012
  • 17.
    17 lock-ins. The transfer of this asset class does not officially take place until February 2012, although we are optimistic it will offer shareholders something different and strong, particularly amid the wild market swings we have seen in 2011 and expect to see once more in 2012. But, unfortunately, that was about it. 2011 was not a year in which boards sought to rejuvenate or rapidly improve the foundations of many poorly performing funds, with the perpetuation of underperformance for another year at least. Boards may look to the volatility of markets in 2011 as good reason to sit tight, but ultimately the sector needs to reward strong-performing managers (which it does to a reasonable degree) and penalise those that consistently fail to deliver (which it often fails to do). Perhaps 2012 will see a more proactive response from boards. However, at present, truly imaginative board initiatives remain in relatively short supply with the use of share buybacks, the occasional tender or open-ending remaining the preferred options to take. ALLIANCE TRUST - A YEAR OF CHANGE … … but did shareholders truly benefit? A new kid on the buyback block Perhaps one of the most dramatic events of 2011 was the shift in corporate governance by the previously reticent Alliance Trust in finally enacting a fully democratic share buyback policy. This contrasted with the fund’s previously somewhat shallow (just two repurchases) and highly selective (favouring specific shareholders) repurchase system. The move was dramatic. Some 10.25% of the fund’s share capital has disappeared since February, with a massive 67.76 million shares repurchased and cancelled. This enhanced the NAV for those that remain by an estimated 6.48p per share (or just over 7p when calculated on a cum-income basis), with the fund’s discount moving from 16.2% at the start of the year to 14.9% at its close. Unleashing the big bazooka So superficially, at least, the repurchase programme has not materially enhanced the NAV or provided significant levels of discount compression. ATST certainly used its “big bazooka” in 2011 and it could be argued that with holders of 10.2% of shares seeking an exit in the first year of the programme (this, remember, at still strong levels of discount), such a buyback system was needed. After all, without the company buying in its own shares so extensively and if the secondary market alone had been used to satisfy those shareholders seeking an exit, the fund’s discount would have been substantially wider. Yet even with this sizeable chunk of the fund’s shares repurchased and cancelled, questions remain over the validity of the programme notably for the following reasons: • Those shareholders seeking change have not exited the fund. • Enhancement to the NAV has, arguably, been marginal. • No sign as yet of closure in demand by those shareholders seeking an exit. • NAV performance, the real dynamic behind ATST’s wide discount, shows few material signs of improvement. Share buybacks have become the norm and often the first port of call rather than a “tool in the investment trust box” in recent years. This, we believe (and as we highlighted in last year’s forward review), could prove detrimental to long-term shareholders in the sector as liquidity shrinks still further. 11 January 2012 2012 – opportunities and risks
  • 18.
    18 Figure 7: Alliance Trust – monthly share buyback analysis Source: Funddata, Bloomberg, Canaccord Genuity Limited ATST has been late to the party in terms of introducing a widely accessible buyback programme, but the inherent problems the fund faced prior to its adoption remain intractably in place – performance. There are simply too many far better performing vehicles out there for investors to choose from. Are share buybacks enough? Despite the fund’s shrinkage in 2011, it remains at a sustained 5.5% discount to its peers in the Global Growth sector (against 6.9% at the end of 2010). One could argue that this discount would have been significantly higher in the absence of the new DCM, yet the reality remains that ATST’s problems of persistent underperformance, and discounted pricing (to its peers), will not go away if another 70 million shares (or more) were to be cancelled in 2012 as well. RDR could disproportionately One glimmer of light for ATST is perhaps the commencement of the Retail Distribution benefit ATST Review (RDR) from the start of 2013. Given the fund’s size, marketing capacity and existing positioning within the retail market, as well as the presence of its own RDR- ready platform, it should be among the main beneficiaries of the expected increase in retail demand for trusts as discrimination in the broader funds market is removed. What percentage of the still potentially sizeable slack in institutional demand seeking an exit from ATST can be offset by higher, RDR-based retail purchases? Only time will tell. RDR - MAXIMISING THE BENEFITS 2012 should prove a pivotal year for funds as we move towards the introduction of RDR from 31 December. Will RDR provide a huge surge in new client demand? Probably not, but it should be welcomed nonetheless, with far too much emphasis placed on share repurchases in recent years rather than attracting new clients into the sector. Brokers have gorged themselves on share buybacks in recent years, but the question remains as to whether this has really delivered a more vibrant and accurately priced investment trust sector, Again, the answer is probably no, but what we have now is the opportunity for the sector to offer itself to retail clients and their advisors on a level playing field and for this new source of client demand to be brought into what remains a 2012 – opportunities and risks 11 January 2012
  • 19.
    19 fundamentally attractive means of accessing global risk assets and high quality managers (this on a long-term basis without liquidity call interruptions). Branded names the main RDR by its nature is likely to favour those bigger franchises within the investment trust beneficiaries at the outset sector – well known and branded management houses and the larger capitalised, relatively mainstream funds. With interest rates remaining low and gains from RDR obviously biased towards the retail client, initial attention is also expected to be focussed on higher-yielding, mainstream funds rather than those at the more esoteric end of the trust spectrum. Funds such as Alliance Trust should also benefit from the outset with its own RDR-compliant platform, while pressure will intensify for other funds to maximise their presence within the existing platform system. This market is dominated by highly interactive and all-encompassing platforms operated by CoFunds (multiple owners), FundsNetwork (managed by Fidelity) and Skandia Group’s platform. These platforms offer advisors a one-stop shop for all their pricing, trading and settlement needs as well as the usual variety of product packaging or wrapping options under which such investments are ultimately held (SIPPs, ISAs etc). According to the AIC, these three platforms currently account for 70% of the £164 billion platform market, with CoFunds alone claiming a 26% market share. A cursory glance at the websites of these groups reveals little information on the trust sector or individual trusts at this stage, which is not surprising as they do not presently offer investment companies. However, to get off the ground running, it will be crucial for trusts, their boards and their brokers to access these existing distribution networks in order to maximise potential interest in the shortest possible time. Overall, RDR should be welcomed We believe RDR should be welcomed, with the long-term bias by financial advisors to higher fee-paying unit trusts set to be consigned to history. This does, however, create its own problems that will have to be overcome. The uplift in potential demand created by RDR will not necessarily be smooth or equally spread. Individual trusts will have to fight hard to establish themselves both with the platform providers and the broader advisor community. Similarly, explanation of the benefits (and risks) of investing in investment trusts will be required. Joe Public may not take kindly to being told that while their investment had outperformed the market, they had actually lost money due to a notable widening of the fund’s discount. Other key features that will assist trusts in terms of maximising upside gains from RDR will probably include a low TER and plain structure. This is perhaps understandable but a shame nonetheless. Indeed, rather than the main beneficiaries of RDR in the trust world being those funds, as is presently anticipated, from the big houses and with a greater index bias and often little managerial added-value, the real gems to be found in the trust sector are those that provide something different from the norm and where the manager is allowed to add true value. 11 January 2012 2012 – opportunities and risks
  • 20.
    20 PORTFOLIO STRATEGY Introduction Cautious in H1/12 We retain a cautious outlook on global equities, particularly in the first half of 2012. Macroeconomic uncertainties persist and concerns remain over the durability of momentum in corporate earnings. Underlying companies have proved resilient post- 2008, yet earnings downgrades appear to be accelerating as economic activity dampens still further. And if this materialises, markets do not necessarily look that cheap. However, our expectations are for an accelerated growth profile for certain asset classes, perhaps from end-Q1 but most likely from mid-2012, as emerging markets undertake an accelerated monetary easing and China, in particular, deploys strategies that are more accommodating in terms of forward asset growth. Indeed, it could be argued that while severe macro imbalances remain to be addressed, these could be superseded by strong socio or geo-political risks during 2012. While sovereign risks have certainly not gone away, tensions, particularly in the Middle East and South East Asia, could come to the fore in 2012 – a case of the global economy muddling through and being overtaken in importance by events elsewhere. Global equities The concept of wealth protection should therefore be a priority for investors, particularly in the first quarter of 2012. This suggests investors may be wise to take a short-term allocation to funds such as Personal Assets (PNL.L). However, with almost 50% of assets, allocated to global bonds and gold this, of course, carries its own risk dynamic. This could take the form of a sharper upturn in global growth than expected (unlikely) or a more pronounced decline in sentiment towards the increasingly distorted US Treasury market (expected to materialise at some point). For those that believe US Treasuries will retain their shine and defensive attributes, we would allocate capital to Federated Enhanced Treasury Income Fund (FTT.N). At end- November 2011, this US-listed vehicle had 90% of its assets invested in US Treasuries or cash, with just less than 10% in government agency MBS’s, yet attracted a 13% discount. Elsewhere, we continue to favour strong, stock-picking managers rather than quasi trackers, with thematic or stock-specific earnings momentum (or protection) ultimately set to be rewarded. In this respect, we continue to favour allocations to the distinctive management skills offered by, for example, Bruce Stout at the currently more defensive Murray International (MYI.L) and, for longer-term investors, Michael MacPhee and Gerald Smith at Mid Wynd (MWY.L) and Monks (MNKS.L) respectively. Commodities Concerns over a hard landing in China and the growing correlation of many asset classes (including Gold with equities) led to a sharp fall in equity pricing in this sector from April 2011 onwards, with the average, market cap weighted drop in NAV among the commodity trusts reaching 23.1% for the year as a whole. This is disappointing but, perhaps, not surprising given the run up in pricing seen since late-2008 with, for example, the NAV of City Natural Resource High Yield (CYN.L) rising a staggering 270% from October 2008 to end-2011 or almost 4.5 times the level of return achieved on the FTSE100 over the same period. A combination of resource scarcity (in certain areas), high margins and new thematic drivers (shale gas in Europe, for example), continue to underpin our optimism for (highly 2012 – opportunities and risks 11 January 2012
  • 21.
    21 selective) areas of the sector. However, we advise caution in Q1/12, with little discrimination between various sub-asset classes and concerns over the health of the Chinese economy merely set to produce intense levels of volatility. However, we do not share concerns that China is moving towards a hard landing, while cash-rich corporates eager to access new supply chains are likely to underpin further growth in the M&A market. Again, underlying market dynamics favour a more selective rather than broad- brush approach and, as a result, we continue to favour City Natural Resource High Yield as the best means of accessing the commodities space. Smaller companies Last year, we asked whether the time had come again for smaller companies. Growing risk aversion over 2011 suggested this was not the case, with the FTSE Small Cap Index falling almost 15% over the year, against a drop of just 5.5% for the FTSE100. Simultaneously, discount pricing on smaller company trusts widened from an average of 14% to 18%. Part of the reasoning behind our prognosis last year was that the long-awaited and required consolidation of the smaller company space had finally taken place, leaving investors with a leaner, fitter, but still diverse, selection of funds. While further consolidation appears likely, we take comfort from the performance of Strategic Equity Capital (SEC.L) and Montanaro UK Smaller Companies Trust (MTU.L), which finished in first and second place respectively in terms of NAV performance in 2011. Both also comfortably beat the FTSE Small Cap ex-ICs Index for the year as well as the FTSE100. We remain positive on both of these funds in 2012, each for their own, slightly different, reasons. SEC’s development of its portfolio continues apace and this is now a nicely maturing basket of individual stocks, often now paying dividends and achieving growth and therefore finally being credited with the pricing we believe it deserves. We cannot say the same for SEC – a fund not only offering one of the tightest DCMs in the broader trust sector, but also a NAV performance rating within its peer group of first and third respectively over both one and three years (this with a three-year NAV return of over 140%). Therefore, we hope and anticipate that SEC’s managers will be more appropriately rewarded by the market in 2012. MTU also continues to perform well, benefitting greatly from the manager’s consistent approach and the stock selection skills of the broader team. By using a highly targeted and internally-driven method of stock selection and investing only in profitable companies, MTU offers shareholders strong assurances in a period of intense volatility. Yet once again, MTU stands at a discount to the small-cap sector despite having generated a similar NAV return to that of the often premium-rated Standard Life UK Smaller Companies Trust (SLS.L) over both one and three years. Emerging markets In July 2010, we argued specifically in relation to Asian equities, that “irrational enthusiasm” and growing global cross winds suggested that the “market may be reaching a short-term top or a stage at which such exuberance may be quickly followed by disappointment”. The region, as measured by the MSCI Asia ex-Japan index, has dramatically underperformed the S&P500 and FTSE100 since this period providing, of course, natural disappointment for investors. Concerns remain that certain weaknesses within Asia (such as high inflation in India) are becoming more structural than cyclical in nature. However, in broad terms, we continue to favour both Asia and the broader emerging market sphere and underperformance, 11 January 2012 2012 – opportunities and risks
  • 22.
    22 particularly since August 2011 needs to be set against the dramatic rise in equity pricing that once again followed the post-Lehman’s lows. We expect further weakness in the early stages of 2012 but see the next six months as a period of accumulation on the dips and any widening in accompanying trust discounts. Caution is advised on key states – potential overheating in Turkey, risks of a hard landing in China – but the asset class contains some of the world’s most vibrant and (now) increasingly attractively priced companies. Similarly, demographic changes and shifts in middle class consumption patterns and product demand offer strong opportunities to longer-term investors. As such, while we view 2012 as likely to continue to provide some volatility in the asset class (particularly in H1), we are of the view that prospects for the next decade remain excellent. We believe short-term risks suggest a need for wider pricing on our previously favoured Aberdeen Asian Smaller Cos (AAS.L) and that discounts on the emerging generalist trusts are also uncomfortably tight given anticipated risks in H1/12. However, the Asian generalist trusts are looking increasingly attractive and we favour allocations to strong, stock-picking funds such as Aberdeen New Dawn (ABD.L) and Edinburgh Dragon (EFM.L) in the year ahead. Fidelity Asian Values’ (FAS.L) currently higher exposure to the Korean market should be noted by investors as a potential key point of both upside and downside risk. For those seeking broader global exposure to emerging markets and stock-specific rather than index-based Alpha, we would recommend exposure to funds such as Scottish Mortgage (SMT.L), Monks (MNKS.L) and Mid Wynd (MWY.L). Each of these funds has 30%+ allocated to the asset class, on a highly selective, stock-specific basis rather than through simple index exposure. For those looking for an uptick in emerging market pricing after the weakness of 2011, but within the confines of a broader allocation and often at more attractive pricing levels, these funds appear to tick a number of boxes. Private equity In a period of intense volatility and uncertainty, many private equity funds generated positive and signifcant returns in Discount trends – Private equity funds (2011) 2011 and should be congratulated for doing so. The 50.0 sector also witnssed notable 30.0 improvments with the adoption 10.0 of shareholder-friendly policies -10.0 such as accelerated returns of capital (from realisations), -30.0 tenders and buybacks, with -50.0 funds such as Dunedin -70.0 Enterprise (DNE.L), Princess 1 5 /1 2 /2 0 0 6 1 5 /0 3 /2 0 0 7 1 5 /0 6 /2 0 0 7 1 5 /0 9 /2 0 0 7 1 5 /1 2 /2 0 0 7 1 5 /0 3 /2 0 0 8 1 5 /0 6 /2 0 0 8 1 5 /0 9 /2 0 0 8 1 5 /1 2 /2 0 0 8 1 5 /0 3 /2 0 0 9 1 5 /0 6 /2 0 0 9 1 5 /0 9 /2 0 0 9 1 5 /1 2 /2 0 0 9 1 5 /0 3 /2 0 1 0 1 5 /0 6 /2 0 1 0 1 5 /0 9 /2 0 1 0 1 5 /1 2 /2 0 1 0 1 5 /0 3 /2 0 1 1 1 5 /0 6 /2 0 1 1 1 5 /0 9 /2 0 1 1 1 5 /1 2 /2 0 1 1 (PEY.L) and SVG Capital (SVI.L) to the fore; we do, however, Direct FofFs consider SVI’s recently Source: Canaccord Genuity Limited, Datastream announced distribtion policy to be punitive given the amount of cash already on the balance sheet. 3i and Candover aside, returns in the sector were positive and a further refocussing of balance sheets also continued. Yet such improvements and strong levels of realisation on funds such as F&C Private Equity went largerly unrewarded. 2012 – opportunities and risks 11 January 2012
  • 23.
    23 Of our four favoured funds in our forward note for 2011, three generated double-digit returns for investors: LMS Capital (+23.6%), F&C Private Equity (+13.2%) and GPE (+14.4%) with only one - Electra (-15.5%) - falling short of expectations. Though the macro environment remains onerous, we continue to favour the sector moving forward and allocations should be made primarily on the basis of portfolio valuation and realisation potential. Therefore, we continue to recommend buying F&C Private Equity. Further consideration should be paid by investors to this sector. We would also consider HgCapital (HGT.L) in 2012. Though not cheap compared to its peers, we regard it as a proven source of Alpha with a team offering a strong track record. We were previously less optimistic on this vehicle, believing that the then premium ratings applied missed the point of a high cash weighting and forward risks of both de-rating and, in particular, that this money would take time to put to work (i.e. an extended J-curve). Well the fund still has a strong cash bias, but the current estimated double-digit discount is certainly a more attractive point to access this actively-managed fund. As can be seen from the graph on the previous page, private equity as an asset class was signfiicantly de-rated by the market in 2011 despite often strong gains in terms of NAV delivery, balance sheet improvments, enhanced value realisations and, in some cases at least, a still strong level of portfolio activity. Not all funds delivered, but many did and some went further in dramatatically enhancing their relations with their shareholders through plans to return capital. It is arguable, however, that during 2011, little or no differentiation in pricing occurred between the good, the bad and the downright ugly during this renewed de-rating phase. For example, Dunedin Enterprise has delivered NAV growth of over 30% in the last three years and introduced a new distribution policy in 2011. Other funds such as Candover and 3i lost over 30% of shareholder NAV in the same timeframe. Liquidity may be one thing, but long-term and proven management performance is also worth paying up for. However, we do expect material differentiation to occur on a fund-specific basis in 2012 across the broader private equity sector and for the discounts of the strongest funds to rebound positively. 11 January 2012 2012 – opportunities and risks
  • 24.
    24 OTHER STOCK PICKS FOR 2012 Biotech Growth Trust (BIOG.L) This trust does not always offer investors a smooth ride and we expect no difference moving forward. However, we believe the long-term fundamentals remain strong and the outlook for the sector robust, with cash-rich companies bidding for new product lines. Management has a proven track record and our prime concern here remains not the asset class, but a fairly concentrated shareholder register and an often shallow level of daily liquidity. Middlefield Canadian Income With a yield of 4.8% (payable quarterly), we are of the view that MCT offers distinct (MCT.L) advantages over some of its other income counterparts. These include a strong exposure to the vibrant Canadian economy with MCT particularly well exposed to favoured sectors such as the high yielding end of the energy and real estate markets. The fund also provides far greater levels of geographic, stock and yield-specific diversification than many FTSE100-based UK income trusts, though MCT would be heavily exposed to a sharp drop in commodities pricing and a broader global economic slump. The fund offers a covered dividend and a great track record of Alpha delivery and could be used as a bolt-on strategy to a broader pool of income vehicles. India Fund Inc (IFN.N). Aberdeen Asset Management assumed control of this fund in late-2011 and we expect that this will now be managed in a similar vein to the strong-performing New India Fund (NII.L). NII has added material value for investors in the last three years, versus both the Sensex and its peers, yet with a capitalisation of £115 million and an often poor trading profile, slips below the radar of at least some investors. IFN, in contrast, is capitalised almost five times larger than NII and offers a trading profile (in volume terms) over five times greater, so we believe this vehicle should appeal under its new stewardship to a broader range of clients. India itself offers further potential weakness in the short term and rising expectations for a pronounced cut in interest rates may yet be dashed amid still strong inflationary pressures. However, the supply of strong, relatively cash-rich companies is exemplary and, for longer-term investors, we believe further market weakness will provide grounds for long-term and opportunistic accumulation. Premia Plus When this share class is introduced from the end of February 2012 (in place of the existing Invesco Perpetual Select Hedge fund class), it will target a continuously balanced exposure to commodities, stocks and bonds, with ample diversification and a proven record. Canaccord met with lead managers Mark Ahnrud and Christian Ulrich in late- 2011. They presently manage US$3.2 billion under this strategy and results have been exceptional, not just in terms of the level of returns (with strong capital protection), but also the stability of those returns over various market phases. In the three years to end- November 2011, the approach generated a return of 17.4% against 11.0% for the 60/40 World Balanced Index (a combination of the MSCI World Equity Index and Barclays Aggregate Bond Index). The existing Fund of Hedge Funds sector contains many inadequacies, including (but not limited to) a lack of transparency, poor (relative) performance in both rising and falling markets, high fees, exposure to often lower-tier managers and costly lock-ups. But such characteristics cannot be labelled at Premia Plus. The fund will offer a balanced exposure to a variety of sub-classes within each of the commodity, equity and bond spaces, with the aim of minimising excessive drawdowns, with this blended approach also ensuring continued outperformance of at least some elements of the portfolio whatever the market 2012 – opportunities and risks 11 January 2012
  • 25.
    25 backdrop. The use of futures to operate this strategy also allows for immediate and comparatively costless liquidation (if required) of the portfolio and we look forward to providing investors with greater detail on the strategy and people concerned in the next two months. Murray International (MYI.L) Canaccord last met with manager Bruce Stout in October 2011 and his stated aim then for 2011 as a whole was to preserve capital and raise the fund’s dividend, both of which he achieved. Offering an already fairly defensive bias, Stout was at the time raising the fund’s level of security still further, with purchases of further stock in Mexican beer- producer FEMSA, which performed very well (in pricing and revenue growth terms) in 2011 and the always cash-generative Johnson & Johnson. In broader terms, as readers will have seen from this report, we commend such a defensive but still stock-creative approach to global markets and portfolio construction. After all, in times of turbulence, it is good to hold stocks that are less sensitive to economic shocks. Some may argue that it is an easy call to recommend the already premium-rated MYI. Yet it is Stout’s strong simultaneous exposure to both cash- generative but still dynamic themes such as rising emerging market consumption that we salute and we expect the fund to protect on the downside in 2012 with the potential to also benefit on the upside as the cyclical recovery in emerging markets takes hold. 11 January 2012 2012 – opportunities and risks
  • 26.
    26 US CEFS - WHERE THE ACTION IS? An underutilised source of Alpha There is little doubt that the US closed end fund sector remains an attractive but under- utilised source of global exposure for many UK-based investors. Indeed, it is arguable that US CEFs should be viewed as highly complementary to the UK trust sector and, as such, we have included a number of these funds in this review. US listed vehicles operate in a different, arguably more retail-based, environment, which often provides disparities in trading patterns compared to their UK-listed counterparts. However, once these differences are understood they should not be viewed by investors as being problematic. At the time of writing this report, the US CEF sector comprised 635 funds, with net assets of US$210.9 billion. Of these funds, just over 9% were capitalised at below US$50 million. The US CEF sector offers a market capitalisation-weighted discount of just 3.1%. However, this hides a huge spread of ratings, from discounts of over 30% (for example, on the small Foxby Corp, which has 17% of its assets invested in Apple Inc) to premiums in excess of 70% for Pimco’s Global StockPLUS & Income Fund (PGP.N). Greater and targeted choice We believe the US CEF market provides investors Assets and no of funds by listing with a broader choice of funds as well as differentiated types of asset, many of which are simply not available in the UK trust market. These include funds that invest in government debt, covered- call funds, emerging market debt vehicles as well as those investing in limited duration securities, a broader span of high Source: Canaccord Genuity, AIC, Morningstar yield instruments and single country equity funds. The latter include funds exposed to, for example, Germany, Ireland, Australia, Chile, Mexico (2 funds), Korea (3 funds), Singapore, China (4 funds), of which one is an A-Share fund, Indonesia and Turkey. The sector also includes two regional Latin American equity funds, offering an alternative option for holders of, for example, Blackrock Latin American Investment Trust (BRLA.L) which has often attracted an elevated rating given its relatively unique position in the UK market. Similarly, though vastly under-represented in the UK trust sector, the US CEF market offers investors a number of discounted funds exposed to the US equity market – one of the world’s strongest equity markets in 2011 but one where UK investors have the choice of just one actively-managed trust in the form of JPMorgan American (JAM.L). S&P500 – under-represented in One has to ask if JAM is so highly rated because of the manager and the benefits the UK Trust market provided by the fund, or simply because of the absence of any real competition in the UK trust sector. So, for UK investors, some of these US listed funds such as Adams Express (ADX.N, -16.5% at year end) or the (recently) stronger-performing Tri-Continental Corp (-15.1%) may offer a more attractive alternative. 2012 – opportunities and risks 11 January 2012
  • 27.
    27 Delights and dangers The US CEF market may be new to many of our readers, but that it provides opportunities that are not often available within the UK market is beyond doubt. It also, as highlighted above, provides strong complementary advantages to clients, being able to switch between similar vehicles with similar remits, but where advantages of greater liquidity, choice and managerial Alpha can, perhaps, be found in the US funds market. But there are downside risks. Corporate governance levels in the US market remain Corporate governance is often poor … fundamentally weak, though we are optimistic that key shareholders are now robustly taking up the challenge of improving shareholder welfare. Similarly, the bias towards high income funds within the US CEF market should always be treated with some caution. While reporting levels (and standards) have generally improved, many such … but key clients are driving funds are still simply returning capital to shareholders rather than accrued income and improvements being disproportionately rewarded for doing so. For example, the high-yielding Cornerstone Total Return (CRF.N) has attracted premiums in excess of 80% during the last five years – a period in which the capital value of the fund’s NAV has dropped by almost 70% and the total return on the NAV has been a relatively shallow 17%. So an 80% premium for an annualised NAV total return of 3.2% (and -14.8% on the price) seems excessive to us to say the least. Discount to “cash” anyone? Irrationally priced Federated Enhanced Treasury Income Fund (FTT.N) – US Treasuries were all the rage in 2011 as everyone headed for the “security” provided by this asset class. This has come despite the minimal and often negative real terms yields on offer and risks to the downside stemming from the increasingly unbalanced state (re massive state ownership) of the Treasury market itself. But amid this rush into Treasuries, FTT was left behind, moving from a 6.4% discount at the start of the year to -12.7% at its close. At end-November 2011, the fund had 89% of its assets in US Treasuries, 9.9% in US government MBS and 1.1% cash. The average weighted coupon was a small 3.05% with the yield on the fund itself standing at 6.3%. Either way, for a “risk-free” asset that in 2010 attracted a premium, we believe this fund offers some true value. And if US Treasuries are effectively “cash” given the nature and liquidity of the market, we ask why FTT trades at a near 13% discount? 11 January 2012 2012 – opportunities and risks
  • 28.
    28 SUMMARY OUR VIEW OF THE YEAR AHEAD 2012, or at least the first few months, are expected to be characterised by a need to implement fairly extensive capital protection, minimising downside risk exposure and avoiding further, government-induced, pitfalls. 2011 provided opportunities for a decisive change in government policy in the west and these opportunities were sadly not taken up (despite numerous, “last chance” summits). The end of 2011 also heightened volatility and closer correlation among asset classes. Don’t hide behind the curtains! This does not mean a lack of opportunities and that clients should overweight cash and hide behind the curtains! We expect opportunistic and theme-specific events will come to the fore throughout the year and, increasingly (though not at the start of the year), we expect key emerging and other asset classes to return to profitability. Cyclical recovery in emerging markets will happen, though not on the scale seen in the post-Lehman’s era. We see little point betting against the herd in times of macroeconomic and market instability, though we advise investors to be nimble and to be prepared to take profits on a shorter duration than during normalised markets. The most optimistic scenario at this stage is that corporate profits continue to please on the upside (hence our bias towards stock-picking managers) and that the global economy muddles through. However, socio and geo-political risks such as the US election cycle and tensions in the Middle East could come to the fore, actually superseding concerns at the economic level. AND TRUSTS In terms of trusts, we advise continued allocation to higher Alpha and consistent managers – those with a natural bias towards stock selection rather than indexation and managers that have seen this cycle before and acted accordingly. Yield will continue to dominate with interest rates low, but some disappointment may be felt both with the quality and durability of this yield. We also advocate strong diversification in terms of the source (sector and fund) of this yield. Specific managers provide Given the economic and market backdrop, discounts have, in many cases, remained opportunities relatively (if not overly) tight. However, numerous opportunities continue to exist within the Trust sector and the final weeks of 2011 finally started to throw up some more exciting (and reflective) risk pricing (though some funds and sectors continue to offer little on value-adjusted risk/reward basis). The US fund market, in contrast, was arguably more fully reflective of risk pricing in 2011 and we would strongly urge investors to make greater use of this space moving forward. And we now move forward onto a new stage for the trust sector with the implementation of the long-awaited RDR from the end of the year. This could present significant opportunities for the sector as a whole and specific funds, but the benefits cannot be guaranteed and managers, boards and brokers will need to work hard to make the case for investing in investment trusts. Wishing you all a very profitable 2012. 2012 – opportunities and risks 11 January 2012
  • 29.
    29 INVESTMENT TRUST SECTOR– KEY DATA TRENDS 2011 Selected sector discount spreads (end-2011) Selected sector NAV performance spreads (2011) Volume trends (% of funds - 2011 versus 5Y average) UK Inc Growth – Spread by capitalisation (£m) 2011 – Overall trust sector • Cap weighted 1Y trading volume as a % of 5Y average – 88% UK Small Cap Trusts –dispersion of % NAV returns (2011) Private equity discount trends (5 years) 50.0 30.0 10.0 -10.0 -30.0 -50.0 -70.0 15/12/2006 15/03/2007 15/06/2007 15/09/2007 15/12/2007 15/03/2008 15/06/2008 15/09/2008 15/12/2008 15/03/2009 15/06/2009 15/09/2009 15/12/2009 15/03/2010 15/06/2010 15/09/2010 15/12/2010 15/03/2011 15/06/2011 15/09/2011 15/12/2011 Direct FofFs Source: Funddata, Datastream, Canaccord Genuity Limited. Note: past performance does not predict future results. 11 January 2012 2012 – opportunities and risks
  • 30.
    30 APPENDIX: IMPORTANT DISCLOSURES AnalystCertification:- Each authoring analyst of Canaccord Genuity Limited whose name appears on the front page of this research hereby certifies that (i) the recommendations and opinions expressed in this research accurately reflect the authoring analyst’s personal, independent and objective views about any and all of the designated investments or relevant issuers discussed herein that are within such authoring analyst’s coverage universe and (ii) no part of the authoring analyst’s compensation was, is, or will be, directly or indirectly, related to the specific recommendations or views expressed by the authoring analyst in the research. Ratings/Coverage:- None of the stocks covered in this research are under formal and regular coverage by the analyst nor are they formally rated in accordance with the Canaccord Genuity Ratings System. Disclosure and Disclaimer:- For the purpose of UK regulation Canaccord Genuity Limited produces non-independent research which is a marketing communication under the FSA Conduct of Business Rules and has not been prepared in accordance with the FSA requirements to promote independence of research nor is it subject to the prohibition on dealing ahead of the dissemination of investment research. However, Canaccord Genuity Limited does have procedures in place to manage conflicts which may arise in the production of research, which includes preventing dealing head and Chinese Wall procedures. The authoring analysts who are responsible for the preparation of this research are employed by Canaccord Genuity Limited, which is authorised and regulated by the Financial Services Authority (FSA). To access the specific company disclosures of relationships and other material interests please refer to http://www.canaccordgenuity.com/EN/about/Pages/UKDisclosures.aspx The authoring analysts who are responsible for the preparation of this research have received (or will receive) compensation based upon (among other factors) the Corporate Finance/Investment Banking revenues and general profits of Canaccord Genuity. However, such authoring analysts have not received, and will not receive, compensation that is directly based upon or linked to one or more specific Corporate Finance/Investment Banking activities, or to recommendations contained in the research. The information contained in this research has been compiled by Canaccord Genuity Limited from sources believed to be reliable, but (with the exception of the information about Canaccord Genuity) no representation or warranty, express or implied, is made by Canaccord Genuity Limited, its affiliated companies or any other person as to its fairness, accuracy, completeness or correctness. Canaccord Genuity has not independently verified the facts, assumptions, and estimates contained herein. All estimates, opinions and other information contained in this research constitute Canaccord Genuity Limited’s judgement as of the date of this research, are subject to change without notice and are provided in good faith but without legal responsibility or liability. Canaccord Genuity salespeople, traders, and other professionals may provide oral or written market commentary or trading strategies to our clients and our proprietary trading desk that reflect opinions that are contrary to the opinions expressed in this research. Canaccord Genuity’s affiliates, proprietary trading desk, and investing businesses may make investment decisions that are inconsistent with the recommendations or views expressed in this research. This research is provided for information purposes only and does not constitute an offer or solicitation to buy or sell any designated investments discussed herein in any jurisdiction where such offer or solicitation would be prohibited. As a result, the designated investments discussed in this research may not be eligible for sale in some jurisdictions. This research is not, and under no circumstances should be construed as, a solicitation to act as a securities broker or dealer in any jurisdiction by any person or company that is not legally permitted to carry on the business of a securities broker or dealer in that jurisdiction. This material is prepared for general circulation to clients and does not have regard to the investment objectives, financial situation or particular needs of any particular person. Investors should obtain advice based on their own individual circumstances before making an investment decision. To the fullest extent permitted by law, none of Canaccord Genuity Limited, its affiliated companies or any other person accepts any liability whatsoever for any direct or consequential loss arising from or relating to any use of the information contained in this research. For United Kingdom and European Residents This research is for persons who are Eligible Counterparties or Professional Clients only and is exempt from the general restrictions in section 21 of the Financial Services and Markets Act 2000 (or any analogous legislation) on the communication of invitations or inducements to engage in investment activity on the grounds that it is being distributed in the United Kingdom only to persons of a kind described in Article 19(5) (Investment Professionals) and 49(2) (High Net Worth companies, unincorporated associations etc) of the Financial Services and Markets Act 2000 (Financial Promotion) Order 2005 (as amended). It is not intended to be distributed or passed on, directly or indirectly, to any other class of persons. This material is not for distribution in the United Kingdom or Europe to retail clients, as defined under the rules of the Financial Services Authority. For United States Residents This research is distributed in the United States by the entity that published the research as disclosed on the front page of this report to “major U.S. institutional investors”, as defined under Rule 15a-6 promulgated under the US Securities Exchange Act of 1934, as amended, and as interpreted by the staff of the US Securities and Exchange Commission (SEC). Analyst(s) preparing this report are resident outside the United States and are not associated persons or employees of any US regulated broker-dealer. Therefore the analyst(s) may not be subject to Rule 2711 restrictions on communications with a subject company, public appearances and trading securities held by a research analyst account. Additional information is available on request. Copyright © Canaccord Genuity Limited 2012. – Member LSE, authorized and regulated by the Financial Services Authority. All rights reserved. All material presented in this document, unless specifically indicated otherwise, is under copyright to Canaccord Genuity Limited. None of the material, nor its content, nor any copy of it, may be altered in any way, or transmitted to or distributed to any other party, without the prior express written permission of the entities listed above. 2012 – opportunities and risks 11 January 2012
  • 31.
    31 11 January 2012 2012 – opportunities and risks
  • 32.
    32 Research Specialist Sales Market Making Corporate Finance Paul Locke Nicholas Corke Angelo Sofocleous Gordon Neilly +44 20 7050 6709 +44 20 7050 6546 +44 20 7050 6547 +44 20 7050 6778 plocke@canaccordgenuity.com ncorke@canaccordgenuity.com asofocleous@canaccordgenuity.com +44 131 222 9409 gneilly@canaccordgenuity.com Analytical support Andrew Davey Andrew Lewis +44 20 7050 6542 +44 20 7050 6544 Sue Inglis Freddie Solway adavey@canaccordgenuity.com alewis@canaccordgenuity.com +44 20 7050 6779 +44 20 7050 6707 +44 131 222 9414 fsolway@canaccordgenuity.com singlis@canaccordgenuity.com Chris Whittingslow Cheyne Bunnett +44 20 7050 6528 +44 20 7050 6545 cwhittingslow@canaccordgenuity.com cbunnett@canaccordgenuity.com Rishi Zaveri +44 20 7050 6780 rzaveri@canaccordgenuity.com Specialist Sales – US Stephen Davis +1 617 788 1678 sdavis@canaccordgenuity.com Marc Loughlin +1 617 788 1676 mloughlin@canaccordgenuity.com Vancouver Head office   Toronto   Calgary   Montréal  P.O. Box 10337 Pacific Centre   BCE Place, 161 Bay Street   TransCanada Tower   1010, rue Sherbrooke ouest  2200‐609 Granville Street   Suite 3000, P.O. Box 516   450 1st Street SW Suite 2200   Bureau 1100  Vancouver, British Columbia   Toronoto Ontario   Calgary, Alberta   Montréal, Quebec  V7Y 1H2   M5J 2S1   T2P 5P8  H3A 2R7  1.604.643.7000   1.416.869.7368   1.403.508.3800   1.514.844.5443    London   Boston   New York   San Francisco  7th Floor, Cardinal Place   99 High Street   535 Madison Avenue   101 Montgomery Street  80 Victoria Street   Suite 1200   2nd Floor   Suite 2000  London, SW1E 5JL   Boston, MA   New York, NY   San Francisco, CA  44.20.7050.6500   02110   10022   94104    1.617.371.3900   1.212.849.3900   1.415.229.7171