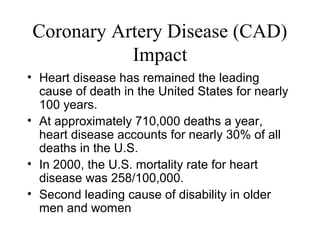
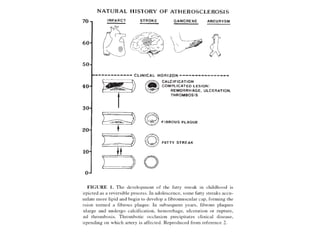
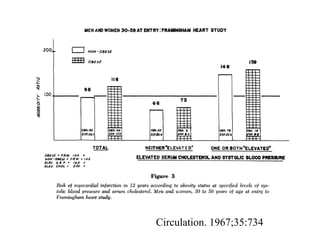
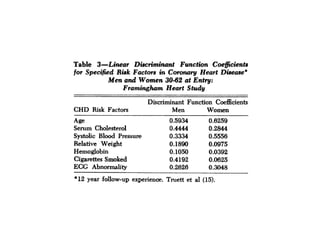
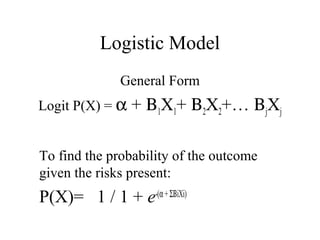
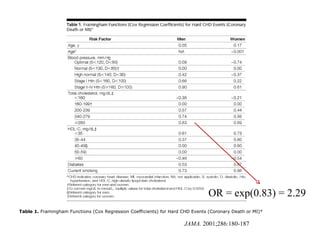
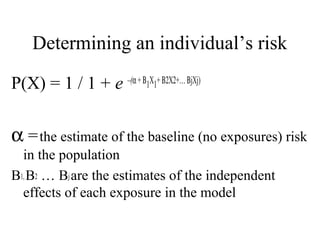
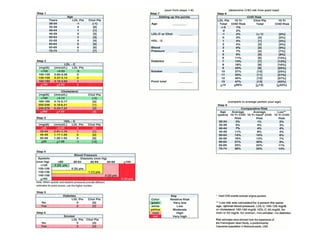
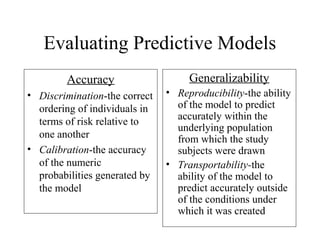
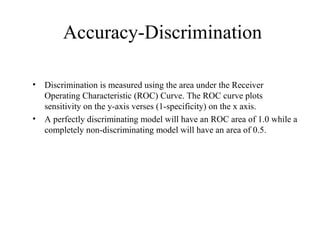
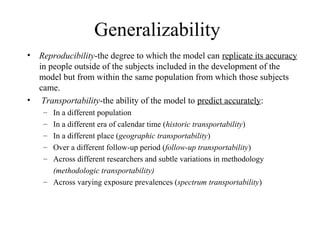
Multivariable Risk and Risk
Prediction
Coronary Artery Disease (CAD)
Impact
• Heart disease has remained the leading
cause of death in the United States for nearly
100 years.
• At approximately 710,000 deaths a year,
heart disease accounts for nearly 30% of all
deaths in the U.S.
• In 2000, the U.S. mortality rate for heart
disease was 258/100,000.
• Second leading cause of disability in older
men and women
medlib.med.utah.edu/WebPath/jpeg5/CV004.jpg
www.medicalengineer.co.uk/atherosclerosis.jpg
www.smbs.buffalo.edu/
Cholesterol hypothesis
Framingham: A seminal cohort study of CHD
Circulation. 1967;35:734
Logistic Model
General Form
Logit P(X) = α + Β1X1+ Β2X2+… ΒjXj
To find the probability of the outcome
given the risks present:
P(X)= 1 / 1 + e-(α+ΣΒiXi)
Table 1. Framingham Functions (Cox Regression Coefficients) for Hard CHD Events (Coronary Death or MI)*
JAMA. 2001;286:180-187
OR = exp(0.83) = 2.29
Copyright restrictions may apply.
LaRosa, J. C. et al. JAMA 1999;282:2340-2346.
Relative Odds of Major Coronary Events Associated With Statin Treatment From Individual Trials and
Overall by Sex and Age
“Classic” Risk Factors
• Age (85% of CHD mortality in people over 65)
• Male Gender
• Race
– African Americans have higher risk than whites until advanced age
– Asian Americans have half the risk of whites
• Cigarette Smoking
• Family History
• Low SES
• Obesity
• Low Physical Activity
• Hypertension
• Diabetes
• Serum Cholesterol
– Low High-Density Lipoprotein Concentrations
– High Low-Density Lipoprotein Concentrations
Determining an individual’s risk
P(X) = 1 / 1 + e –(α+Β1X1+Β2X2+…ΒjXj)
α =the estimate of the baseline (no exposures) risk
in the population
B1,B2 … Bjare the estimates of the independent
effects of each exposure in the model
Evaluating Predictive Models
Accuracy
• Discrimination-the correct
ordering of individuals in
terms of risk relative to
one another
• Calibration-the accuracy
of the numeric
probabilities generated by
the model
Generalizability
• Reproducibility-the ability
of the model to predict
accurately within the
underlying population
from which the study
subjects were drawn
• Transportability-the
ability of the model to
predict accurately outside
of the conditions under
which it was created
Accuracy-Discrimination
• Discrimination is measured using the area under the Receiver
Operating Characteristic (ROC) Curve. The ROC curve plots
sensitivity on the y-axis verses (1-specificity) on the x axis.
• A perfectly discriminating model will have an ROC area of 1.0 while a
completely non-discriminating model will have an area of 0.5.
Example of ROC Curve
Generalizability
• Reproducibility-the degree to which the model can replicate its accuracy
in people outside of the subjects included in the development of the
model but from within the same population from which those subjects
came.
• Transportability-the ability of the model to predict accurately:
– In a different population
– In a different era of calendar time (historic transportability)
– In a different place (geographic transportability)
– Over a different follow-up period (follow-up transportability)
– Across different researchers and subtle variations in methodology
(methodologic transportability)
– Across varying exposure prevalences (spectrum transportability)
12/05/16 21
12/05/16 22
12/05/16 23
Circulation. 2004;110:227-239.
Third Report of the Expert Panel
on Detection, Evaluation, and Treatment of High Blood
Cholesterol in Adults (Adult Treatment Panel III)
www.smj.org.uk/0803/CHD%20figure_1.htm .
Trends in coronary heart disease mortality among men
aged 35-64 in selected countries/areas
Coronary artery disease

Coronary artery disease

  • 1.
    Multivariable Risk andRisk Prediction
  • 2.
    Coronary Artery Disease(CAD) Impact • Heart disease has remained the leading cause of death in the United States for nearly 100 years. • At approximately 710,000 deaths a year, heart disease accounts for nearly 30% of all deaths in the U.S. • In 2000, the U.S. mortality rate for heart disease was 258/100,000. • Second leading cause of disability in older men and women
  • 4.
  • 5.
    Framingham: A seminalcohort study of CHD
  • 7.
  • 9.
    Logistic Model General Form LogitP(X) = α + Β1X1+ Β2X2+… ΒjXj To find the probability of the outcome given the risks present: P(X)= 1 / 1 + e-(α+ΣΒiXi)
  • 10.
    Table 1. FraminghamFunctions (Cox Regression Coefficients) for Hard CHD Events (Coronary Death or MI)* JAMA. 2001;286:180-187 OR = exp(0.83) = 2.29
  • 12.
    Copyright restrictions mayapply. LaRosa, J. C. et al. JAMA 1999;282:2340-2346. Relative Odds of Major Coronary Events Associated With Statin Treatment From Individual Trials and Overall by Sex and Age
  • 13.
    “Classic” Risk Factors •Age (85% of CHD mortality in people over 65) • Male Gender • Race – African Americans have higher risk than whites until advanced age – Asian Americans have half the risk of whites • Cigarette Smoking • Family History • Low SES • Obesity • Low Physical Activity • Hypertension • Diabetes • Serum Cholesterol – Low High-Density Lipoprotein Concentrations – High Low-Density Lipoprotein Concentrations
  • 15.
    Determining an individual’srisk P(X) = 1 / 1 + e –(α+Β1X1+Β2X2+…ΒjXj) α =the estimate of the baseline (no exposures) risk in the population B1,B2 … Bjare the estimates of the independent effects of each exposure in the model
  • 17.
    Evaluating Predictive Models Accuracy •Discrimination-the correct ordering of individuals in terms of risk relative to one another • Calibration-the accuracy of the numeric probabilities generated by the model Generalizability • Reproducibility-the ability of the model to predict accurately within the underlying population from which the study subjects were drawn • Transportability-the ability of the model to predict accurately outside of the conditions under which it was created
  • 18.
    Accuracy-Discrimination • Discrimination ismeasured using the area under the Receiver Operating Characteristic (ROC) Curve. The ROC curve plots sensitivity on the y-axis verses (1-specificity) on the x axis. • A perfectly discriminating model will have an ROC area of 1.0 while a completely non-discriminating model will have an area of 0.5.
  • 19.
  • 20.
    Generalizability • Reproducibility-the degreeto which the model can replicate its accuracy in people outside of the subjects included in the development of the model but from within the same population from which those subjects came. • Transportability-the ability of the model to predict accurately: – In a different population – In a different era of calendar time (historic transportability) – In a different place (geographic transportability) – Over a different follow-up period (follow-up transportability) – Across different researchers and subtle variations in methodology (methodologic transportability) – Across varying exposure prevalences (spectrum transportability)
  • 21.
  • 22.
  • 23.
  • 24.
    Circulation. 2004;110:227-239. Third Reportof the Expert Panel on Detection, Evaluation, and Treatment of High Blood Cholesterol in Adults (Adult Treatment Panel III)
  • 25.
    www.smj.org.uk/0803/CHD%20figure_1.htm . Trends incoronary heart disease mortality among men aged 35-64 in selected countries/areas