This document summarizes a journal article that discusses ways to evaluate the effectiveness of federal advisory committees. It provides background on the Federal Advisory Committee Act and the issues it aimed to address regarding transparency and oversight of advisory committees. The article argues that more accurate data is needed to properly assess the productivity and impact of advisory committees. It recommends that agencies provide feedback to committees on their recommendations and that best practices be identified to improve committee functions. An amendment to the Act may be required to give the GSA authority to collect additional useful data.


![2 2 M u l l a n
( E n d n o t e s )
1 P.L. 92-463 1972.
2 P.L. 92-463 1972.
3 “Memorandum for the Heads of Executive Departments and Agencies: Open
Government Directive,” Office of Management and Budget, December 8, 2009,
accessed October 7, 2012. http://www.whitehouse.gov/open/documents/open-
government-directive.
4 Ibid.
5 Federal Advisory Committee Act (FACA), General Services Administration, November
10, 2011, accessed April 24, 2012. www.gsa.gov/faca.
6 Federal Advisory Committee Act Database, General Services Administration, accessed
April 24, 2012. www.fido.gov/facadatabase. [Hereinafter FACA Database]
7 Executive Order 13490, “Ethics Commitments by Executive Branch Personnel,” 74
Federal Register 4673, January 21, 2009.
8 “Papers Relating to What Is Known As the Whiskey Insurrection in Western
Pennsylvania, 1794.” Pennsylvania Archives. 4 (1876).
9 Other steps had been taken by Executive Branch agencies to increase oversight of
advisory committees prior to the passage of FACA. In 1950, the Justice Department
issued guidelines about the creation of an advisory committee and the role of the
agency, but these guidelines were mostly ignored. The Bureau of Budget issued a
directive in 1959 reasserting the Justice Department guidelines. In 1962, President
Kennedy signed Executive Order 11,007 expanding the scope of the Justice
Department guidelines. However, none of these guidelines applied to Presidential
advisory committees. Steven P Croley and William F. Funk, “The Federal Advisory
Committee Act and Good Government,” Yale Journal on Regulation 14 (1997): 458-
460.
10 Freedom of Information Act; Government in the Sunshine Act.
11 Ibid. pg. 453.
12 Ibid. pg. 460.
13 “The Role and Effectiveness of Federal Advisory Committees: Forty-third Report,”
House Committee on Government Operations, 1970, 10-11.
14 Ibid. pg. 10.
15 Ibid.
16 Ibid. pg. 12.
17 Ibid. pg. 12-13.
18 Ibid.
19 Ibid.
20 Ibid.
21 P.L. 92-463 1972.](https://image.slidesharecdn.com/6b9d4be1-fab7-4330-b07a-71cc736df3dc-150224234141-conversion-gate01/85/cornell-policy-review1-26-320.jpg)


![32 L i
Currently, there is no universal definition of “digital divide.” Manuel Cas-
tells, Chair of Communication Technology and Society at the University of South-
ern California, defines the term broadly as inequalities in Internet access.13
Ac-
cording to Castells, Internet access is “a requisite for overcoming inequality in a
society [where] dominant functions and social groups are increasingly organized
around the Internet.”14
Scholars and policymakers are often vague in their refer-
ence to computers and the Internet as ICTs because rapid digital innovations make
ICT difficult to define. In fact, ICT should be considered an umbrella term for
a broad range of technological applications (computer hardware and software),
digital broadcast technologies (video cameras), telecommunications technologies
(mobile phones), and electronic information resources (Internet).15
While research in the United States is focused on the ways in which the
digital divide reflects disparities in educational attainment, socioeconomic class,
and geographic location, the international community is concerned with the re-
markable divergence of ICT growth between developed and developing nations.
Following the Millennium Summit of the United Nations in September 2000, the
UN and its member states set forth eight Millennium Developments Goals to be
achieved by 2015.16
As part of its continual efforts to form a global partnership
towards poverty eradication, the UN specifically pledged to “make available the
benefits of new technologies, especially information and communication” in co-
operation with the private sector.17
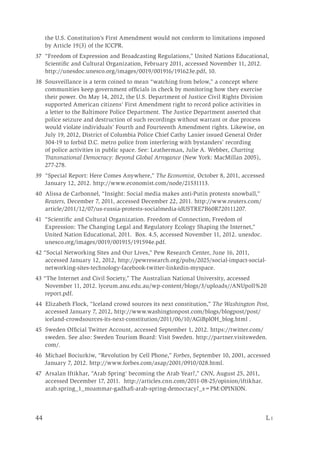
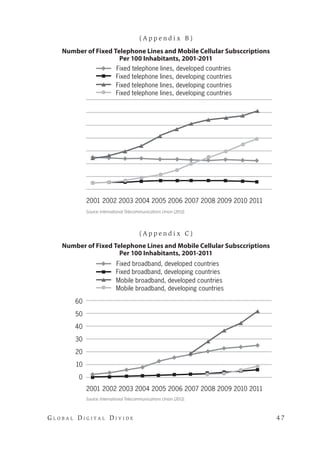
At present, disparities in worldwide ICT development remain striking. The
UN and the ITU actively track digital development by examining the number of
fixed telephone lines and mobile cellular subscriptions per 100 inhabitants, the
number of Internet users per 100 inhabitants, and the number of wired broadband
subscriptions and mobile broadband subscriptions per 100 inhabitants. Accord-
ing to the ITU, 70.2 percent of the population in developed countries are Inter-
net users, as opposed to 24.4 percent of the population in developing countries
(Appendix A).18
Additionally, mobile phone subscription per 100 habitants in the
developed world is 122.3 subscriptions, as compared to 77.8 subscriptions in the
developing world (Appendix B).19
Furthermore, 25 percent of the population in
developed nations subscribes to wired-broadband Internet services, whereas only
4.9 percent of the population in developing nations are wired-broadband Internet
subscribers (Appendix C).20
In a broad overview, the ITU found a high correlation
between countries’ gross national income per capita and their level of ICT devel-
opment (Appendix D).21
Statistics from the Organization for Economic and Devel-](https://image.slidesharecdn.com/6b9d4be1-fab7-4330-b07a-71cc736df3dc-150224234141-conversion-gate01/85/cornell-policy-review1-36-320.jpg)
![G l o b a l D i g i t a l D i v i d e 3 7
of thousands of Filipinos protested in central Manila against a controversial im-
peachment trial that could have removed Philippine President Joseph Estrada.
Majority protestors gathered after receiving instant messages such as “Full mblsn
tday EDSA” (long form: “Full mobilization today at the Edsa shrine in Manila”)
broadcast to their mobile phones. Eventually, their protests ousted President Es-
trada.46
Additionally, social media gained substantial attention after the 2011 Arab
Spring.47
Following the Arab Spring revolutions, social media was incorrectly her-
alded as the deterministic tool that could bring political change. In fact, social me-
dia in and of itself does not challenge government rule, nor oust dictators. Instead,
social media’s true empowering potential was not to replace, but to accelerate and
facilitate the coordination of real-world actions towards collective goals. During
the 2011 Egyptian Revolution, Richard Engel, NBC News Chief Foreign Correspon-
dent, made the following observations at the Tahrir Square:
People were communicating mostly by cell phone. That was the overwhelming
source of communications and information distribution ... [The Egyptians] set
up a little bit of media center, where people could come in, exchange informa-
tion, and use their cell phones to get out the latest information. When they
thought that the cell phones weren’t safe ... they would switch to Twitter. Then,
when the Twitter messages ... were being compromised, they would switch to
Facebook. So, there was a very sophisticated use of information, but I would
say those would be the [main] three. Cell phones the biggest, [then] Twitter
and Facebook.48
In short, ICTs are tools that enable and strengthen civil society and promote
social values. ICTs provide channels for marginalized voices to communicate and
mobilize against political oppression. Their broadcasting functionality also serves
to amplify voices calling for social justice, equality, peace, reconciliation, and truth.
Digital Divide Deters Democracy
Despite ICTs’ potential for positively promoting social values associated with de-
mocracy and public participation, ICTs can be used in oppressive ways. Because
ICTs are tools, they can be abused to pursue goals that do not promote social jus-
tice and global transformation. Janie Leatherman, Professor of Politics at Fairfield
University, suggests that information technologies could re-inscribe traditional
hierarchies, rather than subvert them.49
ICTs are just as likely to strengthen as to
weaken state authorities. In repressive states such as Iran, China, and Burma, the
government may attempt to secure its stability by policing access and monitoring](https://image.slidesharecdn.com/6b9d4be1-fab7-4330-b07a-71cc736df3dc-150224234141-conversion-gate01/85/cornell-policy-review1-41-320.jpg)

![5 2 Yo un g
An Overview of Hungary’s Socialist System
and Transition to An Open Market
H
ungary was a centrally planned state while under Soviet rule with the
federal government dictating economic activity. The Soviet Union as-
sessed its industry needs and allocated production centers according
to state capacity, availability of natural resources, and relationships
within the Eastern Bloc.3
Industries were then “built up and run in complex clus-
ter-like web[s] of planning and competition.”4
Each region within the Soviet Union
and its satellite countries became highly specialized in its delegated production
focus. Hungary’s major production regions, Budapest and the Northeast, played
a significant role in production and component manufacturing for the automobile
industry. They supplied parts domestically, as well as to other socialist countries.5
Budapest became the center of Hungary’s industrial production during so-
cialist rule as Europe’s postwar centralization of infrastructure development led
populations to relocate to urban areas.6
Regional disparities had existed through-
out Hungary’s history due to continuous governance by foreign powers, such as
the Habsburgs or the Soviet state. These existing disparities were intensified by
the relocation of industries to the nation’s capital as a part of postwar development
policies. As a result, an increased amount of job opportunities and regional invest-
ment also moved to Budapest and the Northeast region.7
Government policies did relocate some industry to areas outside of Buda-
pest in an attempt to relieve the overabundance of agricultural laborers in that
area, as well as to limit the growing disparities between regions.8
While this move
helped ease inequalities to a degree, regional differences ultimately grew within
the socialist system due to the preferential treatment of high-producing regions.
Additionally, beginning in the 1980s, growing financial uncertainty throughout
the Eastern Bloc rendered Hungary’s regional concerns secondary to the fate of the
national economy.9
In 1990, following the collapse of the Soviet Union, CEECs decided to adopt
an open-market approach to economic development called “shock therapy.”10
Hun-
gary employed this strategy, immediately implementing a democratic government
accompanied by open-market regulations in an effort to develop an economically
modern and viable nation.11
The CEECs’ implementation of shock therapy policies
reflected their common desire to replicate the economic success of liberal Western
nations.](https://image.slidesharecdn.com/6b9d4be1-fab7-4330-b07a-71cc736df3dc-150224234141-conversion-gate01/85/cornell-policy-review1-56-320.jpg)
![F o r e i g n D i r e c t I n v e s t m e n t ’s I n f l u e n c e 5 7
overtime within a “separately structured partnership.”47
The government created
new regulations, as well as the Ministry of Industry, to govern such partnerships
and apply uniform policies across all sectors.48
State enterprises had substantially
more political power and control over supply than their competitors, however,
and therefore they continued to act as central players in determining policies and
affecting political objectives.49
In this environment of uneven competition, small
firms had little opportunity to grow and gain influence within their respective
sectors, and in the overall economy. Additionally, the socialist cultural aversion to
large-scale returns on investment further diminished small businesses’ chances
of success.50
Profits within a socialist state were seen as detrimental when at-
tained for individual gain rather than for furthering the public good.51
Regulation
dictated by state enterprises and the societal scrutiny over profits meant that
small firms had little chance to grow. This meant that there would be little motiva-
tion to maintain competitiveness due to the lack of financial opportunity.
Another motivation for allowing FDI into Hungary’s economy was to create
connections between domestic firms and foreign investors. Substantial linkages
failed to develop, however, since investor interest was limited to manufacturing.
The links that did materialize were committed to the low value end of the produc-
tion chain. Within the automotive industry, the major foreign companies relied on
existing European suppliers for components, using Hungary instead for the gener-
ous duty-free status given to them in an attempt to attract additional investment.52
General Motors (GM), for instance, had domestic ties with regard to ownership, but
due to its small production capacity in Hungary, the gains were modest with limited
training or skill development for the labor force and only 700 jobs were created.53
GM’s association with the domestic firm Astras accounted for only 15 percent
of assembly and “mainly comprised of basic low-technology items like paint, sun
visors [and] mudguards.”54
Therefore, the work that was passed on to domestic
firms was on the low-end of the value chain, meaning that new skills and im-
proved technology did not spill over into the domestic market, as would have been
the case with high-end production.55
Financial gain rested predominantly with
foreign investors while producing a marginal number of domestic jobs in periph-
eral regions. Significantly less profit and technology transfer to local businesses
and the national economy occurred than had been expected.56
While innovation in the socialist economy had been limited by a cost cut-
ting mentality, innovation in the open market economy was limited in many ways](https://image.slidesharecdn.com/6b9d4be1-fab7-4330-b07a-71cc736df3dc-150224234141-conversion-gate01/85/cornell-policy-review1-61-320.jpg)

![T h e E f f e c t o f P r i v a t e D e t e n t i o n P o l i c y 6 9
million employees, and continue to constitute a growing percentage of the U.S.
workforce.11
Preventative care services and social welfare programs—particularly
those that benefit migrant populations—are notoriously difficult to quantify and
justify in the short-term, given political expediency issues and fiscal pressures. As
a result, health and human services programs, many of which are crucial to the
social and political equity of immigrants, are often the first to experience budget
cuts to support debt service payments on infrastructural development and con-
struction projects. As social welfare programs are cut, and as the Department of
Homeland Security (DHS) continues to grapple with policies to detain and deport
immigrants, the costs associated with enforcement become a greater concern and
endanger the long-term viability of detention and deportation strategies and trends.
While immigrant detention and deportation policies have become increas-
ingly controversial since the IIRIRA and warrant considerable financial scrutiny,
it is also important to evaluate the effects of prisons and privately owned deten-
tion centers on social and political incorporation. California and Arizona offer
two unique settings where the political and social tension between migrant popu-
lations and detention organizations translates into policy at the state and local
levels.
Political and Social Incorporation
Practical Application in Detention Policy
Political incorporation is defined as “the responsiveness of the [political] sys-
tem to the interest of inclusion and substantial authority and influence.” In other
words, political incorporation is the extent to which a group’s interests are ef-
fectively represented in policy-making; in this case, detention policy.12
Political
incorporation applies to several different social contexts, the first of which occurs
through self-identified groups with interests that focus on specific demographic
characteristics, emotions, attitudes, and perceptions. Second, political incorpora-
tion can span from “an individual’s law-abiding residence in the polity,” to his or
her full engagement with the process of democracy.13
The concept of membership
slides across a broad spectrum of participatory activity, from simply existing in a
community, to participation in a detention facility siting hearing, to full-fledged
civic engagement and deliberative participation in the democratic process.
The state is responsible for providing a framework for incorporation, yet
private enterprise plays a large role in molding detention policy within state and
local government. The theory of central contradictions asserts that there is a rap-](https://image.slidesharecdn.com/6b9d4be1-fab7-4330-b07a-71cc736df3dc-150224234141-conversion-gate01/85/cornell-policy-review1-73-320.jpg)
![7 2 J e t t e
tion process, and may include any combination of several indicator variables: “the
demographic composition of an area, its economic base and level of well-being,
the nature and quality of schools and social services, the structure and practices
of local governance, the location of municipal boundaries, the permeability of
neighborhoods, and transportation and communication channels.”19
The conflu-
ence of economic and social indicators facilitates of impeded economic contribu-
tion and ultimately political and civic participation in a given community.
Despite the importance of social and political incorporation, policy-makers
use economic arguments to support recommendations regarding migration policy
since quantitative information is easier to measure, interpret, and communicate
within the state or local budgeting process. Policy is quantified in terms of “in-
flation and unemployment rates, links to global markets, the robustness of the
manufacturing and service sectors, the organization of the agricultural sectors,
and the accessibility of banking services.”20
The interpretation of these variables
is a point of contention between restrictionist and expansionist advocates. Politi-
cal participation and mobilization may favorably or unfavorably shift the balance
of political capital, depending on the relative persuasiveness and visibility of each
participatory group.
Political participation extends beyond the ballot box, and into many forms
of civic engagement such as town meetings, campaign events, rallies, demon-
strations, education or awareness campaigns, and other forms of assembly. The
traditional concept of participation is insufficient to encapsulate the breadth of
advocacy options available to immigrants, and must be expanded to include more
accessible, non-citizen alternatives. Immigrants can advocate within trade unions,
voluntary associations, religious groups, and community organizations.21
Com-
munication skills, lack of education, and obstacles to migrant membership within
a community act as barriers to political participation at the local level, margin-
alizing migrants, and prolonging the political and social incorporation process.
Rather than embrace the qualities that make a community diverse, “localities may
isolate immigrants, sharpen their differences from the native-born, [and] discour-
age their political participation and civic socialization.”22
In this context, the fi-
nancial interests of private detention enterprises are detrimental to the formation
of migrant community networks and the incorporation process, since they detain
the undocumented migrant population in order to maximize revenues.
Detention policy is one area where the influence of political, social, and](https://image.slidesharecdn.com/6b9d4be1-fab7-4330-b07a-71cc736df3dc-150224234141-conversion-gate01/85/cornell-policy-review1-76-320.jpg)