SlideShare a Scribd company logo
  	
   Shriver	
  1	


Assessing the Understanding of Lightning Jumps and their Connection to
Thunderstorm Intensity
ALAN D. SHRIVER
Iowa State University, Ames, Iowa
CHRISTOPHER J. SCHULTZ
Department of Atmospheric Sciences, University of Alabama, Huntsville, Alabama
WILLIAM GALLUS
Department of Geological and Atmospheric Sciences, Iowa State University, Ames, Iowa
(Received 24 November 2015, in final form 5 December 2014)
ABSTRACT
This study investigates the relationship between individual mesoscale thunderstorm cells and lightning jumps
by tracking the behavior of three storm metrics, which were picked based on their overall high importance to
storm and updraft intensity. The main objective of this research was to determine how the selected storm
metrics were individually behaving in response to a lightning jump, effectively testing the theory that lightning
jumps signal storms that are likely to grow faster than storms containing no jumps, continue to grow beyond a
jump and become stronger than other cells nearby. This study used TITAN (Thunderstorm Identification,
Tracking Analysis and Nowcasting) storm-tracking information with a set of files containing the values
recorded in 5-minute intervals for the jump ratio developed by University of Alabama researchers. This
investigation examined 35 storm cells in the Tennessee valley region in combination with NEXRAD Level II
radar data obtained from the National Climactic Data Center. The study tracked storm information and radar
data for each cell analyzed, particularly near the time of lightning jumps. A lightning ‘jump’ for the purpose of
this study was defined as a rapid increase in flash rate that registered 1.5 or higher on the jump ratio algorithm.
The study found that 14 of the 35 cases examined contained at least one lightning jump, with the results also
indicating higher values and higher maximum increases in values in the overall averages for reflectivity,
estimated hail size and precipitation echo tops for cells that contained jumps.
1. Introduction
It has long been known that unusually high lightning
activity is frequently synonymous with particularly strong
storms. Recent studies, including the extensive work
done by a team of researchers at the University of
Alabama in Huntsville, have supported the idea that
sudden increases in lightning activity can occur just
before or during rapid storm growth in a mesoscale storm
cell or system. The researchers have been working to
develop accurate algorithms to detect lightning jumps and
the accuracy rate of what has been termed a “lightning
jump” to predict severe weather in storm cells before it is
indicated by Doppler Radar systems. Lightning jumps are
not simply counted as any marginal increase in lightning
FR (flash rate), rather a standard deviation from the
average maximum DFR/Dt recorded in non-severe storms
is used to determine whether an increase is sharp enough
to count as a true jump. If a cell exhibits a rate of change
twice the value of the positive standard deviation (2𝜎) for
normal thunderstorm FR increase, this is counted as a
lightning jump (Schultz et al. 2009, Schultz et al 2011).
Figures 1 and 2 show the evolution of LMA (Lightning
Mapping Array) total lightning flash density summaries
for 1-hour segments between 20:00 and 22:00 UTC on
October 8th
, 2014 in northeast Alabama. Two main storm
cells in fig. 1 are evident as two bullet maxima of lighting
density in the grid surrounded by lower densities in all
directions. During the latter half of the two hours, a new
cell appeared in the data with a 1-hour density maximum
already higher than the scale can categorize. A sheriff’s
office observed 2.75” diameter hail at 21:34 UTC, about
halfway through the period when this high density of
lightning suddenly appeared in the updated 1-hour
summary. It is evident that the lightning rate likely
became very high fairly quickly in a brand new cell
during the second half of the shown timeframe,
suggesting that there is a possible connection between the
  	
   Shriver	
  2	


increased lightning rate and the development of very large
hail in the storm cell. It is important to note, however,
that this particular example does not show what is really
occurring on shorter time intervals. Though the lightning
increases substantially in the hour summaries, the plots
don’t reveal the minute-by-minute changes that occurred
Figure 1. Lightning flash density for a 2x2 km resolution over
the 1-hour period from 20 to 21 UTC on October 8th
, 2014.
Two clusters of high strike density indicate two distinct storm
cells southwest of Huntsville. The bars above and to the right
display the density of flashes between 0 and 20 km altitude
through each north-south and east-west cross-section of the total
domain.
during each hour. Nevertheless, given that the increase is
very large, it is very possible a jump did occur during the
segment of time covered by the two summaries. This
relationship between rapid increases in lightning activity
often with anomalously high lightning rates and the
development of severe weather has been supported by
multiple recent studies (including Shultz et al. 2009;2011,
LaPenta et al. 2005, Chronis et al. 2014, and Ware 2012).
This study focused on extending previous research done
by the University of Alabama (Schultz et al. 2009; 2011)
on the connection between storm intensity and lightning
jumps by analyzing two collections of thunderstorm cells
in the KHTX Northern Alabama NEXRAD Level II radar
range, as in the region shown in fig. 3.
Figure 2. Lightning flash density from 21 to 22 UTC. A third
cell appears to have developed with a large region of flash
density exceeding 1000 flashes per 4 square kilometers. About
halfway through the hour, 2.75” diameter hail is reported by a
sheriff’s office located in Sommerville. (From Northern
Alabama LMA, or Lightning Mapping Array)
The purpose of this research is to investigate the
responses in three selected storm metrics in the time
vicinity of lightning jumps. The increased potential for
severe weather following a lightning jump has been fairly
well established as a true connection between lightning
and storm intensity. However, the verification of the
lightning jumps in previous studies was largely based on
storm reports, which contain many flaws (e.g., timing,
size, degree of damage; Witt et al. 1998, Ware et al. 2012,
Trapp et al. 2005). Changes in the individual signals of
growth in discrete storm cells from different metrics
should provide a more reliable method by which one can
compare storms to judge storm intensity. This analysis
seeks to determine how well increases in base reflectivity,
estimated hail size, and precipitation echo tops match up
with observed lightning jumps in storm cells. This
application would aid forecasters in picking out which
storms were the most intense and potentially require a
warning to be issued. In addition, the study attempts to
test the effectiveness of lightning jumps to detect the
strongest thunderstorms in a given cluster of cells by
comparing peak values in the metrics to peaks in nearby
storm cells. This study hypothesizes that if lightning
  	
   Shriver	
  3	


jumps do tend to occur shortly prior to or during rapid
storm growth, then the storm metrics should each show an
increase in value in the time vicinity of lightning jumps.
The results of this study should help researchers gain a
better understanding of the exact connection between
lightning and the behavior of thunderstorms.
Figure 3. Region of study, KHTX NEXRAD Radar full range
shown. Radar site is located in Hytop, AL near Huntsville.
2. Literature Review
Despite the fact that the term “lightning jump” has only
been recently used in publications concerning lightning
behavior, there is substantial agreement amongst
researchers on its basic definition. Lightning jumps are
currently defined as a rapid increase in total lightning
frequency in both individual convective storm cells and in
cells embedded within linear storm segments or in a
mesoscale convective system (MCS). Most published
work on this phenomenon cites increasing updraft
strength as the primary causation of these increases in
lightning activity.
The implications of lightning jumps concerning
thunderstorm intensity are much more important to
current and future research. Several research groups,
including a team of scientists working closely with
lightning jumps at the University of Alabama in
Huntsville have conducted empirical investigations on the
relationship between lightning jumps and storm strength
(e.g, Schultz et al. 2009; 2011, Chronis et al. 2014). The
consensus from most of the current research base is that
lightning jumps frequently are followed by rapid
intensification in overall storm strength, usually before
this intensification appears on any radar scans of the
storm. Exactly how frequently lightning jumps
successfully predict intensification and the degree to
which the jumps can predict a storm reaching severe
levels is still slightly unclear. Studies dating back to the
1980s have found very mixed results, with some studies
turning up with results less positive than from Schultz et.
al (2009). For example, Knapp (1994) found no
connection between increases cloud-to-ground lightning
strikes and subsequent tornado development. Yet other
investigations have found very promising connections
between lightning and tornadogenesis. such as LaPenta et
al. (2005). This study found large peaks in cloud-to-
ground strikes about 25 minutes prior to a tornado
touchdown in a severe thunderstorm in Mechanicville,
NY. The more recent studies including Lapenta et al.
(2005) have generally found more consistent positive
correlations between increased lightning and tornado
development. The application of lightning jumps in
severe weather and storm forecasting is also still, at best,
only in its earliest stages of development.
a. Scope of Completed Research


The terminology used to describe the pronounced increase
in lighting frequency is relatively new; most published
articles and reports do not cite the term “lightning jump”
earlier than about 2000. However, the theories that
increase in lightning activity are related to thunderstorm
strength and evolution is not at all new. It has been
suggested by a multitude of research papers that there is a
distinct connection between lightning behavior and
thunderstorm updrafts, some dating back to the 1950s.
However, much of this work, particularly less recent
writings, emphasizes the same general conclusion: the
exact relationship is unclear.
I. Well-Supported Findings
	
  
There is a substantial collection of theories and
hypotheses that the overwhelming majority of published
work support on lighting jumps. The most important of
these is the causation of lightning jumps. It has been
demonstrated that the electrical fields that develop within
thunderstorms is not fully possible without the presence of
solid ice crystals in portions of the cloud. The physical
derivation of the electrical fields precisely is greatly
complex and is generally implied as a fairly low relevance
to the subject of lightning jumps themselves.
  	
   Shriver	
  4	


More crucial to this subject is another theory that follows
almost directly form the importance of ice crystals to
lightning initiation. Stronger updrafts will lift more mass
of water vapor above the freezing level, leading to larger
quantities of supercooled droplets and mass of ice crystals
within the upper portions of a thunderstorm. Hence
strengthening updrafts are frequently cited as causing an
increase in lightning activity. Saunders (1993) outlines in
great detail the importance of the updraft in a storm
carrying negatively charged particles aloft in a
thunderstorm. The heavier particles, which obtain an
opposite charge after colliding with smaller ice crystals,
tend to stay lower in the storm since they have a faster
terminal fall speed. One of the leading scientists that
contributed to Shultz et al. (2009;2011), Dr. Larry Carey,
well states, “With the strong updraft you get hail, small
ice and super-cooled water. Those are the three
ingredients. Once you have those, you have
electrification.” (Livingston, 2012) Another key theory
much of the current literature discusses is that lightning
jumps cannot discern severe weather types for predicting
storms that produce severe weather. Although different
lengths of time have been observed on average for
different modes of severe weather, there is not enough
consistency overall to use this as a diagnostic for expected
severe weather type.
II. Controversial Findings
There are a few conclusions from various research reports
on lightning jumps that conflict with conclusions found by
other groups. Geophysicist Benjamin Barnum believes
that lightning jumps can help predict tornadoes. He
asserts that there is behavior in the rate of change of
lightning frequency not observed in any other non-
tornadic storms. “The rapid increase in lightning rates
measured by the single point systems ... were nearly
double or triple what we usually measured during other
thunderstorms during this spring.” (Livingston, 2012)
Other studies, such as Ware et al. (2012) found more
mixed cases in the ability of jumps to predict severe
weather events in general. Several of the cases they
examined had severe hail recorded as much as 19 minutes
prior to any lightning jumps, and other cells that
successfully predicted severe hail and microbursts by
several minutes. Ware et al. (2012) suggests that the
accuracy of lightning jumps aiding in the prediction of
severe storms is rather limited, and hence would likely be
limited as well for predicting tornadoes. It is noteworthy,
however, that this study mainly focused on hail alone and
did not have a very large sample size, with only 18 total
cells analyzed. There is also not necessarily enough
evidence to substantially support the notion that lightning
jumps have this capability to predict a type of severe
weather with significant weight over another, although
there is still growing support that lightning jumps can
identify storms that have a higher chance of producing
tornadoes and of all other severe weather types.
Another area that is subject to dispute is the exact
definition of a lighting jump itself. Some articles simply
describe a lighting jump as a substantial increase in
lightning activity. But substantial and an increase are
very vague terminologies. How much of an increase in
flash rate is enough to count as a jump? Shultz et al.
(2009) has come up with a much more specific, but still
not necessarily well agreed upon description of lighting
jumps. “All thunderstorms will, by definition, exhibit at
least one jump in lightning activity during their lifetime.”
(Schultz et al. 2009) The team essentially says that every
thunderstorm must have some increase in lightning
activity, otherwise it wouldn’t be a thunderstorm; the
lightning rate would never go above zero. Importantly, a
true lightning jump must be defined as an exceptionally
high and sharp increase in overall lightning FR. Rather
than simply look for any marginal increase in lightning,
specific thresholds are used to identify jumps such that the
positive rate of change must surpass a set value to count
as a jump that could be large enough to indicate an
elevated severe potential. This, Schultz predicts, will help
prevent lightning jumps from being improperly utilized by
forecasters using smaller increases in lightning activity
that are not significant enough to indicate a serious threat.
b. Limitations and Need for Further Research
In addition to the physical limitations of lighting jumps as
a storm predictor, there are many areas of focus where
there is little to no completed progress. The most
significant area is the actual development and deployment
of a system that forecasters nationwide can use to track
lightning jumps in real time. The most prominent limiting
factor for using lightning in operational severe weather
tracking is the lack of a space-based tracking method for
in-cloud lightning tracking. The launching of the GOES-
R’s GLM in 2016 will give lightning researchers a source
of high resolution lightning data that can be integrated
with other observational and model data to produce
improved real-time warning issuance. Previous projects
such as the TRMM satellite program, now terminated, had
limitations including maximum range north or south of
only 40˚ latitude. There is also a lack of awareness of the
importance and potential that lightning jumps contain, or
for that matter awareness of lightning jumps at all in much
of the meteorological community. The numbers of papers
that have received much attention from meteorologists or
the general public are few and far between. There is some
  	
   Shriver	
  5	


evidence, however, that lightning jumps are receiving
increasing interest within the past couple years. In June
of this year, a short video was published by The Weather
Channel on their website discussing the potential of
lightning jumps to predict thunderstorms (This video can
be found at http://wap.weather.com/video/lightning-
jumps-49517). This was rather surprising, given that
lightning jumps have received virtually no attention in
weather media.
Another area that needs more investigation is how well
lightning jumps can predict the most intense storms in a
given cluster. Identifying which cell in a group or line
will become the strongest could be crucial to warning
issuance and identifying the most dangerous storms early
on. Lightning jumps have also heavily been used in
correlation to severe weather, but there is not as much
attention given to the trends in other parameters that are
vital to storm intensity after a lightning jump is noted.
c. Concluding Remarks
While there are clear limitations to the potential of
lightning jumps as a forecasting tool, the research strongly
suggests that this potential is real and should not be
overlooked. The lack of prominent publications overall
suggests that there is much more to be done on this
subject, and that there needs to be more awareness in the
forecasting community of the lightning jump. Some
research reports are promising for the future of lightning
jumps, others not as much. Still, nearly all lightning
researchers agree that this is an important field of study,
and perhaps could be the beginnings of a breakthrough in
thunderstorm forecasting.
3. Methods
The primary sources of data for this investigation were
from a set of files containing storm cells identified and
tracked by the TITAN tracking system, listing the precise
latitude and longitude of the center of each cell as it
moved between each radar scan. In addition, the research
utilized two other files containing raw flash data from the
Northern Alabama LMA and the DFR/Dt, 2 𝜎 jump
algorithm values, and values for the most accurate jump
algorithm recently developed for each storm cell
analyzed. These files were processed by the same
methodology found in Schultz et al. (2009; 2011).
The information stored in the files was used in
conjunction with retrieved data from the National
Climactic Data Center (NCDC) for NEXRAD Level II
radar data. The radar data was loaded into the Gibson
Ridge data viewer to examine the hail and radar data from
two selected dates. The dates containing the studied
storm cells were August 5th
, 2011 and July 4th
, 2005. The
August 5th
set contained both cells that contained
lightning jumps and cells where no lightning jump was
recorded during the storm cell’s lifespan. The July 4th
case contained only cells containing lightning jumps. The
use of only lightning jump cells for this set was partly to
obtain more equal sample sizes for each cell type. The
July 4th
case also included cells that had a lack in severe
weather reports observed in spite of flash rate exceeding
well over 100 F min-1
. Thus one of the objectives of this
work is to examine trends in radar derived intensity
metrics to determine if the lightning jump provides any
insight into the future development of a thunderstorm.
Lightning jumps were identified using the 2σ technique
outlined in Schultz et al. (2009; 2011). For each cell in
the set of data the following basic statistics were recorded
based on radar data for each cell’s lifespan: the maximum
precipitation echo top, base elevation angle (0.5˚)
reflectivity maximum, maximum estimated hail size
(estimated by Gibson Ridge), and the maximum recorded
positive D/Dt of each metric, where D/Dt was measured
as the change in value between each set of radar scans.
The full scans are completed and plotted every 5 minutes.
A number of other statistics involving each of the three
storm metrics analyzed (base reflectivity, precipitation
echo top and estimated hail size) were taken for cases
with at least one lightning jump recorded in the dataset,
and a few additional behaviors were also documented in
the cells containing no lightning jumps during their active
(‘active’ referring to the period where storm cells
contained lighting flashes) lifetime.
For the additional data recorded for lightning jumps, most
involved local behavior of the storm metrics relative to
the time of the first lightning jump recorded in the storm.
Comparisons were made in the timing of the jump with
the timing of maximums in the metric values and
maximums in the D/Dt of each metric. For example, if a
storm cell had an observed lightning jump at 18:22 UTC,
the increase in hail size from the time of the jump to the
local maximum hail size estimated in the 20 minutes
following the jump was recorded. Information was also
gathered on the maximum echo tops and reflectivity
values for other cells that fell within 30 nautical miles of
the storm center at each time interval. The reason for
investigating the maximum values in these other cells was
to compare the strength of the studied storm cells to the
strength of other cells nearby.
  	
   Shriver	
  6	


Once the entire set of 35 cells (14 with lightning jumps,
21 with no jumps) was fully analyzed with the jump ratio,
TITAN storm tracking and NEXRAD Level II radar data,
the averages for each statistic were found for the set of
cells containing lightning jumps and for the set of cells
containing no lightning jumps in the dataset. The total
number of cells of each type (Jump and non-jump cells)
where the cell contained the highest, second highest and
third highest maximum echo tops out of all cells falling
within 30 nautical miles of the studied storm’s center
were also counted. The number of cells that did not
contain a top three maximum echo top was also
determined for both cell types. The total statistics were
then thoroughly compared and graphed to clearly
visualize the data.
4. Results Description
The results were mostly consistent with the general
expectations, although there were some signals from the
metrics that were either more or less definitive than what
was anticipated. The total set of 35 cases contained a few
outliers as well, such as a cell that had a maximum
estimated hail size of 2.77 inches in diameter, well above
the maximum recorded in any other cell in the entire set
of cells examined. The majority of cells that were
determined to contain at least one lighting jump had
overall higher maximum reflectivity values, echo tops,
and maximum expected hail sizes. The D/Dt maxes also
tended to be higher in cells containing one or more jumps,
however the timing of the maximum D/Dt was often
roughly 3 minutes prior to the instance of the first
lightning jump recorded in the cell’s lifespan. The results
from the strength comparison to other local storm cells
were fairly mixed, with different metrics indicating
different strength behaviors when compared to other cells
locally within 30 nautical miles of a studied storm.
a. Base Reflectivity
	
  
The highest total number of statistics was tracked for
reflectivity, given that this metric is most directly tied to
the overall storm strength.
Figure 4. Maximum positive rate of change of maximum-recorded reflectivity between each radar scan given in
change per 5-minute interval. The averages over each cell type are plotted to the right, indicating that cells
containing lightning jumps averaged a higher maximum increase in reflectivity than ordinary cells containing no
jumps, despite the outlier in the non-jump cases appearing on the right side of the plot.
Out of all three storm metrics studied, the lowest elevation
base reflectivity showed the strongest correlation between
the time the maximum was noted in relation to the a
lightning jump and the value of the maximum recorded.
Each of the statistics calculated in tables 1 and 2 were
chosen to be included based on their importance to the
storm’s intensity both over the entire life of each cell, and
for cells with lightning jumps, the behavior of the
  	
   Shriver	
  7	


reflectivity right around the time the first jump in the cell
was recorded. Most of the results from testing reflectivity
were similar to what was initially anticipated, with a few
exceptions. The difference between the highest
reflectivity recorded in a tracked cell and the highest
recorded in other cells surrounding a tracked cell was
oddly lower overall for cells containing no lightning
jumps. The expectation was that cells with jumps would
tend to get stronger than cells surrounding them, though
this does not appear to support this hypothesis. The
explanation for the negative lead-time of lightning jumps
for the highest rate of change recorded was unclear at
first, until further consideration of the requirements for a
jump to occur. (Further discussion of this can be found in
section 6.)
One of the most remarkable observations is that nearly all
cells that contained a jump reached 60 dBZ at some point
during their lifetime. In contrast, almost no cells reached
this value for the cases containing no jumps. The 60 dBZ
threshold was used as a rough estimate for determining
whether a storm contains a significant mass of ice and
hail, indicating most of the cells containing lightning
jumps likely did contain some amount of hail reaching the
surface. Overall the results from this portion of the
dataset indicate that cells with lightning jumps were
generally reaching higher reflectivity values and higher
rates of increase than cells that contained no jumps. The
reflectivity metric, however, did not appear to support the
hypothesis that lightning jumps help identify the strongest
storm in a given cluster of cells.
Figure 5. Peak reflectivity recorded during each cell containing lightning jump(s) plotted with the reflectivity value
on the y-axis and the time elapsed from the instance of the first lightning jump to the time of peak reflectivity on the x-
axis. The trend line indicates a positive correlation between the time relative to the lightning jump and the value of the
peak reflectivity recorded.
  	
   Shriver	
  8	


Average
+DR/Dt
maximum
Percent of
cases
reaching
+DR/Dt of
10 dBZ or
higher
Average
global
maximum
reflectivity
Percent of
cells
reaching
60 dBZ or
higher
Percent of
cells
where
maximum
ref. was
highest
local max
Average
difference for
cell’s max ref. and
highest ref in
surrounding cells
Lightning
Jump Cells
8.86 dBZ/5
minutes
35.71% 61.29 dBZ 78.57% 21.43% -2.00 dBZ
Non-Jump
Cells
6.38 dBZ/5
minutes
14.29% 58.52 dBZ 14.29% 28.57% -1.19 dBZ
Table 1. Statistical figures recorded for both cells with no lightning jumps and cells containing at least one lightning
jump. For clarification, the last column depicts the average difference between the maximum reflectivity recorded in a
studied cell and the maximum reflectivity recorded in any cell within 30 nautical miles from the center of a studied cell.
For example, if a storm moved from the east to the west side of Huntsville between two 5 minute scans, the highest
reflectivity in any other cell 30 nautical miles from the starting point on the east side would be noted. Then 5 minutes
later the highest reflectivity in 30 nautical miles would be noted. The highest value out of these areal searches would
then be compared to the highest value recorded in the cell being tracked.
Average time
elapsed prior
to DR/Dt max
from instance
of lightning
jump
Average time
elapsed from
instance of
jump to max
reflectivity
Average time
elapsed from
instance of
jump to
reaching 60
dBZ
Average +20
minute local
maximum ref.
after instance
of jump
Average
increase/decre
ase in ref. from
time of jump
to 20 minute
max
Lightning
Jump Cells
-2.85 minutes 8.08 minutes 6.55 minutes* 59.43 dBZ +4.39 dBZ
Table 2. Statistics taken only for cells with 1 or more lightning jump(s) found during their lifespan. Note that the
negative value for the first column indicates that the maximum rate of change occurred prior to any lightning jump, on
average. *Only includes cells where reflectivity reached at least 60 dBZ in the calculation.
b. Precipitation Echo Tops
The total statistical data recorded for Echo tops was
slightly smaller in amount9 than for reflectivity, but was
nonetheless an important metric to analyze due to its
significance to storm and updraft strength.
Percent of cells
containing top 3 highest
local top
Average +DE/Dt
maximum
Average global maximum
echo top
Lightning Jump Cells 85.71% 8.25K ft. / 5 minutes 50.43K ft.
Cells with No Jumps 57.14% 7.93K ft. / 5 minutes 44.95K ft.
Table 3. Echo top statistics recorded for both cells containing lightning jumps and cells containing no jumps during their lifespan.
To clarify, the first column indicates the percentage of cases where the maximum echo top was one of the 3 highest recorded
maximum echo tops for all cells lying within 30 nautical miles of a studied cell.
  	
   Shriver	
  9	


Figure 7. Maximum echo top recorded during each cell’s lifespan plotted against the time of time elapsed from the
instance of the first lightning jump recorded in each cell and the time of the maximum echo top recorded. The trend
line reveals a very weak positive correlation between time of maximum echo top relative to a lightning jump and
height of maximum echo recorded during a given cell’s lifetime.
Figure 6. Maximum echo top recorded during each cell’s lifespan. The averages are plotted at right, as is done
in fig. 4, indicating cells containing lightning jumps favor slightly higher maximum echo tops than cells
containing no jumps. Note one non-jump cell was omitted from this dataset due to the cell’s proximity to the
radar site and resulting interference with the echo top. The interference was due to lack of data above a certain
elevation in the “cone of silence” where even the maximum elevation angle scans do not reach
  	
   Shriver	
  10	


Average
increase
in echo
top from
instance
of jump
to +20
minute
max
Average
time
from
instance
of jump
to time
of
highest
+DE/Dt
Average
time
from
instance
of jump
to time
of
global
max
echo top
Average
+/-20
minute
maximum
echo
relative to
lightning
jump
Lightning
Jump
Cells
+5.71K
ft.
-3.37
minutes
8.21
minutes
49.95 ft.
Table 4. Echo top statistics recorded for cells containing
lightning jumps only.
The echo tops were of particular interest with this
investigation, given that the elevation of the top of the
storm cloud in a thunderstorm is closely connected with
the updraft strength of the storm. The momentum carried
in an updraft will determine the ability of the updraft to
continue past the equilibrium level at the top of an
unstable layer. Hence storms with stronger updrafts will
tend to have both higher cloud tops and precipitation echo
tops in radar data. Again, much of the results in the echo
top set were similar to the expectations of having higher
values for storms containing lightning jumps.
There is a rather interesting indication from the
comparison of the echo tops in each cell examined to the
echo tops of other cells nearby. Most of the cells
containing a lightning jump fell inside the top 3 highest
local maximum echoes recorded within 30 nautical miles
of each studied cell, where as only a little more than half
of the non-jump cases were in the top 3. This indicated
cells with lightning jumps were more likely to have a
highest echo top, and consequently stronger overall peak
storm and/or updraft strength. This is on the contrary to
what the reflectivity metric indicated about storm strength
in comparison to other local cells. (Details on these
findings are outlined in section 6.)
c. Expected Hail Size
The hail size estimated by the Gibson Ridge software was
analyzed the least thoroughly, mainly due to its lack of
having a consistent tracking indicator in Gibson Ridge
and problems with accuracy of expected hail size in
comparison to on-the-ground storm reports.
Figure 8. Maximum expected hail size recorded for all cells, with the threshold for severe hail size overlaid with this chart. The
averages are plotted as dots to the far left. The cells containing lightning jumps showed a significantly higher incidence of cells
with severe hail size estimated, along with a much higher overall average maximum recorded. Note 4 cells that were non-jump
cases marked as zero did not reach the minimum tracking threshold in Gibson Ridge and were also not included in the average
calculations.
  	
   Shriver	
  11	


Figure 9. Maximum hail size recorded plotted against the time the maximum was recorded relative to the time of the first
lightning jump in a given cell. Note that the outlier value of 2.77 appears to be heavily impacting the trend line, which shows an
overall slightly negative relation between maximum hail size and the time it occurred relative to a lightning jump.
Average maximum estimated hail size
(Diameter in inches)
Percent of cells reaching severe
(>= 1.00” diameter) threshold
Lightning Jump Cells 1.51” 85.71%
Cells with No Jumps 1.01”* 42.86%
Table 5. Statistics calculated for both cells with lightning jumps and cells with no jumps for estimated hail sizes. *5
cells with no jump did not reach the tracking threshold of roughly 0.5” diameter, and were not included in the average
calculation.
Average
increase in
hail size from
jump to local
+20 min. max
Avg. Local
+20 min
hail size
relative to
jump
Pcnt. of cells
with jump
occurring
before
severe
Avg. time
elapsed from
instance of
jump to
severe
Avg. time
elapsed from
instance of
jump to global
max
Pcnt. of cells
where jump
occurred before
max
Lightning
Jump Cells
+0.51”
diameter
1.38”
diameter
21.43% -4.67 minutes 2.21 minutes 64.29%
Table 6. Statistics calculated for cells containing lightning jump(s) only. Note that two cells did not reach the severe
threshold and are not part of the calculation in column 4.
The hail size estimates saw the most varied but also some
of the most decisively positive results in the study.
Remarkably, storms with lightning jumps on average
contained a maximum estimated hail size half an inch
larger in diameter than cells containing no jumps. The
percentage of cells containing lightning jumps that had
maximum hail sizes estimated above the severe hail
threshold of 1 inch in diameter was also roughly double
the percentage for non-jump cells. Given that stronger
  	
   Shriver	
  12	


updrafts are needed to keep larger hail sizes airborne,
these results strongly support the hypothesis that cells
with lightning jumps tend to become stronger cells,
although it is important to remember that these are only
estimated hail sizes, which may differ from confirmed
spotter or public reports that would confirm or deny the
existence of the indicated hail sizes.
The results from the hail analysis also have some
marginally negative results, as is depicted in figure 9. The
plot showing timing of a jump in comparison to the timing
of maximum hail size shows that 5 of 14 cases had their
maximum hail size recorded prior to any jump occurring.
The trend between hail size and time elapsed from a
lightning jump also appears to be slightly negative,
although the outlier of 2.77” diameter hail estimated in
one of the cases may be greatly altering this trend line,
particularly given that there are only 14 cases plotted to
begin with.
6. Results Interpretation
The majority of the results found were consistent with
what was initially anticipated, although some of the
findings were somewhat surprising at first. In particular,
the original expectation for the maximum positive rate of
change for each metric studied was that the maximum
would generally occur shortly after the observation of a
lightning jump. However, the actual findings indicated
that each metric tended to have a maximum rate of change
roughly 3 minutes prior to the instance of any lightning
jumps being observed in each cell. This is best explained
by considering the conditions required for a lightning
jump’s existence. In order for a rapid increase in lightning
activity to occur, a substantial mass of ice must be present
in the storm due to the importance of ice crystals in the
ionization of particles within the cloud mass. Typically a
considerably strong updraft is necessary in order for vast
quantities of ice to develop from liquid water droplets or
supercooled droplets becoming lifted far enough above
the freezing level to become ice crystals. During the
development of an updraft, an exchange of mass occurs
between small ice crystals and larger graupel, giving both
particles a net charge. The smaller and lighter negatively
charged ice crystals are pushed to the top of the storm by
the updraft while the positively charged graupel stays
lower down due to having a higher terminal fall speed.
Eventually the difference in electric potential between the
two masses of charged particles in enough to initiate a
lightning strike between the electric fields. This helps to
understand the behavior of the storm shortly before a
lightning jump; strengthening of the updraft in the core of
the storm must occur prior to a jump to allow a stronger
charged fields of particles to develop and for more
frequent flash rates to occur. This would also help
explain the existence of severe hail estimates before
lightning jumps. These larger Gibson Ridge hail size
estimates were likely coming from high reflectivity values
and vertically integrated liquid values at the uppermost
portions of the storm, where a high mass of ice would
already be present with hailstones possibly forming aloft.
Overall the results show that strengthening is occurring
both before and after a lightning jump, and that the
metrics tend to reach their peak values after the first
recorded jump in a given cell. However, there are
conflictions in the data for indicating whether a given cell
with an observed lightning jump is more likely to be the
strongest storm within a cluster of cells. Comparison of
echo tops to surrounding cells yielded a distribution in the
graphic below indicated that storms containing jumps
were indeed more likely to be one of the strongest echo
tops within 30 nautical miles of the cell’s center.
The figure shows both actual cell counts and a corrected
version of the distribution comparison to account for the
difference in the number of cells containing jumps and
cells not containing jumps. Note that even the unadjusted
values for lightning jump cases exceed the number of
non-jump cases in column one. The number of cells that
contained the second highest local maximum echo top is
more equal in comparison for both the adjusted and raw
figures. The number of cells for both cell types having
the third highest top is also substantially lower than in
either of the first two columns. This could be partly
because not all storms analyzed even had more than one
or two other storm cells present in their surroundings,
meaning some cells would be guaranteed to have an echo
top in the top three highest storm tops. However, the
number of cells that did not contain one of the highest
three storm tops shows the clearest indication that cells
containing lightning jumps were much more likely to have
higher storm tops. Very few cells with jumps did not
contain a top three echo, yet more than a third of the total
non-jump cases did not contain one of the highest echo
tops. This strongly suggests that the updrafts needed to
propel hydrometeors to their maximum height were
generally stronger in storm cells containing lightning
jumps. This is also consistent with the requirement for a
higher ice mass in storms with higher amounts of
lightning activity, with stronger updrafts yielding higher
cloud tops with a greater depth of clouds composed of ice
crystals.
  	
   Shriver	
  13	


Figure 10. Distribution for cells containing the first, second and third highest maximum echo top out of all cells within 30
nautical miles of the studied cell. The last column shows the number of cells for each type that did not contain a maximum echo
top in the three highest locally recorded echoes. The dashed line for the lightning jump-containing cells is a corrected distribution
for the unequal number of cells that contained jumps and cells that did not. 14 cells contained jumps and 21 did not, hence the
corrected distribution effectively adds about 7 more cases by multiplying each jump column by 1.5 to estimate a fair comparison.
The results from comparing the highest reflectivity
recorded in a studied cell to the highest reflectivity values
in surrounding cells seemingly did not agree with the
indications from the echo top analysis. The average storm
cell, whether it contained a lightning jump or not, tended
to have another cell nearby that at some point reached a
slightly higher maximum base reflectivity. However, as
the following figure shows, the cells containing lightning
jumps were slightly more likely to have an even lower
maximum reflectivity than the maximum in surrounding
storm cells than for cells that showed no jumps.
The tendency for cells containing jumps to have lower
reflectivity values than surrounding cells by a larger
amount than for cells that did not contain jumps appears
to be a negative result at face value. However, there is
also a large outlier in the lightning jump case of -12.5 dB,
which is largely weighing down the average. Removing
this case from the average gives a result that is more
comparable to the non-jump storms. It is also important
to note that this study only looked at the very strongest
reflectivity in the local area of a studied cell. An average
of the maximum reflectivity values of all identifiable
storm cells nearby may have given a more representative
strength of the typical storm cell in a given cluster of
storms. It is also quite possible that a few other storms
nearby to the studied cells also contained lightning jumps.
Given that lightning jumps can indeed identify the
strongest storms in a cluster, it would be quite plausible
that these cells would frequently contain higher
reflectivity values. Hence the results from this portion of
the analysis are somewhat inconclusive given these
complications. It also might have been quite helpful to
omit reflectivity values recorded in local storms that also
contained jumps with a similar comparison without data
from other jumps.
The vast majority of the other results not yet discussed
from the statistical comparisons show an overall positive
result in that they indicate storms containing lightning
jumps were more likely to see more rapid strengthening,
strengthen to a maximum after a lightning jump and were
possibly more likely to become stronger than most nearby
storm cells. In general, strengthening was occurring prior
to a jump occurring, but as outlined earlier, this is an
expectable observation given the requirements for
lightning initiation to occur. Further testing is still needed
to better define the exact correlation between lightning
jumps and storm strength, which could include using a
similar approach to this study with a much larger sample
size.
  	
   Shriver	
  14	


Figure 11. Difference between the highest reflectivity value recorded in each studied cell and the highest
reflectivity recorded in any cell 30 nautical miles from a studied cell’s center. The center point of the circular
area searched for adjacent storm cells moved with each updated position of the storm on radar. The highest
value of any of the areas searched was then compared to the maximum reflectivity recorded in the studied cell.
The zero values indicate cases where the maximum reflectivity was tied with at least one other local cell’s
maximum reflectivity. The averages are plotted to the right side, both below zero. The below zero values
represent cases where the studied cell did not contain the strongest reflectivity in the area, and the positive
values indicate cells containing the highest reflectivity out of all local storm cells.
7. Conclusions
In summary, lightning jumps have the potential to predict
both the development of severe weather and are likely an
indicator of unusually rapid storm growth. The three
selected metrics for the study all showed support for the
hypothesis that lightning jumps can predict both storm
strengthening, and to a degree, stronger storms in a given
storm cluster. Despite some slightly mixed indications
from the data, the consensus was that storm cells
containing jumps were more likely to grow faster and
reach higher values for each of the three metrics
examined. The results generally support the expectations
underlying the theory that lightning jumps can be used to
identify rapidly growing storms with higher severe
potential. This study indicates, in addition to the work
completed by Schultz et .al (2009; 2011) and other
studies, the true usefulness of lightning jumps as a
forecasting tool. If an effective method of quickly and
accurately identifying jumps in real time is developed, it
could aid in the decision-making stages of issuing severe
weather warnings and alerting forecasters of storms that
are growing very quickly and could soon become strong
or severe.
It is important to note that this study is should be a key
addition in the current database of research for truly
understanding the relationship between lightning jumps
and thunderstorm behavior. The need for expanding or
elaborating on this and other studies is still evident,
particularly given some of the conflicts in the data where
the sources of the conflicts are sometimes not readily
identifiable. Further research may take a similar approach
to that of this investigation, although it would likely
consist of a more in-depth analysis with a larger sample
size and more storm metrics to be examined. The more
completely and accurately lightning jumps can be
understood, the more useful they will be to forecasters.
The usefulness of lightning jumps in warning issuance has
already been demonstrated in case examples such as the
February 6th
, 2008 tornado outbreak. The rapid increasing
  	
   Shriver	
  15	


trends in lightning density from the LMA in Alabama
helped aid in several forecasters’ confidence in issuing
early warnings on one of the many storm cells that
developed on this date. A lightning jump occurred in the
cell 17 minutes before a tornado touched down, quickly
growing to EF-4 strength (Darden et al. 2012). If this
type of successful application of lightning jumps can be
utilized so well once, it can likely be used again. The
potential for lightning jumps to become a vital tool in
forecasting in the very near future appears promising.
8. Acknowledgments
This paper acknowledges Chris Shultz as a major
contributor to this project by allowing access to his pre-
processed datasets and for helping the author to define the
best approach to testing the relation between lightning
jumps and thunderstorms. This study was also completed
under the advising and guidance of Dr. T.C. Chen and
William Gallus, who helped the project stay on a working
schedule and provide suggestions for improvement for the
final copy of this report. The study also would like to
thank the NCDC, LMA and NLDN for providing data
necessary for the completion of the project and for flash
rate data used in the jump ratio algorithm.
9. References Cited
Arthur Witt, Michael D. Eilts, Gregory J. Stumpf, E. De Wayne
Mitchell, J. T. Johnson, and Kevin W. Thomas, 1998:
Evaluating the Performance of WSR-88D Severe
Storm Detection Algorithms. Wea. Forecasting, 13,
513–518.
doi: http://dx.doi.org/10.1175/1520-
0434(1998)013<0513:ETPOWS>2.0.CO;2
Christopher B. Darden, David J. Nadler, Brian C. Carcione,
Richard J. Blakeslee, Geoffrey T. Stano, and Dennis E.
Buechler, 2010: Utilizing Total Lightning Information
to Diagnose Convective Trends. Bull. Amer. Meteor.
Soc., 91, 167–175.
doi: http://dx.doi.org/10.1175/2009BAMS2808.1
Christopher J. Schultz, Walter A. Petersen, and Lawrence D.
Carey, 2011: Lightning and Severe Weather: A
Comparison between Total and Cloud-to-Ground
Lightning Trends. Wea. Forecasting, 26, 744–755.
doi: http://dx.doi.org/10.1175/WAF-D-10-05026.1
Chronis, T., L. D. Carey, C. J. Schultz, E. V. Schultz and K. M.
Calhoun, 2014: Exploring lightning jump
characteristics. Wea. and Forecasting, accepted, in
press
C. P. R. Saunders, 1993: A Review of Thunderstorm
Electrification Processes. J. Appl. Meteor., 32, 642–
655.
doi: http://dx.doi.org/10.1175/1520-
0450(1993)032<0642:AROTEP>2.0.CO;2
LaPenta, K. D., L. F. Bosart, T. J. Galarneau, and M. J.
Dickinson, 2005: A multiscale examination of the 31
May 1998 Mechanicsville, New York, tornado.Wea.
Forecasting, 20, 494–516
Livingston, I., cited 2014: Can Lightning Help Predict
Tornadoes? A D.C. Area Case may shed some light.
[Available online at
http://www.washingtonpost.com/blogs/capital-
weather-gang/post/can-lightning-help-predict-
tornadoes-a-dc-area-case-may-shed-some-
light/2012/12/07/12cce3f0-400a-11e2-bca3-
aadc9b7e29c5_blog.html]
Robert J. Trapp, Gregory J. Stumpf, and Kevin L. Manross,
2005: A Reassessment of the Percentage of Tornadic
Mesocyclones. Wea. Forecasting, 20, 680–687.
doi: http://dx.doi.org/10.1175/WAF864.1
Schultz, J., Walter A. Petersen, Lawrence D. Carey, 2009:
Preliminary Development and Evaluation of Lightning
Jump Algorithms for the Real-Time Detection of
Severe Weather. J. Appl. Meteor. Climatol., 48, 2543–
2563.
doi: http://dx.doi.org/10.1175/2009JAMC2237.1
Smoot, J., John Hall, cited 2014: Northern Alabama Lightning
Mapping Array.
[Available online at
http://branch.nsstc.nasa.gov/PUBLIC/NALMA/]
Ware, P., G. Stumpf, K. Calhoun, K. Ortega, 2012: Evaluation
of a Lightning Jump Algorithm with High Resolution
Storm Reports. Report, National Weather Center
Research for Undergraduates, 12 pp.

More Related Content

What's hot

Cyclone storm prediction using knn
Cyclone storm prediction using knnCyclone storm prediction using knn
Cyclone storm prediction using knnpriya veeramani
 
Paper id 71201909
Paper id 71201909Paper id 71201909
Paper id 71201909IJRAT
 
IAHR 2015 - SWAN's underestimation of long wave penetration into coastal syst...
IAHR 2015 - SWAN's underestimation of long wave penetration into coastal syst...IAHR 2015 - SWAN's underestimation of long wave penetration into coastal syst...
IAHR 2015 - SWAN's underestimation of long wave penetration into coastal syst...Deltares
 
Öncel Akademi: İstatistiksel Sismoloji
Öncel Akademi: İstatistiksel SismolojiÖncel Akademi: İstatistiksel Sismoloji
Öncel Akademi: İstatistiksel SismolojiAli Osman Öncel
 
Capstone Poster Design 4-23
Capstone Poster Design 4-23Capstone Poster Design 4-23
Capstone Poster Design 4-23Trevor Bengtsson
 
Detection of Radio Emission from Fireballs
Detection of Radio Emission from FireballsDetection of Radio Emission from Fireballs
Detection of Radio Emission from FireballsCarlos Bella
 
Publications_Sensors_Q1
Publications_Sensors_Q1Publications_Sensors_Q1
Publications_Sensors_Q1凯 郭
 
Publication_Draft_09Aug
Publication_Draft_09AugPublication_Draft_09Aug
Publication_Draft_09AugKevin Schmidt
 

What's hot (12)

Cyclone storm prediction using knn
Cyclone storm prediction using knnCyclone storm prediction using knn
Cyclone storm prediction using knn
 
Paper id 71201909
Paper id 71201909Paper id 71201909
Paper id 71201909
 
IAHR 2015 - SWAN's underestimation of long wave penetration into coastal syst...
IAHR 2015 - SWAN's underestimation of long wave penetration into coastal syst...IAHR 2015 - SWAN's underestimation of long wave penetration into coastal syst...
IAHR 2015 - SWAN's underestimation of long wave penetration into coastal syst...
 
Weather jun02
Weather jun02Weather jun02
Weather jun02
 
poster_7.4_Sulskis
poster_7.4_Sulskisposter_7.4_Sulskis
poster_7.4_Sulskis
 
Öncel Akademi: İstatistiksel Sismoloji
Öncel Akademi: İstatistiksel SismolojiÖncel Akademi: İstatistiksel Sismoloji
Öncel Akademi: İstatistiksel Sismoloji
 
Capstone Poster Design 4-23
Capstone Poster Design 4-23Capstone Poster Design 4-23
Capstone Poster Design 4-23
 
Poster_AMS_2016
Poster_AMS_2016Poster_AMS_2016
Poster_AMS_2016
 
defesaEvandro
defesaEvandrodefesaEvandro
defesaEvandro
 
Detection of Radio Emission from Fireballs
Detection of Radio Emission from FireballsDetection of Radio Emission from Fireballs
Detection of Radio Emission from Fireballs
 
Publications_Sensors_Q1
Publications_Sensors_Q1Publications_Sensors_Q1
Publications_Sensors_Q1
 
Publication_Draft_09Aug
Publication_Draft_09AugPublication_Draft_09Aug
Publication_Draft_09Aug
 

Viewers also liked

Transform Your Vaping Experience
Transform Your Vaping ExperienceTransform Your Vaping Experience
Transform Your Vaping Experiencevapingman
 
Structural Mechanism for the Fidelity Modulation of DNA Polymerase λ
Structural Mechanism for the Fidelity Modulation of DNA Polymerase λStructural Mechanism for the Fidelity Modulation of DNA Polymerase λ
Structural Mechanism for the Fidelity Modulation of DNA Polymerase λMu-Sen Liu
 
No strings attached - a white paper by HP and Staples
No strings attached - a white paper by HP and StaplesNo strings attached - a white paper by HP and Staples
No strings attached - a white paper by HP and StaplesStaples Advantage Europe
 
Repositorios web
Repositorios webRepositorios web
Repositorios webYesse94
 
Pablo garcía velasco práctica 1
Pablo garcía velasco práctica 1Pablo garcía velasco práctica 1
Pablo garcía velasco práctica 1pepe garcia
 
Leading Suppliers Of The Kilo Black Series
Leading Suppliers Of The Kilo Black SeriesLeading Suppliers Of The Kilo Black Series
Leading Suppliers Of The Kilo Black Seriesvapingman
 
Remove virus infection
Remove virus infectionRemove virus infection
Remove virus infectionjames7070
 
Leading Seller of Kilo Black Series
Leading Seller of Kilo Black SeriesLeading Seller of Kilo Black Series
Leading Seller of Kilo Black Seriesvapingman
 
Schnell Idea newer brochure
Schnell Idea newer brochureSchnell Idea newer brochure
Schnell Idea newer brochureLee Disbury
 

Viewers also liked (16)

Transform Your Vaping Experience
Transform Your Vaping ExperienceTransform Your Vaping Experience
Transform Your Vaping Experience
 
Structural Mechanism for the Fidelity Modulation of DNA Polymerase λ
Structural Mechanism for the Fidelity Modulation of DNA Polymerase λStructural Mechanism for the Fidelity Modulation of DNA Polymerase λ
Structural Mechanism for the Fidelity Modulation of DNA Polymerase λ
 
Course_Project_pt_2
Course_Project_pt_2Course_Project_pt_2
Course_Project_pt_2
 
Placas Atronic
Placas AtronicPlacas Atronic
Placas Atronic
 
No strings attached - a white paper by HP and Staples
No strings attached - a white paper by HP and StaplesNo strings attached - a white paper by HP and Staples
No strings attached - a white paper by HP and Staples
 
3.1 actividadades de reflexion inicial
3.1 actividadades de reflexion inicial3.1 actividadades de reflexion inicial
3.1 actividadades de reflexion inicial
 
Griselda power
Griselda powerGriselda power
Griselda power
 
Repositorios web
Repositorios webRepositorios web
Repositorios web
 
Medios didácticos audiovisuales
Medios didácticos audiovisualesMedios didácticos audiovisuales
Medios didácticos audiovisuales
 
Pablo garcía velasco práctica 1
Pablo garcía velasco práctica 1Pablo garcía velasco práctica 1
Pablo garcía velasco práctica 1
 
Leading Suppliers Of The Kilo Black Series
Leading Suppliers Of The Kilo Black SeriesLeading Suppliers Of The Kilo Black Series
Leading Suppliers Of The Kilo Black Series
 
Remove virus infection
Remove virus infectionRemove virus infection
Remove virus infection
 
Leading Seller of Kilo Black Series
Leading Seller of Kilo Black SeriesLeading Seller of Kilo Black Series
Leading Seller of Kilo Black Series
 
Schnell Idea newer brochure
Schnell Idea newer brochureSchnell Idea newer brochure
Schnell Idea newer brochure
 
Forte Company Profile reg (2)
Forte Company Profile reg (2)Forte Company Profile reg (2)
Forte Company Profile reg (2)
 
Boutilier CEE 506 Project 2
Boutilier CEE 506 Project 2Boutilier CEE 506 Project 2
Boutilier CEE 506 Project 2
 

Similar to Senior Thesis FINAL DRAFT

Öncel Akademi: İstatistiksel Sismoloji
Öncel Akademi: İstatistiksel SismolojiÖncel Akademi: İstatistiksel Sismoloji
Öncel Akademi: İstatistiksel SismolojiAli Osman Öncel
 
PringleStretch&Bardossy_NHESS2014
PringleStretch&Bardossy_NHESS2014PringleStretch&Bardossy_NHESS2014
PringleStretch&Bardossy_NHESS2014Justin Pringle
 
NISAR NASA-ISRO Synthetic Aperture Radar (NISAR) Induced Seismicity
NISAR NASA-ISRO Synthetic Aperture Radar (NISAR) Induced SeismicityNISAR NASA-ISRO Synthetic Aperture Radar (NISAR) Induced Seismicity
NISAR NASA-ISRO Synthetic Aperture Radar (NISAR) Induced SeismicityDr. Pankaj Dhussa
 
NONLINEAR AUTOREGRESSIVE NETWORK WITH THE USE OF A MOVING AVERAGE METHOD FOR ...
NONLINEAR AUTOREGRESSIVE NETWORK WITH THE USE OF A MOVING AVERAGE METHOD FOR ...NONLINEAR AUTOREGRESSIVE NETWORK WITH THE USE OF A MOVING AVERAGE METHOD FOR ...
NONLINEAR AUTOREGRESSIVE NETWORK WITH THE USE OF A MOVING AVERAGE METHOD FOR ...ijaia
 
One–day wave forecasts based on artificial neural networks
One–day wave forecasts based on artificial neural networksOne–day wave forecasts based on artificial neural networks
One–day wave forecasts based on artificial neural networksJonathan D'Cruz
 
A Study of The Relationship Among Parameters of M/X Solar Flares via Associat...
A Study of The Relationship Among Parameters of M/X Solar Flares via Associat...A Study of The Relationship Among Parameters of M/X Solar Flares via Associat...
A Study of The Relationship Among Parameters of M/X Solar Flares via Associat...CSCJournals
 
Magnetic interaction of_a_super_cme_with_the_earths_magnetosphere_scenario_fo...
Magnetic interaction of_a_super_cme_with_the_earths_magnetosphere_scenario_fo...Magnetic interaction of_a_super_cme_with_the_earths_magnetosphere_scenario_fo...
Magnetic interaction of_a_super_cme_with_the_earths_magnetosphere_scenario_fo...Sérgio Sacani
 
Evidence for the_thermal_sunyaev-zeldovich_effect_associated_with_quasar_feed...
Evidence for the_thermal_sunyaev-zeldovich_effect_associated_with_quasar_feed...Evidence for the_thermal_sunyaev-zeldovich_effect_associated_with_quasar_feed...
Evidence for the_thermal_sunyaev-zeldovich_effect_associated_with_quasar_feed...Sérgio Sacani
 
Asteroid 2023 NT1: A Cautionary Tale
Asteroid 2023 NT1: A Cautionary TaleAsteroid 2023 NT1: A Cautionary Tale
Asteroid 2023 NT1: A Cautionary TaleSérgio Sacani
 
Hurricane Threat and Risk Analysis in Rhode Island
Hurricane Threat and Risk Analysis in Rhode IslandHurricane Threat and Risk Analysis in Rhode Island
Hurricane Threat and Risk Analysis in Rhode Islandriseagrant
 
TRACKING ANALYSIS OF HURRICANE GONZALO USING AIRBORNE MICROWAVE RADIOMETER
TRACKING ANALYSIS OF HURRICANE GONZALO USING AIRBORNE MICROWAVE RADIOMETERTRACKING ANALYSIS OF HURRICANE GONZALO USING AIRBORNE MICROWAVE RADIOMETER
TRACKING ANALYSIS OF HURRICANE GONZALO USING AIRBORNE MICROWAVE RADIOMETERjmicro
 
Christopher Yang Poster_NHedit
Christopher Yang Poster_NHeditChristopher Yang Poster_NHedit
Christopher Yang Poster_NHeditChristopher Yang
 
04 Mmitt 040599 Brief
04 Mmitt 040599 Brief04 Mmitt 040599 Brief
04 Mmitt 040599 Briefguest02f352
 
Pranav Conference Paper
Pranav Conference PaperPranav Conference Paper
Pranav Conference PaperPranav Keskar
 
DAQScienceTeamMeetingPosterV1
DAQScienceTeamMeetingPosterV1DAQScienceTeamMeetingPosterV1
DAQScienceTeamMeetingPosterV1Alex Kotsakis
 

Similar to Senior Thesis FINAL DRAFT (20)

AMS_Poster_Presentation
AMS_Poster_PresentationAMS_Poster_Presentation
AMS_Poster_Presentation
 
Öncel Akademi: İstatistiksel Sismoloji
Öncel Akademi: İstatistiksel SismolojiÖncel Akademi: İstatistiksel Sismoloji
Öncel Akademi: İstatistiksel Sismoloji
 
1MALD-Ltg Cessation-draft-b
1MALD-Ltg Cessation-draft-b1MALD-Ltg Cessation-draft-b
1MALD-Ltg Cessation-draft-b
 
PringleStretch&Bardossy_NHESS2014
PringleStretch&Bardossy_NHESS2014PringleStretch&Bardossy_NHESS2014
PringleStretch&Bardossy_NHESS2014
 
SeaSurfaceHeight
SeaSurfaceHeightSeaSurfaceHeight
SeaSurfaceHeight
 
NISAR NASA-ISRO Synthetic Aperture Radar (NISAR) Induced Seismicity
NISAR NASA-ISRO Synthetic Aperture Radar (NISAR) Induced SeismicityNISAR NASA-ISRO Synthetic Aperture Radar (NISAR) Induced Seismicity
NISAR NASA-ISRO Synthetic Aperture Radar (NISAR) Induced Seismicity
 
NONLINEAR AUTOREGRESSIVE NETWORK WITH THE USE OF A MOVING AVERAGE METHOD FOR ...
NONLINEAR AUTOREGRESSIVE NETWORK WITH THE USE OF A MOVING AVERAGE METHOD FOR ...NONLINEAR AUTOREGRESSIVE NETWORK WITH THE USE OF A MOVING AVERAGE METHOD FOR ...
NONLINEAR AUTOREGRESSIVE NETWORK WITH THE USE OF A MOVING AVERAGE METHOD FOR ...
 
One–day wave forecasts based on artificial neural networks
One–day wave forecasts based on artificial neural networksOne–day wave forecasts based on artificial neural networks
One–day wave forecasts based on artificial neural networks
 
A Study of The Relationship Among Parameters of M/X Solar Flares via Associat...
A Study of The Relationship Among Parameters of M/X Solar Flares via Associat...A Study of The Relationship Among Parameters of M/X Solar Flares via Associat...
A Study of The Relationship Among Parameters of M/X Solar Flares via Associat...
 
Magnetic interaction of_a_super_cme_with_the_earths_magnetosphere_scenario_fo...
Magnetic interaction of_a_super_cme_with_the_earths_magnetosphere_scenario_fo...Magnetic interaction of_a_super_cme_with_the_earths_magnetosphere_scenario_fo...
Magnetic interaction of_a_super_cme_with_the_earths_magnetosphere_scenario_fo...
 
Evidence for the_thermal_sunyaev-zeldovich_effect_associated_with_quasar_feed...
Evidence for the_thermal_sunyaev-zeldovich_effect_associated_with_quasar_feed...Evidence for the_thermal_sunyaev-zeldovich_effect_associated_with_quasar_feed...
Evidence for the_thermal_sunyaev-zeldovich_effect_associated_with_quasar_feed...
 
Asteroid 2023 NT1: A Cautionary Tale
Asteroid 2023 NT1: A Cautionary TaleAsteroid 2023 NT1: A Cautionary Tale
Asteroid 2023 NT1: A Cautionary Tale
 
Hurricane Threat and Risk Analysis in Rhode Island
Hurricane Threat and Risk Analysis in Rhode IslandHurricane Threat and Risk Analysis in Rhode Island
Hurricane Threat and Risk Analysis in Rhode Island
 
TRACKING ANALYSIS OF HURRICANE GONZALO USING AIRBORNE MICROWAVE RADIOMETER
TRACKING ANALYSIS OF HURRICANE GONZALO USING AIRBORNE MICROWAVE RADIOMETERTRACKING ANALYSIS OF HURRICANE GONZALO USING AIRBORNE MICROWAVE RADIOMETER
TRACKING ANALYSIS OF HURRICANE GONZALO USING AIRBORNE MICROWAVE RADIOMETER
 
Christopher Yang Poster_NHedit
Christopher Yang Poster_NHeditChristopher Yang Poster_NHedit
Christopher Yang Poster_NHedit
 
#5
#5#5
#5
 
04 Mmitt 040599 Brief
04 Mmitt 040599 Brief04 Mmitt 040599 Brief
04 Mmitt 040599 Brief
 
Pranav Conference Paper
Pranav Conference PaperPranav Conference Paper
Pranav Conference Paper
 
Buckles_research
Buckles_researchBuckles_research
Buckles_research
 
DAQScienceTeamMeetingPosterV1
DAQScienceTeamMeetingPosterV1DAQScienceTeamMeetingPosterV1
DAQScienceTeamMeetingPosterV1
 

Senior Thesis FINAL DRAFT

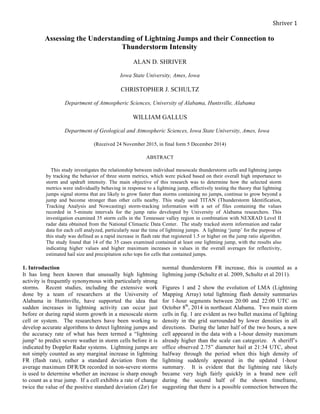
  • 1.     Shriver  1     Assessing the Understanding of Lightning Jumps and their Connection to Thunderstorm Intensity ALAN D. SHRIVER Iowa State University, Ames, Iowa CHRISTOPHER J. SCHULTZ Department of Atmospheric Sciences, University of Alabama, Huntsville, Alabama WILLIAM GALLUS Department of Geological and Atmospheric Sciences, Iowa State University, Ames, Iowa (Received 24 November 2015, in final form 5 December 2014) ABSTRACT This study investigates the relationship between individual mesoscale thunderstorm cells and lightning jumps by tracking the behavior of three storm metrics, which were picked based on their overall high importance to storm and updraft intensity. The main objective of this research was to determine how the selected storm metrics were individually behaving in response to a lightning jump, effectively testing the theory that lightning jumps signal storms that are likely to grow faster than storms containing no jumps, continue to grow beyond a jump and become stronger than other cells nearby. This study used TITAN (Thunderstorm Identification, Tracking Analysis and Nowcasting) storm-tracking information with a set of files containing the values recorded in 5-minute intervals for the jump ratio developed by University of Alabama researchers. This investigation examined 35 storm cells in the Tennessee valley region in combination with NEXRAD Level II radar data obtained from the National Climactic Data Center. The study tracked storm information and radar data for each cell analyzed, particularly near the time of lightning jumps. A lightning ‘jump’ for the purpose of this study was defined as a rapid increase in flash rate that registered 1.5 or higher on the jump ratio algorithm. The study found that 14 of the 35 cases examined contained at least one lightning jump, with the results also indicating higher values and higher maximum increases in values in the overall averages for reflectivity, estimated hail size and precipitation echo tops for cells that contained jumps. 1. Introduction It has long been known that unusually high lightning activity is frequently synonymous with particularly strong storms. Recent studies, including the extensive work done by a team of researchers at the University of Alabama in Huntsville, have supported the idea that sudden increases in lightning activity can occur just before or during rapid storm growth in a mesoscale storm cell or system. The researchers have been working to develop accurate algorithms to detect lightning jumps and the accuracy rate of what has been termed a “lightning jump” to predict severe weather in storm cells before it is indicated by Doppler Radar systems. Lightning jumps are not simply counted as any marginal increase in lightning FR (flash rate), rather a standard deviation from the average maximum DFR/Dt recorded in non-severe storms is used to determine whether an increase is sharp enough to count as a true jump. If a cell exhibits a rate of change twice the value of the positive standard deviation (2𝜎) for normal thunderstorm FR increase, this is counted as a lightning jump (Schultz et al. 2009, Schultz et al 2011). Figures 1 and 2 show the evolution of LMA (Lightning Mapping Array) total lightning flash density summaries for 1-hour segments between 20:00 and 22:00 UTC on October 8th , 2014 in northeast Alabama. Two main storm cells in fig. 1 are evident as two bullet maxima of lighting density in the grid surrounded by lower densities in all directions. During the latter half of the two hours, a new cell appeared in the data with a 1-hour density maximum already higher than the scale can categorize. A sheriff’s office observed 2.75” diameter hail at 21:34 UTC, about halfway through the period when this high density of lightning suddenly appeared in the updated 1-hour summary. It is evident that the lightning rate likely became very high fairly quickly in a brand new cell during the second half of the shown timeframe, suggesting that there is a possible connection between the
  • 2.     Shriver  2     increased lightning rate and the development of very large hail in the storm cell. It is important to note, however, that this particular example does not show what is really occurring on shorter time intervals. Though the lightning increases substantially in the hour summaries, the plots don’t reveal the minute-by-minute changes that occurred Figure 1. Lightning flash density for a 2x2 km resolution over the 1-hour period from 20 to 21 UTC on October 8th , 2014. Two clusters of high strike density indicate two distinct storm cells southwest of Huntsville. The bars above and to the right display the density of flashes between 0 and 20 km altitude through each north-south and east-west cross-section of the total domain. during each hour. Nevertheless, given that the increase is very large, it is very possible a jump did occur during the segment of time covered by the two summaries. This relationship between rapid increases in lightning activity often with anomalously high lightning rates and the development of severe weather has been supported by multiple recent studies (including Shultz et al. 2009;2011, LaPenta et al. 2005, Chronis et al. 2014, and Ware 2012). This study focused on extending previous research done by the University of Alabama (Schultz et al. 2009; 2011) on the connection between storm intensity and lightning jumps by analyzing two collections of thunderstorm cells in the KHTX Northern Alabama NEXRAD Level II radar range, as in the region shown in fig. 3. Figure 2. Lightning flash density from 21 to 22 UTC. A third cell appears to have developed with a large region of flash density exceeding 1000 flashes per 4 square kilometers. About halfway through the hour, 2.75” diameter hail is reported by a sheriff’s office located in Sommerville. (From Northern Alabama LMA, or Lightning Mapping Array) The purpose of this research is to investigate the responses in three selected storm metrics in the time vicinity of lightning jumps. The increased potential for severe weather following a lightning jump has been fairly well established as a true connection between lightning and storm intensity. However, the verification of the lightning jumps in previous studies was largely based on storm reports, which contain many flaws (e.g., timing, size, degree of damage; Witt et al. 1998, Ware et al. 2012, Trapp et al. 2005). Changes in the individual signals of growth in discrete storm cells from different metrics should provide a more reliable method by which one can compare storms to judge storm intensity. This analysis seeks to determine how well increases in base reflectivity, estimated hail size, and precipitation echo tops match up with observed lightning jumps in storm cells. This application would aid forecasters in picking out which storms were the most intense and potentially require a warning to be issued. In addition, the study attempts to test the effectiveness of lightning jumps to detect the strongest thunderstorms in a given cluster of cells by comparing peak values in the metrics to peaks in nearby storm cells. This study hypothesizes that if lightning
  • 3.     Shriver  3     jumps do tend to occur shortly prior to or during rapid storm growth, then the storm metrics should each show an increase in value in the time vicinity of lightning jumps. The results of this study should help researchers gain a better understanding of the exact connection between lightning and the behavior of thunderstorms. Figure 3. Region of study, KHTX NEXRAD Radar full range shown. Radar site is located in Hytop, AL near Huntsville. 2. Literature Review Despite the fact that the term “lightning jump” has only been recently used in publications concerning lightning behavior, there is substantial agreement amongst researchers on its basic definition. Lightning jumps are currently defined as a rapid increase in total lightning frequency in both individual convective storm cells and in cells embedded within linear storm segments or in a mesoscale convective system (MCS). Most published work on this phenomenon cites increasing updraft strength as the primary causation of these increases in lightning activity. The implications of lightning jumps concerning thunderstorm intensity are much more important to current and future research. Several research groups, including a team of scientists working closely with lightning jumps at the University of Alabama in Huntsville have conducted empirical investigations on the relationship between lightning jumps and storm strength (e.g, Schultz et al. 2009; 2011, Chronis et al. 2014). The consensus from most of the current research base is that lightning jumps frequently are followed by rapid intensification in overall storm strength, usually before this intensification appears on any radar scans of the storm. Exactly how frequently lightning jumps successfully predict intensification and the degree to which the jumps can predict a storm reaching severe levels is still slightly unclear. Studies dating back to the 1980s have found very mixed results, with some studies turning up with results less positive than from Schultz et. al (2009). For example, Knapp (1994) found no connection between increases cloud-to-ground lightning strikes and subsequent tornado development. Yet other investigations have found very promising connections between lightning and tornadogenesis. such as LaPenta et al. (2005). This study found large peaks in cloud-to- ground strikes about 25 minutes prior to a tornado touchdown in a severe thunderstorm in Mechanicville, NY. The more recent studies including Lapenta et al. (2005) have generally found more consistent positive correlations between increased lightning and tornado development. The application of lightning jumps in severe weather and storm forecasting is also still, at best, only in its earliest stages of development. a. Scope of Completed Research     The terminology used to describe the pronounced increase in lighting frequency is relatively new; most published articles and reports do not cite the term “lightning jump” earlier than about 2000. However, the theories that increase in lightning activity are related to thunderstorm strength and evolution is not at all new. It has been suggested by a multitude of research papers that there is a distinct connection between lightning behavior and thunderstorm updrafts, some dating back to the 1950s. However, much of this work, particularly less recent writings, emphasizes the same general conclusion: the exact relationship is unclear. I. Well-Supported Findings   There is a substantial collection of theories and hypotheses that the overwhelming majority of published work support on lighting jumps. The most important of these is the causation of lightning jumps. It has been demonstrated that the electrical fields that develop within thunderstorms is not fully possible without the presence of solid ice crystals in portions of the cloud. The physical derivation of the electrical fields precisely is greatly complex and is generally implied as a fairly low relevance to the subject of lightning jumps themselves.
  • 4.     Shriver  4     More crucial to this subject is another theory that follows almost directly form the importance of ice crystals to lightning initiation. Stronger updrafts will lift more mass of water vapor above the freezing level, leading to larger quantities of supercooled droplets and mass of ice crystals within the upper portions of a thunderstorm. Hence strengthening updrafts are frequently cited as causing an increase in lightning activity. Saunders (1993) outlines in great detail the importance of the updraft in a storm carrying negatively charged particles aloft in a thunderstorm. The heavier particles, which obtain an opposite charge after colliding with smaller ice crystals, tend to stay lower in the storm since they have a faster terminal fall speed. One of the leading scientists that contributed to Shultz et al. (2009;2011), Dr. Larry Carey, well states, “With the strong updraft you get hail, small ice and super-cooled water. Those are the three ingredients. Once you have those, you have electrification.” (Livingston, 2012) Another key theory much of the current literature discusses is that lightning jumps cannot discern severe weather types for predicting storms that produce severe weather. Although different lengths of time have been observed on average for different modes of severe weather, there is not enough consistency overall to use this as a diagnostic for expected severe weather type. II. Controversial Findings There are a few conclusions from various research reports on lightning jumps that conflict with conclusions found by other groups. Geophysicist Benjamin Barnum believes that lightning jumps can help predict tornadoes. He asserts that there is behavior in the rate of change of lightning frequency not observed in any other non- tornadic storms. “The rapid increase in lightning rates measured by the single point systems ... were nearly double or triple what we usually measured during other thunderstorms during this spring.” (Livingston, 2012) Other studies, such as Ware et al. (2012) found more mixed cases in the ability of jumps to predict severe weather events in general. Several of the cases they examined had severe hail recorded as much as 19 minutes prior to any lightning jumps, and other cells that successfully predicted severe hail and microbursts by several minutes. Ware et al. (2012) suggests that the accuracy of lightning jumps aiding in the prediction of severe storms is rather limited, and hence would likely be limited as well for predicting tornadoes. It is noteworthy, however, that this study mainly focused on hail alone and did not have a very large sample size, with only 18 total cells analyzed. There is also not necessarily enough evidence to substantially support the notion that lightning jumps have this capability to predict a type of severe weather with significant weight over another, although there is still growing support that lightning jumps can identify storms that have a higher chance of producing tornadoes and of all other severe weather types. Another area that is subject to dispute is the exact definition of a lighting jump itself. Some articles simply describe a lighting jump as a substantial increase in lightning activity. But substantial and an increase are very vague terminologies. How much of an increase in flash rate is enough to count as a jump? Shultz et al. (2009) has come up with a much more specific, but still not necessarily well agreed upon description of lighting jumps. “All thunderstorms will, by definition, exhibit at least one jump in lightning activity during their lifetime.” (Schultz et al. 2009) The team essentially says that every thunderstorm must have some increase in lightning activity, otherwise it wouldn’t be a thunderstorm; the lightning rate would never go above zero. Importantly, a true lightning jump must be defined as an exceptionally high and sharp increase in overall lightning FR. Rather than simply look for any marginal increase in lightning, specific thresholds are used to identify jumps such that the positive rate of change must surpass a set value to count as a jump that could be large enough to indicate an elevated severe potential. This, Schultz predicts, will help prevent lightning jumps from being improperly utilized by forecasters using smaller increases in lightning activity that are not significant enough to indicate a serious threat. b. Limitations and Need for Further Research In addition to the physical limitations of lighting jumps as a storm predictor, there are many areas of focus where there is little to no completed progress. The most significant area is the actual development and deployment of a system that forecasters nationwide can use to track lightning jumps in real time. The most prominent limiting factor for using lightning in operational severe weather tracking is the lack of a space-based tracking method for in-cloud lightning tracking. The launching of the GOES- R’s GLM in 2016 will give lightning researchers a source of high resolution lightning data that can be integrated with other observational and model data to produce improved real-time warning issuance. Previous projects such as the TRMM satellite program, now terminated, had limitations including maximum range north or south of only 40˚ latitude. There is also a lack of awareness of the importance and potential that lightning jumps contain, or for that matter awareness of lightning jumps at all in much of the meteorological community. The numbers of papers that have received much attention from meteorologists or the general public are few and far between. There is some
  • 5.     Shriver  5     evidence, however, that lightning jumps are receiving increasing interest within the past couple years. In June of this year, a short video was published by The Weather Channel on their website discussing the potential of lightning jumps to predict thunderstorms (This video can be found at http://wap.weather.com/video/lightning- jumps-49517). This was rather surprising, given that lightning jumps have received virtually no attention in weather media. Another area that needs more investigation is how well lightning jumps can predict the most intense storms in a given cluster. Identifying which cell in a group or line will become the strongest could be crucial to warning issuance and identifying the most dangerous storms early on. Lightning jumps have also heavily been used in correlation to severe weather, but there is not as much attention given to the trends in other parameters that are vital to storm intensity after a lightning jump is noted. c. Concluding Remarks While there are clear limitations to the potential of lightning jumps as a forecasting tool, the research strongly suggests that this potential is real and should not be overlooked. The lack of prominent publications overall suggests that there is much more to be done on this subject, and that there needs to be more awareness in the forecasting community of the lightning jump. Some research reports are promising for the future of lightning jumps, others not as much. Still, nearly all lightning researchers agree that this is an important field of study, and perhaps could be the beginnings of a breakthrough in thunderstorm forecasting. 3. Methods The primary sources of data for this investigation were from a set of files containing storm cells identified and tracked by the TITAN tracking system, listing the precise latitude and longitude of the center of each cell as it moved between each radar scan. In addition, the research utilized two other files containing raw flash data from the Northern Alabama LMA and the DFR/Dt, 2 𝜎 jump algorithm values, and values for the most accurate jump algorithm recently developed for each storm cell analyzed. These files were processed by the same methodology found in Schultz et al. (2009; 2011). The information stored in the files was used in conjunction with retrieved data from the National Climactic Data Center (NCDC) for NEXRAD Level II radar data. The radar data was loaded into the Gibson Ridge data viewer to examine the hail and radar data from two selected dates. The dates containing the studied storm cells were August 5th , 2011 and July 4th , 2005. The August 5th set contained both cells that contained lightning jumps and cells where no lightning jump was recorded during the storm cell’s lifespan. The July 4th case contained only cells containing lightning jumps. The use of only lightning jump cells for this set was partly to obtain more equal sample sizes for each cell type. The July 4th case also included cells that had a lack in severe weather reports observed in spite of flash rate exceeding well over 100 F min-1 . Thus one of the objectives of this work is to examine trends in radar derived intensity metrics to determine if the lightning jump provides any insight into the future development of a thunderstorm. Lightning jumps were identified using the 2σ technique outlined in Schultz et al. (2009; 2011). For each cell in the set of data the following basic statistics were recorded based on radar data for each cell’s lifespan: the maximum precipitation echo top, base elevation angle (0.5˚) reflectivity maximum, maximum estimated hail size (estimated by Gibson Ridge), and the maximum recorded positive D/Dt of each metric, where D/Dt was measured as the change in value between each set of radar scans. The full scans are completed and plotted every 5 minutes. A number of other statistics involving each of the three storm metrics analyzed (base reflectivity, precipitation echo top and estimated hail size) were taken for cases with at least one lightning jump recorded in the dataset, and a few additional behaviors were also documented in the cells containing no lightning jumps during their active (‘active’ referring to the period where storm cells contained lighting flashes) lifetime. For the additional data recorded for lightning jumps, most involved local behavior of the storm metrics relative to the time of the first lightning jump recorded in the storm. Comparisons were made in the timing of the jump with the timing of maximums in the metric values and maximums in the D/Dt of each metric. For example, if a storm cell had an observed lightning jump at 18:22 UTC, the increase in hail size from the time of the jump to the local maximum hail size estimated in the 20 minutes following the jump was recorded. Information was also gathered on the maximum echo tops and reflectivity values for other cells that fell within 30 nautical miles of the storm center at each time interval. The reason for investigating the maximum values in these other cells was to compare the strength of the studied storm cells to the strength of other cells nearby.
  • 6.     Shriver  6     Once the entire set of 35 cells (14 with lightning jumps, 21 with no jumps) was fully analyzed with the jump ratio, TITAN storm tracking and NEXRAD Level II radar data, the averages for each statistic were found for the set of cells containing lightning jumps and for the set of cells containing no lightning jumps in the dataset. The total number of cells of each type (Jump and non-jump cells) where the cell contained the highest, second highest and third highest maximum echo tops out of all cells falling within 30 nautical miles of the studied storm’s center were also counted. The number of cells that did not contain a top three maximum echo top was also determined for both cell types. The total statistics were then thoroughly compared and graphed to clearly visualize the data. 4. Results Description The results were mostly consistent with the general expectations, although there were some signals from the metrics that were either more or less definitive than what was anticipated. The total set of 35 cases contained a few outliers as well, such as a cell that had a maximum estimated hail size of 2.77 inches in diameter, well above the maximum recorded in any other cell in the entire set of cells examined. The majority of cells that were determined to contain at least one lighting jump had overall higher maximum reflectivity values, echo tops, and maximum expected hail sizes. The D/Dt maxes also tended to be higher in cells containing one or more jumps, however the timing of the maximum D/Dt was often roughly 3 minutes prior to the instance of the first lightning jump recorded in the cell’s lifespan. The results from the strength comparison to other local storm cells were fairly mixed, with different metrics indicating different strength behaviors when compared to other cells locally within 30 nautical miles of a studied storm. a. Base Reflectivity   The highest total number of statistics was tracked for reflectivity, given that this metric is most directly tied to the overall storm strength. Figure 4. Maximum positive rate of change of maximum-recorded reflectivity between each radar scan given in change per 5-minute interval. The averages over each cell type are plotted to the right, indicating that cells containing lightning jumps averaged a higher maximum increase in reflectivity than ordinary cells containing no jumps, despite the outlier in the non-jump cases appearing on the right side of the plot. Out of all three storm metrics studied, the lowest elevation base reflectivity showed the strongest correlation between the time the maximum was noted in relation to the a lightning jump and the value of the maximum recorded. Each of the statistics calculated in tables 1 and 2 were chosen to be included based on their importance to the storm’s intensity both over the entire life of each cell, and for cells with lightning jumps, the behavior of the
  • 7.     Shriver  7     reflectivity right around the time the first jump in the cell was recorded. Most of the results from testing reflectivity were similar to what was initially anticipated, with a few exceptions. The difference between the highest reflectivity recorded in a tracked cell and the highest recorded in other cells surrounding a tracked cell was oddly lower overall for cells containing no lightning jumps. The expectation was that cells with jumps would tend to get stronger than cells surrounding them, though this does not appear to support this hypothesis. The explanation for the negative lead-time of lightning jumps for the highest rate of change recorded was unclear at first, until further consideration of the requirements for a jump to occur. (Further discussion of this can be found in section 6.) One of the most remarkable observations is that nearly all cells that contained a jump reached 60 dBZ at some point during their lifetime. In contrast, almost no cells reached this value for the cases containing no jumps. The 60 dBZ threshold was used as a rough estimate for determining whether a storm contains a significant mass of ice and hail, indicating most of the cells containing lightning jumps likely did contain some amount of hail reaching the surface. Overall the results from this portion of the dataset indicate that cells with lightning jumps were generally reaching higher reflectivity values and higher rates of increase than cells that contained no jumps. The reflectivity metric, however, did not appear to support the hypothesis that lightning jumps help identify the strongest storm in a given cluster of cells. Figure 5. Peak reflectivity recorded during each cell containing lightning jump(s) plotted with the reflectivity value on the y-axis and the time elapsed from the instance of the first lightning jump to the time of peak reflectivity on the x- axis. The trend line indicates a positive correlation between the time relative to the lightning jump and the value of the peak reflectivity recorded.
  • 8.     Shriver  8     Average +DR/Dt maximum Percent of cases reaching +DR/Dt of 10 dBZ or higher Average global maximum reflectivity Percent of cells reaching 60 dBZ or higher Percent of cells where maximum ref. was highest local max Average difference for cell’s max ref. and highest ref in surrounding cells Lightning Jump Cells 8.86 dBZ/5 minutes 35.71% 61.29 dBZ 78.57% 21.43% -2.00 dBZ Non-Jump Cells 6.38 dBZ/5 minutes 14.29% 58.52 dBZ 14.29% 28.57% -1.19 dBZ Table 1. Statistical figures recorded for both cells with no lightning jumps and cells containing at least one lightning jump. For clarification, the last column depicts the average difference between the maximum reflectivity recorded in a studied cell and the maximum reflectivity recorded in any cell within 30 nautical miles from the center of a studied cell. For example, if a storm moved from the east to the west side of Huntsville between two 5 minute scans, the highest reflectivity in any other cell 30 nautical miles from the starting point on the east side would be noted. Then 5 minutes later the highest reflectivity in 30 nautical miles would be noted. The highest value out of these areal searches would then be compared to the highest value recorded in the cell being tracked. Average time elapsed prior to DR/Dt max from instance of lightning jump Average time elapsed from instance of jump to max reflectivity Average time elapsed from instance of jump to reaching 60 dBZ Average +20 minute local maximum ref. after instance of jump Average increase/decre ase in ref. from time of jump to 20 minute max Lightning Jump Cells -2.85 minutes 8.08 minutes 6.55 minutes* 59.43 dBZ +4.39 dBZ Table 2. Statistics taken only for cells with 1 or more lightning jump(s) found during their lifespan. Note that the negative value for the first column indicates that the maximum rate of change occurred prior to any lightning jump, on average. *Only includes cells where reflectivity reached at least 60 dBZ in the calculation. b. Precipitation Echo Tops The total statistical data recorded for Echo tops was slightly smaller in amount9 than for reflectivity, but was nonetheless an important metric to analyze due to its significance to storm and updraft strength. Percent of cells containing top 3 highest local top Average +DE/Dt maximum Average global maximum echo top Lightning Jump Cells 85.71% 8.25K ft. / 5 minutes 50.43K ft. Cells with No Jumps 57.14% 7.93K ft. / 5 minutes 44.95K ft. Table 3. Echo top statistics recorded for both cells containing lightning jumps and cells containing no jumps during their lifespan. To clarify, the first column indicates the percentage of cases where the maximum echo top was one of the 3 highest recorded maximum echo tops for all cells lying within 30 nautical miles of a studied cell.
  • 9.     Shriver  9     Figure 7. Maximum echo top recorded during each cell’s lifespan plotted against the time of time elapsed from the instance of the first lightning jump recorded in each cell and the time of the maximum echo top recorded. The trend line reveals a very weak positive correlation between time of maximum echo top relative to a lightning jump and height of maximum echo recorded during a given cell’s lifetime. Figure 6. Maximum echo top recorded during each cell’s lifespan. The averages are plotted at right, as is done in fig. 4, indicating cells containing lightning jumps favor slightly higher maximum echo tops than cells containing no jumps. Note one non-jump cell was omitted from this dataset due to the cell’s proximity to the radar site and resulting interference with the echo top. The interference was due to lack of data above a certain elevation in the “cone of silence” where even the maximum elevation angle scans do not reach
  • 10.     Shriver  10     Average increase in echo top from instance of jump to +20 minute max Average time from instance of jump to time of highest +DE/Dt Average time from instance of jump to time of global max echo top Average +/-20 minute maximum echo relative to lightning jump Lightning Jump Cells +5.71K ft. -3.37 minutes 8.21 minutes 49.95 ft. Table 4. Echo top statistics recorded for cells containing lightning jumps only. The echo tops were of particular interest with this investigation, given that the elevation of the top of the storm cloud in a thunderstorm is closely connected with the updraft strength of the storm. The momentum carried in an updraft will determine the ability of the updraft to continue past the equilibrium level at the top of an unstable layer. Hence storms with stronger updrafts will tend to have both higher cloud tops and precipitation echo tops in radar data. Again, much of the results in the echo top set were similar to the expectations of having higher values for storms containing lightning jumps. There is a rather interesting indication from the comparison of the echo tops in each cell examined to the echo tops of other cells nearby. Most of the cells containing a lightning jump fell inside the top 3 highest local maximum echoes recorded within 30 nautical miles of each studied cell, where as only a little more than half of the non-jump cases were in the top 3. This indicated cells with lightning jumps were more likely to have a highest echo top, and consequently stronger overall peak storm and/or updraft strength. This is on the contrary to what the reflectivity metric indicated about storm strength in comparison to other local cells. (Details on these findings are outlined in section 6.) c. Expected Hail Size The hail size estimated by the Gibson Ridge software was analyzed the least thoroughly, mainly due to its lack of having a consistent tracking indicator in Gibson Ridge and problems with accuracy of expected hail size in comparison to on-the-ground storm reports. Figure 8. Maximum expected hail size recorded for all cells, with the threshold for severe hail size overlaid with this chart. The averages are plotted as dots to the far left. The cells containing lightning jumps showed a significantly higher incidence of cells with severe hail size estimated, along with a much higher overall average maximum recorded. Note 4 cells that were non-jump cases marked as zero did not reach the minimum tracking threshold in Gibson Ridge and were also not included in the average calculations.
  • 11.     Shriver  11     Figure 9. Maximum hail size recorded plotted against the time the maximum was recorded relative to the time of the first lightning jump in a given cell. Note that the outlier value of 2.77 appears to be heavily impacting the trend line, which shows an overall slightly negative relation between maximum hail size and the time it occurred relative to a lightning jump. Average maximum estimated hail size (Diameter in inches) Percent of cells reaching severe (>= 1.00” diameter) threshold Lightning Jump Cells 1.51” 85.71% Cells with No Jumps 1.01”* 42.86% Table 5. Statistics calculated for both cells with lightning jumps and cells with no jumps for estimated hail sizes. *5 cells with no jump did not reach the tracking threshold of roughly 0.5” diameter, and were not included in the average calculation. Average increase in hail size from jump to local +20 min. max Avg. Local +20 min hail size relative to jump Pcnt. of cells with jump occurring before severe Avg. time elapsed from instance of jump to severe Avg. time elapsed from instance of jump to global max Pcnt. of cells where jump occurred before max Lightning Jump Cells +0.51” diameter 1.38” diameter 21.43% -4.67 minutes 2.21 minutes 64.29% Table 6. Statistics calculated for cells containing lightning jump(s) only. Note that two cells did not reach the severe threshold and are not part of the calculation in column 4. The hail size estimates saw the most varied but also some of the most decisively positive results in the study. Remarkably, storms with lightning jumps on average contained a maximum estimated hail size half an inch larger in diameter than cells containing no jumps. The percentage of cells containing lightning jumps that had maximum hail sizes estimated above the severe hail threshold of 1 inch in diameter was also roughly double the percentage for non-jump cells. Given that stronger
  • 12.     Shriver  12     updrafts are needed to keep larger hail sizes airborne, these results strongly support the hypothesis that cells with lightning jumps tend to become stronger cells, although it is important to remember that these are only estimated hail sizes, which may differ from confirmed spotter or public reports that would confirm or deny the existence of the indicated hail sizes. The results from the hail analysis also have some marginally negative results, as is depicted in figure 9. The plot showing timing of a jump in comparison to the timing of maximum hail size shows that 5 of 14 cases had their maximum hail size recorded prior to any jump occurring. The trend between hail size and time elapsed from a lightning jump also appears to be slightly negative, although the outlier of 2.77” diameter hail estimated in one of the cases may be greatly altering this trend line, particularly given that there are only 14 cases plotted to begin with. 6. Results Interpretation The majority of the results found were consistent with what was initially anticipated, although some of the findings were somewhat surprising at first. In particular, the original expectation for the maximum positive rate of change for each metric studied was that the maximum would generally occur shortly after the observation of a lightning jump. However, the actual findings indicated that each metric tended to have a maximum rate of change roughly 3 minutes prior to the instance of any lightning jumps being observed in each cell. This is best explained by considering the conditions required for a lightning jump’s existence. In order for a rapid increase in lightning activity to occur, a substantial mass of ice must be present in the storm due to the importance of ice crystals in the ionization of particles within the cloud mass. Typically a considerably strong updraft is necessary in order for vast quantities of ice to develop from liquid water droplets or supercooled droplets becoming lifted far enough above the freezing level to become ice crystals. During the development of an updraft, an exchange of mass occurs between small ice crystals and larger graupel, giving both particles a net charge. The smaller and lighter negatively charged ice crystals are pushed to the top of the storm by the updraft while the positively charged graupel stays lower down due to having a higher terminal fall speed. Eventually the difference in electric potential between the two masses of charged particles in enough to initiate a lightning strike between the electric fields. This helps to understand the behavior of the storm shortly before a lightning jump; strengthening of the updraft in the core of the storm must occur prior to a jump to allow a stronger charged fields of particles to develop and for more frequent flash rates to occur. This would also help explain the existence of severe hail estimates before lightning jumps. These larger Gibson Ridge hail size estimates were likely coming from high reflectivity values and vertically integrated liquid values at the uppermost portions of the storm, where a high mass of ice would already be present with hailstones possibly forming aloft. Overall the results show that strengthening is occurring both before and after a lightning jump, and that the metrics tend to reach their peak values after the first recorded jump in a given cell. However, there are conflictions in the data for indicating whether a given cell with an observed lightning jump is more likely to be the strongest storm within a cluster of cells. Comparison of echo tops to surrounding cells yielded a distribution in the graphic below indicated that storms containing jumps were indeed more likely to be one of the strongest echo tops within 30 nautical miles of the cell’s center. The figure shows both actual cell counts and a corrected version of the distribution comparison to account for the difference in the number of cells containing jumps and cells not containing jumps. Note that even the unadjusted values for lightning jump cases exceed the number of non-jump cases in column one. The number of cells that contained the second highest local maximum echo top is more equal in comparison for both the adjusted and raw figures. The number of cells for both cell types having the third highest top is also substantially lower than in either of the first two columns. This could be partly because not all storms analyzed even had more than one or two other storm cells present in their surroundings, meaning some cells would be guaranteed to have an echo top in the top three highest storm tops. However, the number of cells that did not contain one of the highest three storm tops shows the clearest indication that cells containing lightning jumps were much more likely to have higher storm tops. Very few cells with jumps did not contain a top three echo, yet more than a third of the total non-jump cases did not contain one of the highest echo tops. This strongly suggests that the updrafts needed to propel hydrometeors to their maximum height were generally stronger in storm cells containing lightning jumps. This is also consistent with the requirement for a higher ice mass in storms with higher amounts of lightning activity, with stronger updrafts yielding higher cloud tops with a greater depth of clouds composed of ice crystals.
  • 13.     Shriver  13     Figure 10. Distribution for cells containing the first, second and third highest maximum echo top out of all cells within 30 nautical miles of the studied cell. The last column shows the number of cells for each type that did not contain a maximum echo top in the three highest locally recorded echoes. The dashed line for the lightning jump-containing cells is a corrected distribution for the unequal number of cells that contained jumps and cells that did not. 14 cells contained jumps and 21 did not, hence the corrected distribution effectively adds about 7 more cases by multiplying each jump column by 1.5 to estimate a fair comparison. The results from comparing the highest reflectivity recorded in a studied cell to the highest reflectivity values in surrounding cells seemingly did not agree with the indications from the echo top analysis. The average storm cell, whether it contained a lightning jump or not, tended to have another cell nearby that at some point reached a slightly higher maximum base reflectivity. However, as the following figure shows, the cells containing lightning jumps were slightly more likely to have an even lower maximum reflectivity than the maximum in surrounding storm cells than for cells that showed no jumps. The tendency for cells containing jumps to have lower reflectivity values than surrounding cells by a larger amount than for cells that did not contain jumps appears to be a negative result at face value. However, there is also a large outlier in the lightning jump case of -12.5 dB, which is largely weighing down the average. Removing this case from the average gives a result that is more comparable to the non-jump storms. It is also important to note that this study only looked at the very strongest reflectivity in the local area of a studied cell. An average of the maximum reflectivity values of all identifiable storm cells nearby may have given a more representative strength of the typical storm cell in a given cluster of storms. It is also quite possible that a few other storms nearby to the studied cells also contained lightning jumps. Given that lightning jumps can indeed identify the strongest storms in a cluster, it would be quite plausible that these cells would frequently contain higher reflectivity values. Hence the results from this portion of the analysis are somewhat inconclusive given these complications. It also might have been quite helpful to omit reflectivity values recorded in local storms that also contained jumps with a similar comparison without data from other jumps. The vast majority of the other results not yet discussed from the statistical comparisons show an overall positive result in that they indicate storms containing lightning jumps were more likely to see more rapid strengthening, strengthen to a maximum after a lightning jump and were possibly more likely to become stronger than most nearby storm cells. In general, strengthening was occurring prior to a jump occurring, but as outlined earlier, this is an expectable observation given the requirements for lightning initiation to occur. Further testing is still needed to better define the exact correlation between lightning jumps and storm strength, which could include using a similar approach to this study with a much larger sample size.
  • 14.     Shriver  14     Figure 11. Difference between the highest reflectivity value recorded in each studied cell and the highest reflectivity recorded in any cell 30 nautical miles from a studied cell’s center. The center point of the circular area searched for adjacent storm cells moved with each updated position of the storm on radar. The highest value of any of the areas searched was then compared to the maximum reflectivity recorded in the studied cell. The zero values indicate cases where the maximum reflectivity was tied with at least one other local cell’s maximum reflectivity. The averages are plotted to the right side, both below zero. The below zero values represent cases where the studied cell did not contain the strongest reflectivity in the area, and the positive values indicate cells containing the highest reflectivity out of all local storm cells. 7. Conclusions In summary, lightning jumps have the potential to predict both the development of severe weather and are likely an indicator of unusually rapid storm growth. The three selected metrics for the study all showed support for the hypothesis that lightning jumps can predict both storm strengthening, and to a degree, stronger storms in a given storm cluster. Despite some slightly mixed indications from the data, the consensus was that storm cells containing jumps were more likely to grow faster and reach higher values for each of the three metrics examined. The results generally support the expectations underlying the theory that lightning jumps can be used to identify rapidly growing storms with higher severe potential. This study indicates, in addition to the work completed by Schultz et .al (2009; 2011) and other studies, the true usefulness of lightning jumps as a forecasting tool. If an effective method of quickly and accurately identifying jumps in real time is developed, it could aid in the decision-making stages of issuing severe weather warnings and alerting forecasters of storms that are growing very quickly and could soon become strong or severe. It is important to note that this study is should be a key addition in the current database of research for truly understanding the relationship between lightning jumps and thunderstorm behavior. The need for expanding or elaborating on this and other studies is still evident, particularly given some of the conflicts in the data where the sources of the conflicts are sometimes not readily identifiable. Further research may take a similar approach to that of this investigation, although it would likely consist of a more in-depth analysis with a larger sample size and more storm metrics to be examined. The more completely and accurately lightning jumps can be understood, the more useful they will be to forecasters. The usefulness of lightning jumps in warning issuance has already been demonstrated in case examples such as the February 6th , 2008 tornado outbreak. The rapid increasing
  • 15.     Shriver  15     trends in lightning density from the LMA in Alabama helped aid in several forecasters’ confidence in issuing early warnings on one of the many storm cells that developed on this date. A lightning jump occurred in the cell 17 minutes before a tornado touched down, quickly growing to EF-4 strength (Darden et al. 2012). If this type of successful application of lightning jumps can be utilized so well once, it can likely be used again. The potential for lightning jumps to become a vital tool in forecasting in the very near future appears promising. 8. Acknowledgments This paper acknowledges Chris Shultz as a major contributor to this project by allowing access to his pre- processed datasets and for helping the author to define the best approach to testing the relation between lightning jumps and thunderstorms. This study was also completed under the advising and guidance of Dr. T.C. Chen and William Gallus, who helped the project stay on a working schedule and provide suggestions for improvement for the final copy of this report. The study also would like to thank the NCDC, LMA and NLDN for providing data necessary for the completion of the project and for flash rate data used in the jump ratio algorithm. 9. References Cited Arthur Witt, Michael D. Eilts, Gregory J. Stumpf, E. De Wayne Mitchell, J. T. Johnson, and Kevin W. Thomas, 1998: Evaluating the Performance of WSR-88D Severe Storm Detection Algorithms. Wea. Forecasting, 13, 513–518. doi: http://dx.doi.org/10.1175/1520- 0434(1998)013<0513:ETPOWS>2.0.CO;2 Christopher B. Darden, David J. Nadler, Brian C. Carcione, Richard J. Blakeslee, Geoffrey T. Stano, and Dennis E. Buechler, 2010: Utilizing Total Lightning Information to Diagnose Convective Trends. Bull. Amer. Meteor. Soc., 91, 167–175. doi: http://dx.doi.org/10.1175/2009BAMS2808.1 Christopher J. Schultz, Walter A. Petersen, and Lawrence D. Carey, 2011: Lightning and Severe Weather: A Comparison between Total and Cloud-to-Ground Lightning Trends. Wea. Forecasting, 26, 744–755. doi: http://dx.doi.org/10.1175/WAF-D-10-05026.1 Chronis, T., L. D. Carey, C. J. Schultz, E. V. Schultz and K. M. Calhoun, 2014: Exploring lightning jump characteristics. Wea. and Forecasting, accepted, in press C. P. R. Saunders, 1993: A Review of Thunderstorm Electrification Processes. J. Appl. Meteor., 32, 642– 655. doi: http://dx.doi.org/10.1175/1520- 0450(1993)032<0642:AROTEP>2.0.CO;2 LaPenta, K. D., L. F. Bosart, T. J. Galarneau, and M. J. Dickinson, 2005: A multiscale examination of the 31 May 1998 Mechanicsville, New York, tornado.Wea. Forecasting, 20, 494–516 Livingston, I., cited 2014: Can Lightning Help Predict Tornadoes? A D.C. Area Case may shed some light. [Available online at http://www.washingtonpost.com/blogs/capital- weather-gang/post/can-lightning-help-predict- tornadoes-a-dc-area-case-may-shed-some- light/2012/12/07/12cce3f0-400a-11e2-bca3- aadc9b7e29c5_blog.html] Robert J. Trapp, Gregory J. Stumpf, and Kevin L. Manross, 2005: A Reassessment of the Percentage of Tornadic Mesocyclones. Wea. Forecasting, 20, 680–687. doi: http://dx.doi.org/10.1175/WAF864.1 Schultz, J., Walter A. Petersen, Lawrence D. Carey, 2009: Preliminary Development and Evaluation of Lightning Jump Algorithms for the Real-Time Detection of Severe Weather. J. Appl. Meteor. Climatol., 48, 2543– 2563. doi: http://dx.doi.org/10.1175/2009JAMC2237.1 Smoot, J., John Hall, cited 2014: Northern Alabama Lightning Mapping Array. [Available online at http://branch.nsstc.nasa.gov/PUBLIC/NALMA/] Ware, P., G. Stumpf, K. Calhoun, K. Ortega, 2012: Evaluation of a Lightning Jump Algorithm with High Resolution Storm Reports. Report, National Weather Center Research for Undergraduates, 12 pp.