Work breakdown structure in project management ppt by kiran jIIT delhi
Presentation talks about WBS used in the Project Management, what is WBS? Why is it important? How construction and manufacturing firms utilizing WBS to create value delivery. WBS is an important step in Project Management and it is critical to understand it's concepts.
PositioningPositioning of Product or ServiceParis based weig.docxChantellPantoja184
Positioning
Positioning of Product or Service
Paris based weight loss program that is affordable
Quality program for half the price of our competitors
Consumer Promise
Our spa will take care of you , while you lose weight
1
SEQ CHAPTER \h \r 3work breakdown structure
A Work Breakdown Structure (WBS) is a decomposition of all the work necessary to complete a project. A WBS is arranged in a hierarchy and constructed to allow for clear and logical groupings, either by activities or deliverables. The WBS should represent the work identified in the approved Project Scope Statement and serves as an early foundation for effective schedule development and cost estimating. Project managers typically will develop a WBS as a precursor to a detailed project schedule. The WBS should be accompanied by a WBS Dictionary, which lists and defines WBS elements.
The goals of developing a WBS and WBS Dictionary are 1) for the project team to proactively and logically plan out the project to completion, 2) to collect the information about work that needs to be done for a project, and 3) to organize activities into manageable components that will achieve project objectives. The WBS and WBS Dictionary are not the schedule, but rather the building blocks to it. The progression of WBS and WBS Dictionary development is as follows:
The WBS and WBS Dictionary should not be static documents. WBS construction is subject to project management progressive elaboration, and as new information becomes known, the WBS should be revised to reflect that information. A Project Team that has substantial changes to its WBS should reference the project’s Change Management Plan for guidance on management of changes to project scope.
Example
Below is a simplified WBS example with a limited number of organizing levels. The following list describes key characteristics of the sample WBS:
· Hierarchical Levels – contains three levels of work
· Numbering Sequence – uses outline numbering as a unique identifier for all levels
· Level one is 1.0, which illustrates the project level.
· Level two is 1.X (1.1, 1.2, 1.3, etc.), which is the summary level, and often the level at which reporting is done.
· Level three is 1.X.X (1.1.1, 1.1.2, etc.), which illustrates the work package level. The work package is the lowest level of the WBS where both the cost and schedule can be reliably estimated.
· Lowest Level Descriptions – expressed using verbs and objects, such as “make menu.”
Provide
Banquet
Plan and
Supervise
Dinner
Room and
Equipment
GuestsStaffSpeakers
1.1.1 Create
Plan
1.1.2 Make
Budget
1.1.4
Coordinate
Activities
1.1.3 Prepare
Disbursements/
Reconciliation
1.2.1 Make
Menu
1.2.2
Create
Shopping
List
1.2.4 Cook
1.2.3 Shop
1.4.1 Make
Guest List
1.4.2
Receive
RSVPs
1.4.4 Review
Special Needs
1.4.3 Create
Name Tags
1.2.5 Serve
Dinner
1.3.1
Identify Site/
Room
1.3.2 Set up
Tables/Chairs
1.3.4 Decorate
1.3.3 Lay out
Settings/Utensils
1.3.5 Prepare
.
Top 7 WBS Mistakes Project Managers Makejoshnankivel
In my career I\'ve seen a lot of project managers and organizations limp along on projects, in ways that could have been prevented with proper use of the WBS tool. There are 7 major mistakes I\'ve seen and want you to be aware of.
The Work Breakdown StructureAwork breakdown structure (WBS) brea.docxssusera34210
The Work Breakdown Structure
Awork breakdown structure (WBS) breaks down all of the work defined in the scope of the project into manageable tasks. It focuses on the deliverables, the personnel who will create these products and the timing of tasks. The WBS can be organized in several ways. Each of the deliverables can be broken down into its components. For example, the delivery of a statewide GIS demographic survey may be broken down by county. Alternatively, the deliverables can be broken down into phases. For example, the demographic survey may involve data collection, data input, data verification, data formatting, analysis and display, with each phase having associated deliverables. Finally, a WBS may be organized around the project management process groups we discussed in Lesson 2. In this case, deliverables may be associated with initiating, planning, executing, controlling and closing the project.
A WBS may be in any format that clearly defines tasks, deliverables, and timing. One popular format, the Gantt chart, makes a list of project activities leading to deliverables along with the corresponding start and finish date. Project activities are listed separately on individual rows, and time intervals are delineated moving down these rows.
The project activities in a Gantt chart are organized into a hierarchy of levels. Level 0 generally represents the entire project. Level 1 represents the major products, summary tasks, or phases of the project, as listed above. These levels continue to increase as project activities are broken into more and more manageable pieces of work. When project activities have been broken down into the smallest desired tasks or work packages, the WBS has achieved its most detailed level corresponding to the highest numbered level.
A work package may take anywhere from a day to a week to several weeks to complete. It shouldn't be so small as to be trivial, nor should it be so large that it is composed of several deliverables. If you work with a Gantt chart in Microsoft Project, you will enter duration times for these work packages. It is important to have good estimates of how long individual task will truly take to complete. The best source for this information is input from team members who have worked on identical or similar tasks in the past.
The WBS is often created by one of three approaches. The analogy approach uses a similar WBS as a starting point. If you are working for a consulting firm that does similar projects for the same client, this approach may be simple and effective. Such an approach is greatly facilitated if the consulting firm keeps good records and has archives of past projects.
Thetop-down approach begins with the final or largest deliverables. Then, all of the components that make up these deliverables are identified. This process continues to greater and greater detail until all work packages are identified. A project manager attempting to do this alone had better have significant e ...
SEQ CHAPTER h r 3work breakdown structure A Work Breakdown St.docxaryan532920
SEQ CHAPTER \h \r 3work breakdown structure
A Work Breakdown Structure (WBS) is a decomposition of all the work necessary to complete a project. A WBS is arranged in a hierarchy and constructed to allow for clear and logical groupings, either by activities or deliverables. The WBS should represent the work identified in the approved Project Scope Statement and serves as an early foundation for effective schedule development and cost estimating. Project managers typically will develop a WBS as a precursor to a detailed project schedule. The WBS should be accompanied by a WBS Dictionary, which lists and defines WBS elements.
The goals of developing a WBS and WBS Dictionary are 1) for the project team to proactively and logically plan out the project to completion, 2) to collect the information about work that needs to be done for a project, and 3) to organize activities into manageable components that will achieve project objectives. The WBS and WBS Dictionary are not the schedule, but rather the building blocks to it. The progression of WBS and WBS Dictionary development is as follows:
The WBS and WBS Dictionary should not be static documents. WBS construction is subject to project management progressive elaboration, and as new information becomes known, the WBS should be revised to reflect that information. A Project Team that has substantial changes to its WBS should reference the project’s Change Management Plan for guidance on management of changes to project scope.
Example
Below is a simplified WBS example with a limited number of organizing levels. The following list describes key characteristics of the sample WBS:
· Hierarchical Levels – contains three levels of work
· Numbering Sequence – uses outline numbering as a unique identifier for all levels
· Level one is 1.0, which illustrates the project level.
· Level two is 1.X (1.1, 1.2, 1.3, etc.), which is the summary level, and often the level at which reporting is done.
· Level three is 1.X.X (1.1.1, 1.1.2, etc.), which illustrates the work package level. The work package is the lowest level of the WBS where both the cost and schedule can be reliably estimated.
· Lowest Level Descriptions – expressed using verbs and objects, such as “make menu.”
Provide
Banquet
Plan and
Supervise
Dinner
Room and
Equipment
GuestsStaffSpeakers
1.1.1 Create
Plan
1.1.2 Make
Budget
1.1.4
Coordinate
Activities
1.1.3 Prepare
Disbursements/
Reconciliation
1.2.1 Make
Menu
1.2.2
Create
Shopping
List
1.2.4 Cook
1.2.3 Shop
1.4.1 Make
Guest List
1.4.2
Receive
RSVPs
1.4.4 Review
Special Needs
1.4.3 Create
Name Tags
1.2.5 Serve
Dinner
1.3.1
Identify Site/
Room
1.3.2 Set up
Tables/Chairs
1.3.4 Decorate
1.3.3 Lay out
Settings/Utensils
1.3.5 Prepare
Equipment, Pots,
Etc.
1.6.1 Invite
1.6.2
Transport
1.6.4 Backup
for No-shows
1.6.3
Coordinate
Topics
1.6.5 Send
Thank Yous
1.5.1 Hire
Shoppers
1.5.2 Hire
Cooks
1.5.4 Hire
Hosts
1.5.3 Hire
Servers
1.5.5 Hire
Cleanup
1.0
...
The Work Breakdown Structure: Lack Of A Good One Already Sets Your Project Up...Ed Kozak
The work breakdown structure (WBS) is often one of the most overlooked artifacts in any project but it's also the most important for project success. The schedule, budget, resource requirements, risks, and communication plan all are derived from the WBS. Many project failures--over-budget, poor quality, incorrect functionality, delayed schedule--can be traced back to a poor WBS. Failure to plan is planning to fail. How does your organization stack up?
COEPD - Center of Excellence for Professional Development is a primarily a Business Analyst Training Institute in the IT industry of India head quartered at Hyderabad. COEPD is expert in Business Analyst Training in Hyderabad, Chennai, Pune , Mumbai & Vizag. We offer Business Analyst Training with affordable prices that fit your needs.
COEPD conducts 4-day workshops throughout the year for all participants in various locations i.e. Hyderabad, Pune. The workshops are also conducted on Saturdays and Sundays for the convenience of working professionals.
For More Details Please Contact us:
Visit at http://www.coepd.com or http://www.facebook.com/BusinessAnalystTraining
Center of Excellence for Professional Development
3rd Floor, Sahithi Arcade, S R Nagar,
Hyderabad 500 038, India.
Ph# +91 9000155700,
helpdesk@coepd.com
6 Work Breakdown Structure and SchedulingCavan ImagesSto.docxevonnehoggarth79783
6 Work Breakdown Structure and Scheduling
Cavan Images/Stone/Getty Images
Learning Objectives
By the end of this chapter, you will be able to:
• Discuss the creation of a project work breakdown structure.
• Describe the scheduling process.
• Explain how to create schedules.
CO_CRD
CN
CT
CO_LO
CO_TX
CO_BL
co-cn
co-cr
co-box
co-intro
co-photo
co
bar81677_06_c06_173-198.indd 173 9/9/14 10:52 AM
Section 6.1 The Work Breakdown Structure
Pretest
1. To prepare a work breakdown structure for a project, the project manager starts from
the project’s end point and works backward.
a. True
b. False
2. Project schedules can act as constraints rather than efficiency tools.
a. True
b. False
3. Using a project template is recommended for simplifying the scheduling process.
a. True
b. False
Answers can be found at the end of the chapter.
Introduction
If you have ever been part of a team effort where it was unclear who was doing what, then you
have experienced the consequences of not planning out project work. When a team takes on
a project, there must be a plan for the work, a way to identify all the work tasks that must be
done in sequence to produce the project deliverable. In project management, this is called the
work breakdown structure. The WBS is the “what” in the question of who does what. Later,
team members are assigned to the work, but the first step is deciding what the work is.
This chapter will cover the process of defining and breaking down project work and schedul-
ing work tasks and milestones. It will focus on the WBS and scheduling process and the issues
involved in effective scheduling. This is important because outlining what needs to be done to
produce a project’s requirements and deliverables is a proven technique in producing a suc-
cessful project. This process of breaking down project work is a bread-and-butter function in
the project management field.
This chapter covers the definition of project work using a top-down WBS and scheduling the
work from the bottom up. It will illustrate the process and identify ways to reflect risk and
uncertainty in the scheduling process.
6.1 The Work Breakdown Structure
A WBS is a valuable description and documentation of the work involved in producing the
project deliverable. Sometimes the WBS is easy to define, but in more complex projects it is a
complicated and detailed listing of work tasks, milestones, and resources (resources include
personnel, materials, equipment, supplies, facilities, and other assets used in a project). The
WBS is the structure of the work, not the components of the product. Although some work is
directly related to product parts, the purpose of the WBS is to enable an accounting of the costs
of the project and the sequence of work activity and resource use so these can be scheduled.
H1
sec_n sec_t
bar81677_06_c06_173-198.indd 174 9/9/14 10:52 AM
Design Develop
Get
acceptance
Deliver
New information .
1 Work Breakdown Structures (WBS) 2 WBS .docxSONU61709
1
Work Breakdown Structures
(WBS)
2
WBS
Technique originally developed by financial specialists to
track spent money on a program or track the anticipated a need
to spend money
A control mechanism to make sure project cost estimates
covered everything
A control mechanism to make sure they understood where
all the money went or was going
This mechanism has been appropriated by project engineers
and system engineers to make sure that all effort required for
program or project has been accounted for and tracked
A great way to find out if a project is in trouble when the
actual effort projected in area of the WBS is exceeding
projections
3
What is a WBS ?
A Work Breakdown Structure (WBS) is a
fundamental project management tool for defining
and organizing the total scope of a project, using a
hierarchical tree structure.
4
What’s a WBS ?
A hierarchical breakdown (level 1 thru n) of the
work to be executed by the program team
Typically in a tree format
The first two levels of the WBS (Level 1 and Level
2) define a set of planned outcomes that collectively
and exclusively represent 100% of the project scope.
At each subsequent level, the children of a parent
node collectively and exclusively represent 100% of
the scope of their parent node.
5
What is a WBS ?
A well-designed WBS describes planned outcomes
instead of planned actions.
Outcomes are the desired ends of the project, and can
be predicted accurately
An easy way to think about a work breakdown
structure is as an outline or map of the specific
program
6
WBS Dictionary
A WBS dictionary is a document that has a paragraph
or two describing the technical content of each
element of the WBS
Because WBS element numbering and names can be
cryptic, it is a good way to understand what exactly is
in the WBS
7
100% Rule
The 100% Rule...states that the WBS includes 100%
of the work defined by the project scope and
captures all deliverables – internal, external, interim
– in terms of the work to be completed, including
project management (and systems engineering).
8
100% Rule
The 100% rule is one of the most important principles
guiding the development, decomposition and
evaluation of the WBS.
The rule applies at all levels within the hierarchy: the
sum of the work at the “child” level must equal 100%
of the work represented by the “parent” and the WBS
should not include any work that falls outside the
actual scope of the project, that is, it cannot include
more than 100% of the work…
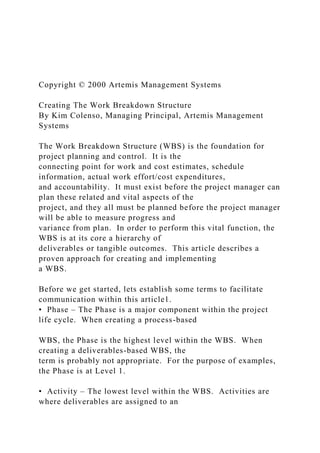
9
100% Rule Example
Project
Part A Part B
Part A.1 Part A.2 Part B.1 Part B.2 Part B.3
Parts A and B must add
up to 100% of the work
of the project
Parts B.1, B.2
and B.3 must
add up to 100%
of the work in
Part B
10
Figure 1: WBS Construction Technique. This
exemplary WBS is from PMI's Practice Standard for
Work Br ...
InstructionsYou are to create YOUR OWN example of each of t.docxvanesaburnand
Instructions:
You are to create YOUR OWN example of each of the devices. One example per device. Please underline your example in each sentence.
Example:
1. The girl ran
as
fast
as
a cheetah in the relay race. (Simile)
2.
Ouch!
I hurt my hand moving the chair away from the desk. (Onomatopoeia)
.
InstructionsYou are a research group from BSocialMarketing, LLC.docxvanesaburnand
Instructions:
You are a research group from BSocialMarketing, LLC. -a marketing consulting company that evaluates the effectiveness of clients’ social media activities/ websites.
As a group, you will
select a publicly-traded company
and
analyze the social media
aspects of that company.
Overview:
Over the last several years, more companies have begun to use social media as part of their overall communication and marketing strategies, and you have been asked to investigate…
how successful is their social media campaign,
what are the current trends,
how companies have changed the way they do business,
and what the future looks like in the context of social media use.
Objective of research:
Investigate how your selected company is using social media to enhance communications and business interactions within the company (internal communication: Employee) and externally with partners, vendors, customers, and the community. Social media includes but not limit to: Twitter, LinkedIn, Facebook, YouTube, etc.…
Investigate the individual company by asking…
What specific examples and details is the company using social media?
How are they being implemented? Is there a strategy?
What are their objectives?
Are they successful?
What results have they seen that can specifically be tied to social media? Increase in revenue or customer satisfaction?
What improvements could they make?
.
SEQ CHAPTER h r 3work breakdown structure A Work Breakdown St.docxaryan532920
SEQ CHAPTER \h \r 3work breakdown structure
A Work Breakdown Structure (WBS) is a decomposition of all the work necessary to complete a project. A WBS is arranged in a hierarchy and constructed to allow for clear and logical groupings, either by activities or deliverables. The WBS should represent the work identified in the approved Project Scope Statement and serves as an early foundation for effective schedule development and cost estimating. Project managers typically will develop a WBS as a precursor to a detailed project schedule. The WBS should be accompanied by a WBS Dictionary, which lists and defines WBS elements.
The goals of developing a WBS and WBS Dictionary are 1) for the project team to proactively and logically plan out the project to completion, 2) to collect the information about work that needs to be done for a project, and 3) to organize activities into manageable components that will achieve project objectives. The WBS and WBS Dictionary are not the schedule, but rather the building blocks to it. The progression of WBS and WBS Dictionary development is as follows:
The WBS and WBS Dictionary should not be static documents. WBS construction is subject to project management progressive elaboration, and as new information becomes known, the WBS should be revised to reflect that information. A Project Team that has substantial changes to its WBS should reference the project’s Change Management Plan for guidance on management of changes to project scope.
Example
Below is a simplified WBS example with a limited number of organizing levels. The following list describes key characteristics of the sample WBS:
· Hierarchical Levels – contains three levels of work
· Numbering Sequence – uses outline numbering as a unique identifier for all levels
· Level one is 1.0, which illustrates the project level.
· Level two is 1.X (1.1, 1.2, 1.3, etc.), which is the summary level, and often the level at which reporting is done.
· Level three is 1.X.X (1.1.1, 1.1.2, etc.), which illustrates the work package level. The work package is the lowest level of the WBS where both the cost and schedule can be reliably estimated.
· Lowest Level Descriptions – expressed using verbs and objects, such as “make menu.”
Provide
Banquet
Plan and
Supervise
Dinner
Room and
Equipment
GuestsStaffSpeakers
1.1.1 Create
Plan
1.1.2 Make
Budget
1.1.4
Coordinate
Activities
1.1.3 Prepare
Disbursements/
Reconciliation
1.2.1 Make
Menu
1.2.2
Create
Shopping
List
1.2.4 Cook
1.2.3 Shop
1.4.1 Make
Guest List
1.4.2
Receive
RSVPs
1.4.4 Review
Special Needs
1.4.3 Create
Name Tags
1.2.5 Serve
Dinner
1.3.1
Identify Site/
Room
1.3.2 Set up
Tables/Chairs
1.3.4 Decorate
1.3.3 Lay out
Settings/Utensils
1.3.5 Prepare
Equipment, Pots,
Etc.
1.6.1 Invite
1.6.2
Transport
1.6.4 Backup
for No-shows
1.6.3
Coordinate
Topics
1.6.5 Send
Thank Yous
1.5.1 Hire
Shoppers
1.5.2 Hire
Cooks
1.5.4 Hire
Hosts
1.5.3 Hire
Servers
1.5.5 Hire
Cleanup
1.0
...
The Work Breakdown Structure: Lack Of A Good One Already Sets Your Project Up...Ed Kozak
The work breakdown structure (WBS) is often one of the most overlooked artifacts in any project but it's also the most important for project success. The schedule, budget, resource requirements, risks, and communication plan all are derived from the WBS. Many project failures--over-budget, poor quality, incorrect functionality, delayed schedule--can be traced back to a poor WBS. Failure to plan is planning to fail. How does your organization stack up?
COEPD - Center of Excellence for Professional Development is a primarily a Business Analyst Training Institute in the IT industry of India head quartered at Hyderabad. COEPD is expert in Business Analyst Training in Hyderabad, Chennai, Pune , Mumbai & Vizag. We offer Business Analyst Training with affordable prices that fit your needs.
COEPD conducts 4-day workshops throughout the year for all participants in various locations i.e. Hyderabad, Pune. The workshops are also conducted on Saturdays and Sundays for the convenience of working professionals.
For More Details Please Contact us:
Visit at http://www.coepd.com or http://www.facebook.com/BusinessAnalystTraining
Center of Excellence for Professional Development
3rd Floor, Sahithi Arcade, S R Nagar,
Hyderabad 500 038, India.
Ph# +91 9000155700,
helpdesk@coepd.com
6 Work Breakdown Structure and SchedulingCavan ImagesSto.docxevonnehoggarth79783
6 Work Breakdown Structure and Scheduling
Cavan Images/Stone/Getty Images
Learning Objectives
By the end of this chapter, you will be able to:
• Discuss the creation of a project work breakdown structure.
• Describe the scheduling process.
• Explain how to create schedules.
CO_CRD
CN
CT
CO_LO
CO_TX
CO_BL
co-cn
co-cr
co-box
co-intro
co-photo
co
bar81677_06_c06_173-198.indd 173 9/9/14 10:52 AM
Section 6.1 The Work Breakdown Structure
Pretest
1. To prepare a work breakdown structure for a project, the project manager starts from
the project’s end point and works backward.
a. True
b. False
2. Project schedules can act as constraints rather than efficiency tools.
a. True
b. False
3. Using a project template is recommended for simplifying the scheduling process.
a. True
b. False
Answers can be found at the end of the chapter.
Introduction
If you have ever been part of a team effort where it was unclear who was doing what, then you
have experienced the consequences of not planning out project work. When a team takes on
a project, there must be a plan for the work, a way to identify all the work tasks that must be
done in sequence to produce the project deliverable. In project management, this is called the
work breakdown structure. The WBS is the “what” in the question of who does what. Later,
team members are assigned to the work, but the first step is deciding what the work is.
This chapter will cover the process of defining and breaking down project work and schedul-
ing work tasks and milestones. It will focus on the WBS and scheduling process and the issues
involved in effective scheduling. This is important because outlining what needs to be done to
produce a project’s requirements and deliverables is a proven technique in producing a suc-
cessful project. This process of breaking down project work is a bread-and-butter function in
the project management field.
This chapter covers the definition of project work using a top-down WBS and scheduling the
work from the bottom up. It will illustrate the process and identify ways to reflect risk and
uncertainty in the scheduling process.
6.1 The Work Breakdown Structure
A WBS is a valuable description and documentation of the work involved in producing the
project deliverable. Sometimes the WBS is easy to define, but in more complex projects it is a
complicated and detailed listing of work tasks, milestones, and resources (resources include
personnel, materials, equipment, supplies, facilities, and other assets used in a project). The
WBS is the structure of the work, not the components of the product. Although some work is
directly related to product parts, the purpose of the WBS is to enable an accounting of the costs
of the project and the sequence of work activity and resource use so these can be scheduled.
H1
sec_n sec_t
bar81677_06_c06_173-198.indd 174 9/9/14 10:52 AM
Design Develop
Get
acceptance
Deliver
New information .
1 Work Breakdown Structures (WBS) 2 WBS .docxSONU61709
1
Work Breakdown Structures
(WBS)
2
WBS
Technique originally developed by financial specialists to
track spent money on a program or track the anticipated a need
to spend money
A control mechanism to make sure project cost estimates
covered everything
A control mechanism to make sure they understood where
all the money went or was going
This mechanism has been appropriated by project engineers
and system engineers to make sure that all effort required for
program or project has been accounted for and tracked
A great way to find out if a project is in trouble when the
actual effort projected in area of the WBS is exceeding
projections
3
What is a WBS ?
A Work Breakdown Structure (WBS) is a
fundamental project management tool for defining
and organizing the total scope of a project, using a
hierarchical tree structure.
4
What’s a WBS ?
A hierarchical breakdown (level 1 thru n) of the
work to be executed by the program team
Typically in a tree format
The first two levels of the WBS (Level 1 and Level
2) define a set of planned outcomes that collectively
and exclusively represent 100% of the project scope.
At each subsequent level, the children of a parent
node collectively and exclusively represent 100% of
the scope of their parent node.
5
What is a WBS ?
A well-designed WBS describes planned outcomes
instead of planned actions.
Outcomes are the desired ends of the project, and can
be predicted accurately
An easy way to think about a work breakdown
structure is as an outline or map of the specific
program
6
WBS Dictionary
A WBS dictionary is a document that has a paragraph
or two describing the technical content of each
element of the WBS
Because WBS element numbering and names can be
cryptic, it is a good way to understand what exactly is
in the WBS
7
100% Rule
The 100% Rule...states that the WBS includes 100%
of the work defined by the project scope and
captures all deliverables – internal, external, interim
– in terms of the work to be completed, including
project management (and systems engineering).
8
100% Rule
The 100% rule is one of the most important principles
guiding the development, decomposition and
evaluation of the WBS.
The rule applies at all levels within the hierarchy: the
sum of the work at the “child” level must equal 100%
of the work represented by the “parent” and the WBS
should not include any work that falls outside the
actual scope of the project, that is, it cannot include
more than 100% of the work…
9
100% Rule Example
Project
Part A Part B
Part A.1 Part A.2 Part B.1 Part B.2 Part B.3
Parts A and B must add
up to 100% of the work
of the project
Parts B.1, B.2
and B.3 must
add up to 100%
of the work in
Part B
10
Figure 1: WBS Construction Technique. This
exemplary WBS is from PMI's Practice Standard for
Work Br ...
InstructionsYou are to create YOUR OWN example of each of t.docxvanesaburnand
Instructions:
You are to create YOUR OWN example of each of the devices. One example per device. Please underline your example in each sentence.
Example:
1. The girl ran
as
fast
as
a cheetah in the relay race. (Simile)
2.
Ouch!
I hurt my hand moving the chair away from the desk. (Onomatopoeia)
.
InstructionsYou are a research group from BSocialMarketing, LLC.docxvanesaburnand
Instructions:
You are a research group from BSocialMarketing, LLC. -a marketing consulting company that evaluates the effectiveness of clients’ social media activities/ websites.
As a group, you will
select a publicly-traded company
and
analyze the social media
aspects of that company.
Overview:
Over the last several years, more companies have begun to use social media as part of their overall communication and marketing strategies, and you have been asked to investigate…
how successful is their social media campaign,
what are the current trends,
how companies have changed the way they do business,
and what the future looks like in the context of social media use.
Objective of research:
Investigate how your selected company is using social media to enhance communications and business interactions within the company (internal communication: Employee) and externally with partners, vendors, customers, and the community. Social media includes but not limit to: Twitter, LinkedIn, Facebook, YouTube, etc.…
Investigate the individual company by asking…
What specific examples and details is the company using social media?
How are they being implemented? Is there a strategy?
What are their objectives?
Are they successful?
What results have they seen that can specifically be tied to social media? Increase in revenue or customer satisfaction?
What improvements could they make?
.
InstructionsYou are attending an international journalist event.docxvanesaburnand
Instructions:
You are attending an international journalist event and have been chosen to give a presentation of the roles of the media in influencing government and its citizens. Identify and describe the possible roles of the media in influencing government and its citizens using specific descriptive examples.
Please create a PowerPoint presentation to assist you in your presentation. As you complete your presentation, be sure to: Use speaker's notes to expand upon the bullet point main ideas on your slides, making references to research and theory with citation. Proof your work Use visuals (pictures, video, narration, graphs, etc.) to compliment the text in your presentation and to reinforce your content.
Do not just write a paper and copy chunks of it into each slide. Treat this as if you were going to give this presentation live.
Presentation Requirements:
(APA format) Length: 8-10 substantive slides (excluding cover and references slides)
Font should not be smaller than size 16-point Parenthetical in-text citations included and formatted in APA style
References slide (a minimum of 2 outside scholarly sources plus the textbook and/or the weekly lesson for each course outcome)
Title and introduction slide required
.
InstructionsWrite the Organizational section of your project pap.docxvanesaburnand
Instructions
Write the Organizational section of your project paper. This section should be 4 page and include at least 5 APA formatted references one of which may be the company or SBA website depending on your type of project.
This section should include the following:
The organization’s mission and vision (business plan – write a mission statement)
The organization's structure - How does this compare to competitors? Based on the organization's structure - how receptive to change will the organization be?
The management chart showing levels and responsibility. What type of organization is it (matrix, hierarchical or something else?)
A description of employees and/or headcount in the organization:
For the company analysis: How diverse is the company’s workforce? Leadership? Is diversity company-wide or are certain levels or positions more or less diverse than others?
For the business plan: how will you incorporate diversity into your organization?
Discussion of concepts such as leadership, management, and role theories - how they are reflected in the organization?
.
InstructionsWrite a two-page (double spaced, Times New Roman S.docxvanesaburnand
Instructions
Write
a two-page (double spaced, Times New Roman Size 12) response to
one
of the following questions. Cite the week’s readings at least
twice
in your answer from
The Human Condition by
Hannah, Arendt. The University of Chicago Press; 2nd edition
Questions:
Define Labor, Work, and Action from the perspective of Arendt.
Where does politics fall for Arendt; the public or the private?
How are necessity and Action related to one another for Arendt?
.
InstructionsWrite a thesis statement in response to the topi.docxvanesaburnand
Instructions
Write a thesis statement in response to the topic:
Should world leaders use a pandemic crisis brought about by a killer virus to boost their own popularity?
To help you organize your paper, compose a topic sentence for each point in the thesis.
.
InstructionsWhat You will choose a current issue of social.docxvanesaburnand
Instructions:
What:
You will choose a current issue of social justice, research it, and write an analysis of the topic, using support from your research, and including knowledge gained and referenced from your textbook.
How:
should be 4-6 pages in length, double spaced, Times New Roman, 12 point font. Should include a title page and a reference page (these two pages are not included in the required 5-6 pages).
Some questions to consider while researching and writing about your topic:
• Why is this topic controversial?
• What are some of the causes?
• What are some of the effects?
• Who does it affect? (who = social class, race/ethnicity, age range)
• Is it happening all over the U.S., or are there regions where it is more of (or less of) an issue?
• What needs to happen for it to change?
• What is being done about it? What is NOT being done about it?
• Who (person, group or organization) might have the power to improve or fix it?
The Textbook is:
Making a Difference: Using Sociology to Create a Better World, 1st ed.
By: Michael Schwalbe
Please let me know if it is needed and I will try and upload the textbook
.
InstructionsWrite a paper about the International Monetary Syste.docxvanesaburnand
Instructions
Write a paper about the International Monetary System that addresses each of the following issues:
· Define the International Monetary System and outline the history of the system.
· Describe and provide examples of what is meant by “currency regimes,” and define selected types of regimes and form an argument for selecting fixed exchange rate and arguments for selecting flexible exchange rates.
· Describe and define the creation of the Euro and discuss the benefits as well as the problems associated with the creation of this currency.
Support your paper with at least five (5) resources. In addition to these specified resources, other appropriate scholarly resources, including older articles, may be included. Your paper should demonstrate thoughtful consideration of the ideas and concepts that are presented in the course and provide new thoughts and insights relating directly to this topic. Your response should reflect scholarly writing and current APA standards.
Length: 5-7 pages (not including title and reference pages).
Eiteman, D., Stonehill, M., & Moffett, M. (2016). Multinational business finance. Boston, MA: Prentice-Hall.
Read Chapters 1, 2
This is a major resource, however, I think the assignment can be accomplished without it. I can’t seem to be able to download the book.
The global company's challenge.
Authors:
Dewhurst, Martin1
Harris, Jonathan2
Heywood, Suzanne
Aquila, Kate
Source:
McKinsey Quarterly. 2012, Issue 3, p76-80. 5p.
Document Type:
Article
Subject Terms:
*International business enterprises
*Emerging markets
*Economies of scale
*Contracting out
*Risk management in business
*Business models
*Executives
*Financial leverage
*Globalization
*Research & development
Developing countries
Company/Entity:
International Monetary Fund DUNS Number: 069275188
Aditya Birla Management Corp. Pvt. Ltd.
International Business Machines Corp. DUNS Number: 001368083 Ticker: IBM
NAICS/Industry Codes:
919110 International and other extra-territorial public administration
928120 International Affairs
541712 Research and Development in the Physical, Engineering, and Life Sciences (except Biotechnology)
541711 Research and Development in Biotechnology
Abstract:
The article focuses on the management of risks, costs, and strategies by international businesses in emerging markets. It states that the International Monetary Fund reported that the ten fastest-growing economies after 2012 will all be in developing countries. It mentions that technology company International Business Machines expects by 2015 to earn 30 percent of revenues in emerging markets compared to 17 percent in 2009, while Indian multinational conglomerate Aditya Birla Group earns over half of its revenue outside India and has operations in 40 nations. It talks about the benefit of economies of scale in shared services enjoyed by large global companies and comments that the ability to outsource business services and manufacturing is benefiting local busine.
InstructionsWrite a comprehensive medical report on a disease we.docxvanesaburnand
Instructions
Write a comprehensive medical report on a disease we have studied up to this point ( Gastroesophageal Reflux Disease, Appendicitis, Hepatitis, Cholecystitis and Pancreatitis , Myocardial Infarction, Digitalis or Hypertension)
Be sure to include all relevant medical history, testing/diagnostics, treatment options, and recommended plan of action. Paper should be in APA format and 4–6 pages submitted to the
Submissions Area.
By the end of the week, place your project as a Microsoft Word document in the
Submissions Area.
Submit your document to the
Submissions Area
by
the due date assigned.
.
InstructionsWhether you believe” in evolution or not, why is it.docxvanesaburnand
Instructions
Whether you “believe” in evolution or not, why is it important to be knowledgeable about Darwin's theory? How might genetics and evolution apply to our modern society when we consider the differences between people? Should we stratify people based on intelligence or other specific qualities? Have you observed traits in your parents that you do not like and see them in yourself? (You do not have to be specific about personal issues but can write about issues in a general sense.)Your journal entry must be at least 200 words in length. No references or citations are necessary.
.
InstructionsWe have been looking at different psychological .docxvanesaburnand
Instructions
We have been looking at different psychological theories and the way we can use them to better examine social media. For this assignment use Michelle Obama . Spend some time looking through her social media accounts: Facebook, Twitter, Instagram, Pinterest, etc. Then write your analysis, being sure to cover these points:
A good introduction including who your subject is and a good overview of them and their social media use
Examples and discussion of schema/script theory in your subject
Examples and discussion of cultivation theory in your subject
Examples and discussion of agenda-setting theory in your subject
Examples and discussion of social learning in your subject
Examples and discussion of uses and gratifications theory in your subject
Conclusions
.
InstructionsThis written assignment requires the student to inve.docxvanesaburnand
Instructions
This written assignment requires the student to investigate his/her local, state and federal legislators and explore their assigned committees and legislative commitments. The student is expected to investigate current and actual legislative initiatives that have either passed or pending approval by the house, senate or Governor’s office. The student will draft a letter to a specific legislator and offer support or constructive argument against pending policy or legislation. The letter must be supported with a minimum of 3 evidence based primary citations. (See Rubric)
.
InstructionsThe Art Form Most Meaningful to MePick the form .docxvanesaburnand
Instructions
The Art Form Most Meaningful to Me
Pick the form of cultural expression most important to you. It could be music, theater, dance, visual arts—whatever excites and/or inspires you most. Describe:
Its most significant characteristics (e.g., visual, audio, etc.)
Your favorite artists in this art, and why.
The one example of this art that inspires you most.
500 words
.
InstructionsThink of a specific topic and two specific kin.docxvanesaburnand
Instructions
Think of a specific topic and two specific kinds of audiences.
Then write a short example (150–200 words) of how this topic might be presented to each of the two audiences.
How does the intended audience influence the choice of words and use of language in a document?
.
InstructionsThere are different approaches to gathering risk da.docxvanesaburnand
Instructions:
There are different approaches to gathering risk data which include qualitative and quantitative data collection.
Select three limitations to traditional cost risk analysis. Explain in 250 words how qualitative and quantitative data collection are different. Also, discuss how the risk driver approach can be useful in minimizing the limitation to traditional cost risk analysis.
Please be sure to validate your opinions and ideas with citations and references in APA format.
.
InstructionsThe Public Archaeology Presentation invites you.docxvanesaburnand
Instructions
The Public Archaeology Presentation invites you to evaluate the public archaeology outreach of a site such as an archaeological excavation that is open to the public, an outdoor museum that is hosting or has hosted archaeological excavations, a museum with archaeological collections, etc.* Using the insight you have gained in this course about important topics in archaeology such as archaeological method and theory, subsistence, cultural patterns in prehistory, and environmental interaction, evaluate the ways in which, at the site you have chosen, the knowledge gained from archaeological excavations is being used, or is not being used, to highlight and address issues in the local, regional, or global communities. For example, current issues often addressed in public archaeology include historic preservation, economic growth, environmental degradation, looting, STEM (Science, Technology, Engineering, Math) education, volunteer opportunities, and more. You will present your findings to your classmates in the Week 8 Public Archaeology discussion in the form of a multimedia presentation.
Any of the sites listed above are ideal for this project. If you are considering a site and are unsure whether it would be suitable for the Public Archaeology Presentation, discuss the site with your instructor. If you are having trouble locating archaeological excavations or museums in your area, check with your local Chamber of Commerce or Tourism Bureau or the Anthropology department/professor at the nearest college or university. Some small sites have limited funding and are not able to advertise extensively.
Guidelines
Your assignment will take the form of a multimedia presentation, such as a YouTube video, blog, PowerPoint presentation, etc. Ideally, your presentation will include audio, but if this is not possible, your presentation must include sufficient text to explain your findings and conclusions.
By Wednesday of Week 8, you will submit a short introduction and a link to your presentation in a designated discussion area AND in the Assignments Folder (this allows me to provide you with private feedback and a grade). Your presentation must be shared online, but you may choose how to do so. There are many free tools out there. Check out the following website for some ideas:
http://blog.crazyegg.com/2013/05/28/online-presentation-tools/
.
Speak and/or write professionally using standard English. If speaking, pay attention to correct grammar and enunciation. If writing, check your spelling and grammar carefully. Poor grammar, spelling, and/or enunciation may affect your grade.
Your presentation must include a written References section in proper citation format detailing the sources you used.
Initial Research
Once you have chosen a site and your instructor has approved it, conduct research using the UMUC Library databases, the internet, and other sources (nearby public librarie.
InstructionsThe tools of formal analysis are the starting point .docxvanesaburnand
Instructions
The tools of formal analysis are the starting point for understanding any work of art; these tools help you realize how a work of art was made and develop a deeper appreciation of it.
Step 1: Examine
Choose a work of art (1.3.6 (Caravaggio p. 79);
or
2.2.27 (Baca p. 224);
or
4.1.13 (Rivera p. 576)).
Start your formal analysis by taking a long look at the artwork using Part I of this book, the elements and principles of art as they relate to your chosen work.
Step 2: Write
Work of Art information:
State the title, artist, date, dimensions, and medium (what it is made of).
State the name of the exhibition in which the work was displayed/ where the artwork is located
Draft a thorough, detailed description of the work of art you chose.
Be sure to:
Write your
formal analysis
. Visually analyze and describe the contents of the work of art. Apply a minimum of 5 elements
and
5 principles of art vocabulary words as you discuss the art.
Include an additional
method of analysis
that is discussed in chapter 1.10 (Learning Module 2.5) to guide your research in order to understand why the artwork was made and what its message is.
Investigate the artist’s life when the work was created. Delve into the time and place in which he or she lived.
What symbols did the artist use, and what was his or her state of mind? Recognize that some artworks are meant to convey distinct messages, which were clear to their contemporary audiences.
Step 3:
Organize your findings into a combined analysis paper
using MLA format
. Your analysis should be a minimum of 800 words.
Use reliable sources. Include your research, as well as your own opinions, to form your interpretation of the artwork.
Before you submit... make sure that you have the following:
Formal analysis of the work of art selected
Identify and discuss one additional mode of analysis
The analysis length should be 3 - 5 pages
Use MLA format (Times New Roman 12 point size font, double-spaced, appropriate in-text citations, Works Cited page, etc...)
Cite external sources
Similarity Report must within 0-10%
.
InstructionsThe Homeland Security (DHS) agency is intended t.docxvanesaburnand
Instructions
The Homeland Security (DHS) agency is intended to be the stronger line of defense against terrorism in the U.S. Write a 10-12-page paper answering the following questions:
1. How is the DHS structured, and what are its current anti-terror and counter-terror capabilities? Given those capabilities, what does this indicate about what the DHS considers the most likely type of attack and by whom/what (Individuals? Organizations? Domestic militias? Radicalized residents? Foreign nationals?...)
2. What have you identified as DHS areas in need of improvement? What are its strong points?
3. Are there indications of how the DHS works with national intelligence agencies? Comment on this point, examining what may need improving regarding inter-agency relations and cooperation.
4. Summarize your findings and recommendations as an 'executive brief' (no more than 2 pages long). Your recommendations should be realistic, soundly based in current structures and capabilities (this includes strengthening those capabilities as identified). It should take into account potential restrictions of human rights, too. It should also reflect the current state of knowledge regarding homeland security and counter- / anti- terrorism. Include a statement that reflects your findings on what types of terror-related incidents are considered most likely to occur inside the U.S. (all 50 states, not just the 48 continental ones).
Thesis Statement
Write a thesis statement summarizing the main argument you will be making in your final paper. This may change as you move forward, but it will be your general road map.
THE TOPIC IS ---- Increasingly, Cyberspace
.
InstructionsThe student should describe how learning abou.docxvanesaburnand
Instructions:
The student should describe how learning about entrepreneurship would help them (a) know more about themselves, (b) identify their purpose in life, and (c) identify how they could positively transform the world.
To answer, the student must:
to. Use a maximum of 150 words
b. Choose font size 12 points Times New Roman or Arial
c. Separate lines to space and a half (1.5)
d. Validate your answer using at least two references
and. Include bibliography of references at the end of the forum
.
2024.06.01 Introducing a competency framework for languag learning materials ...Sandy Millin
http://sandymillin.wordpress.com/iateflwebinar2024
Published classroom materials form the basis of syllabuses, drive teacher professional development, and have a potentially huge influence on learners, teachers and education systems. All teachers also create their own materials, whether a few sentences on a blackboard, a highly-structured fully-realised online course, or anything in between. Despite this, the knowledge and skills needed to create effective language learning materials are rarely part of teacher training, and are mostly learnt by trial and error.
Knowledge and skills frameworks, generally called competency frameworks, for ELT teachers, trainers and managers have existed for a few years now. However, until I created one for my MA dissertation, there wasn’t one drawing together what we need to know and do to be able to effectively produce language learning materials.
This webinar will introduce you to my framework, highlighting the key competencies I identified from my research. It will also show how anybody involved in language teaching (any language, not just English!), teacher training, managing schools or developing language learning materials can benefit from using the framework.
Instructions for Submissions thorugh G- Classroom.pptxJheel Barad
This presentation provides a briefing on how to upload submissions and documents in Google Classroom. It was prepared as part of an orientation for new Sainik School in-service teacher trainees. As a training officer, my goal is to ensure that you are comfortable and proficient with this essential tool for managing assignments and fostering student engagement.
Ethnobotany and Ethnopharmacology:
Ethnobotany in herbal drug evaluation,
Impact of Ethnobotany in traditional medicine,
New development in herbals,
Bio-prospecting tools for drug discovery,
Role of Ethnopharmacology in drug evaluation,
Reverse Pharmacology.
Welcome to TechSoup New Member Orientation and Q&A (May 2024).pdfTechSoup
In this webinar you will learn how your organization can access TechSoup's wide variety of product discount and donation programs. From hardware to software, we'll give you a tour of the tools available to help your nonprofit with productivity, collaboration, financial management, donor tracking, security, and more.
The French Revolution, which began in 1789, was a period of radical social and political upheaval in France. It marked the decline of absolute monarchies, the rise of secular and democratic republics, and the eventual rise of Napoleon Bonaparte. This revolutionary period is crucial in understanding the transition from feudalism to modernity in Europe.
For more information, visit-www.vavaclasses.com
This is a presentation by Dada Robert in a Your Skill Boost masterclass organised by the Excellence Foundation for South Sudan (EFSS) on Saturday, the 25th and Sunday, the 26th of May 2024.
He discussed the concept of quality improvement, emphasizing its applicability to various aspects of life, including personal, project, and program improvements. He defined quality as doing the right thing at the right time in the right way to achieve the best possible results and discussed the concept of the "gap" between what we know and what we do, and how this gap represents the areas we need to improve. He explained the scientific approach to quality improvement, which involves systematic performance analysis, testing and learning, and implementing change ideas. He also highlighted the importance of client focus and a team approach to quality improvement.
The Indian economy is classified into different sectors to simplify the analysis and understanding of economic activities. For Class 10, it's essential to grasp the sectors of the Indian economy, understand their characteristics, and recognize their importance. This guide will provide detailed notes on the Sectors of the Indian Economy Class 10, using specific long-tail keywords to enhance comprehension.
For more information, visit-www.vavaclasses.com
The Roman Empire A Historical Colossus.pdfkaushalkr1407
The Roman Empire, a vast and enduring power, stands as one of history's most remarkable civilizations, leaving an indelible imprint on the world. It emerged from the Roman Republic, transitioning into an imperial powerhouse under the leadership of Augustus Caesar in 27 BCE. This transformation marked the beginning of an era defined by unprecedented territorial expansion, architectural marvels, and profound cultural influence.
The empire's roots lie in the city of Rome, founded, according to legend, by Romulus in 753 BCE. Over centuries, Rome evolved from a small settlement to a formidable republic, characterized by a complex political system with elected officials and checks on power. However, internal strife, class conflicts, and military ambitions paved the way for the end of the Republic. Julius Caesar’s dictatorship and subsequent assassination in 44 BCE created a power vacuum, leading to a civil war. Octavian, later Augustus, emerged victorious, heralding the Roman Empire’s birth.
Under Augustus, the empire experienced the Pax Romana, a 200-year period of relative peace and stability. Augustus reformed the military, established efficient administrative systems, and initiated grand construction projects. The empire's borders expanded, encompassing territories from Britain to Egypt and from Spain to the Euphrates. Roman legions, renowned for their discipline and engineering prowess, secured and maintained these vast territories, building roads, fortifications, and cities that facilitated control and integration.
The Roman Empire’s society was hierarchical, with a rigid class system. At the top were the patricians, wealthy elites who held significant political power. Below them were the plebeians, free citizens with limited political influence, and the vast numbers of slaves who formed the backbone of the economy. The family unit was central, governed by the paterfamilias, the male head who held absolute authority.
Culturally, the Romans were eclectic, absorbing and adapting elements from the civilizations they encountered, particularly the Greeks. Roman art, literature, and philosophy reflected this synthesis, creating a rich cultural tapestry. Latin, the Roman language, became the lingua franca of the Western world, influencing numerous modern languages.
Roman architecture and engineering achievements were monumental. They perfected the arch, vault, and dome, constructing enduring structures like the Colosseum, Pantheon, and aqueducts. These engineering marvels not only showcased Roman ingenuity but also served practical purposes, from public entertainment to water supply.
2. individual. The individual will perform a work process to
create the deliverable. Therefore, the
Activity is a combination of deliverable and process. For the
purpose of examples, the Activity is at
Level 3.
• WBS Entry – A generic term for any level within the WBS,
but always representing a deliverable.
WBS Entries are decomposed into other WBS Entries, and at the
lowest level, are decomposed into
Activities. For the purpose of examples, the WBS Entry (at
Level 2) will fall below the Phase and
above the Activities at Level 3. In actual practice, there can be
as many levels of WBS Entry as
needed.
The WBS As Hierarchy
Before looking at how to build a WBS, it is generally a good
idea to create a mental model for what we are
going to build. The mental model I have used many times in the
past is the Outline. If you go back to your
time in grade school (and if you’re as old as I am, that can be a
challenge), you will remember that your
teacher always wanted you to create an outline as the first step
in writing a report. The outline had some
very specific characteristics and rules, and if you didn’t follow
them, the teacher would apply ‘corrective
discipline’, and you would make the necessary changes. Well,
the Work Breakdown Structure has many
aspects in common with the outline.
Topic Project Level 1 Level 2 Level 3
I. Phase 1
A WBS Entry 1-1
4. numbers.
The rules for outlines are as follows:
• At any level, if you have one entry at that level, then you
must have two or more, otherwise the level
itself is meaningless.
• At any level, the content of the lower level entries is
conceptually equivalent to the higher level entry
that they are a part of.
The WBS
Like the outline, the WBS is also a hierarchical tree structure.
At the highest level is the project. The
project is not part of the WBS, just like the topic is not part of
the outline. Within the project is a
hierarchical structure that defines the content of the project, just
like the outline defines the content of the
topic. Therefore, the following general statements are valid:
• Although the WBS content does not have to roll-up
conceptually like an outline does, this is a very
good idea as it provides the project manager with the ability to
validate the WBS before committing to
a completion date.
• Any WBS entry, when decomposed into components, should
have two or more components defined,
otherwise the decomposition itself is meaningless.
• For any WBS entry that is decomposed into components: the
content of the lower level entries should
be conceptually equivalent to the higher level entry that they
are a part of. In other words, the higher
5. level entry should be a deliverable, and the lower level entries
should be components of that
deliverable.
Like the outline, when not done properly there will be
corrective action applied, only you won’t have to
stay after school. In all likelihood, the project will be late, over
budget, and not meet expectations…
Creating the Work Breakdown Structure
The WBS can be structured in either of two ways. The first
approach structures the WBS primarily from a
deliverables perspective, in that the highest level (Level 1)
entries represent the major deliverables that the
project is committed to create. The second approach is from a
life cycle perspective, in that the highest
level entries in the WBS correspond to the major phases of the
life cycle.
Steps to create a deliverable-based structure:
1. Take the committed deliverables from your project charter,
statement of work, or other project concept
documentation. This list of deliverables becomes your Level 1
(highest level) entries within the WBS.
All WBS Entries that directly correspond to deliverables should
be named as noun deliverables or
adjective/noun deliverables. Examples include “Specification”
or “Design Specification”.
2. Take each of these highest level entries, and decompose them
into their component parts (each
becoming a WBS Entry). Each component must be logically
distinct, as everyone who sees the WBS
needs to understand what the deliverable or outcome will be
7. there are required deliverables that are not
already in the WBS but that will be needed to create something
that already is in the WBS.
As an example, you may have a deliverable defined for a
software component (system, subsystem, or function).
However,
to deliver this into the production environment, you may also
need preceding deliverables such as test results, compiled
code, design documentation, and requirements documentation.
These preceding deliverables, even though they haven’t
been committed to, still must be created and therefore must be
in the WBS.
Take all these required deliverables, and decompose them to the
appropriate level of detail, just as you
did for the committed deliverables.
4. Level the hierarchy to the extent that it is possible. At this
stage of development, the WBS may have
some Activities at level two, some at level three, and so on.
See if the hierarchy can be modified so
that the number of levels that Activities fall into is reduced to a
short range.
One way to do this is to examine the number of Activities
falling within a single WBS Entry. If the number is less than
three to five, see if these Activities can be merged with another
WBS Entry’s Activities. If the number is more than 10, see
if the WBS Entry can be split into two logically distinct
components, each with its appropriate Activities. The general
idea
is to attempt to have each WBS Entry that decomposes into
Activities have approximately 7 plus or minus 2 (5 to 9)
Activities.
8. Do this for every WBS Entry, attempting to get each entry in
the WBS to decompose into 5 to 9 lower
level entries. This should be considered as a nice to have, and
not a requirement. You should never
make these changes if the merger or split of a WBS Entry does
not make logical sense.
• When evaluating whether to merge two WBS Entries, the
question to ask is, “are these two
deliverables really part of one deliverable, and is that
deliverable distinct from all others?” If the
answer is yes, then you should combine them, otherwise don’t.
• When evaluating whether to split a WBS Entry with too many
components, the question to ask is,
“does this WBS Entry deliverable have two or more major
components, and can the already
defined lower level deliverables be combined into these
proposed higher level ones?” If the
answer is yes, then you can split the WBS Entry. If the answer
is no, then leave it as is.
5. When you think you have a completed WBS, validate it using
a bottom-up approach. A bottom-up
validation works like this:
• For each WBS Entry that decomposes into Activities, ask
yourself the question: “If I had all the
deliverables from each of these Activities, would my WBS
Entry deliverable be complete?” If the
answer is yes, move on to the next WBS Entry. If the answer is
no, add in the missing Activities.
• Once the evaluation of the lowest level WBS Entries and
Activities is complete, examine the next
higher level of WBS Entries. Keeping with our three-level
10. column, is an example numbering system that is typical of many
that are used, and the far right column
provides the names of the entries as they would appear in your
project plan.
Phase 1 – WBS Level 1 1.0 Requirements Phase
WBS Entry - WBS Level 2 1.1 Business Objectives
Activity – WBS Level 3 1.1.1 Create Draft Objectives
Activity – WBS Level 3 1.1.2 Review Draft Objectives
Activity – WBS Level 3 1.1.3 Update Objectives
Activity – WBS Level 3 1.1.4 Approve Objectives
Milestone – WBS Level 3 1.1.5 Business Objectives Complete
WBS Entry – WBS Level 2 1.2 Draft Requirements
Activity – WBS Level 3 1.2.1 Interview Stakeholders
Activity – WBS Level 3 1.2.2 Write Draft Requirements
Activity – WBS Level 3 1.2.3 …
WBS Entry - Level 2 1.3 Final Requirements
…
Phase 2 – WBS Level 1 2.0 Design Phase
…
Phase 3 – WBS Level 1 3.0 Development Phase
11. …
Phase 4 – WBS Level 1 4.0 Test Phase
…
This example is a typical waterfall type of project plan. Each of
the Phases are major process steps, and as
such usually also happen to be major deliverables.
Steps to create a life cycle-based structure:
1. Take each of the major Phases from the life cycle, and use
them as the highest level entries in the WBS
(Level 1).
2. Take the committed deliverables (as in the deliverables
approach) and use them to create the next level
WBS Entry (Level 2) under the Phases. Place these committed
deliverables within the Phase where
they will be created.
3. Decompose the rest of the WBS just as in the deliverables
approach.
Templates
Both the deliverables-based and the life cycle-based approaches
can take advantage of using standard WBS
structures and standard project templates. There is considerable
time savings for the project manager when
he or she does not have to spend the time to develop a WBS
from scratch, not to mention all the additional
planning information that gets attached to the WBS like
estimates, dependencies, and generic resource
13. impact of four weeks, and an estimated
probability of 25%, then the scheduled duration for the
contingency Activity would be 1 week. (25% x
4 weeks = 1 week).
4. When you define your dependency network, you will want to
create a finish – start dependency link
from each impacted Activity to the appropriate contingency
activity. The normal successor to the
impacted Activity should be defined as a successor to the
contingency activity. When scheduled, you
will have incorporated a compensating factor for the schedule
uncertainty in your project.
5. As for compensating for the cost uncertainty, that is even
easier. Assign to each contingency Activity
the type of resource that reflects the cost in the impact, and the
estimated amount. As an example: if
the impact of the risk event is $100,000, should it occur, and
the likelihood is 40%, then you would
assign a budget resource to the contingency activity, and plan
for a value of $40,000. (40% x $100,000
= $40,000).
Milestones
The final step in completing your WBS is the inclusion of
Milestones. Milestones are major events that
occur during the course of the project, and should have the
following characteristics:
• They are a point in time, and therefore have no duration. In
most project management software, you
define a milestone by setting the duration of an Activity to zero.
• Milestones represent major points of progress within the
project, and will provide a high level means
14. of communicating. Therefore they should represent events that
have significant importance for project
stakeholders. As an example, if the project charter or statement
of work included committed
deliverables that the stakeholders felt were important to the
success of the project, then each of these
committed deliverables should have a milestone representing its
completion.
• Milestones should be named as past tense events. As an
example, “Acceptance Test Completed”. This
communicates two facts: the life cycle phase or the major
deliverable, and the fact that it is completed.
Milestones can also represent the beginning of a process, as in
“Acceptance Test Started”, but the
completion milestones should always be included in the WBS
whereas the start milestones are
optional.
Conclusion
This process for creating a Work Breakdown Structure is a
major, but not the only, planning deliverable a
project manager needs to complete when planning a project. It
is true that you can’t complete your project
planning without a WBS, but it is not true that the WBS is the
only planning you must do. Once the WBS
is completed, you must develop a dependency network, estimate
Activity duration, acquire and assign
resources, calculate and refine the schedule, and baseline the
plan. Many of these steps can be performed
somewhat in parallel, but it is absolutely true that you cannot
complete the dependency network, the
estimates, the work assignments, or the schedule until the WBS
is complete.
16. The quality of physician-patient communication influences
patient health outcomes
and satisfaction with healthcare delivery. Yet, little is known
about contextual factors
that influence physicians' communication with their patients.
The main purpose of
this article is to examine organizational-level factors that
influence patient percep-
tions of physician communication in inpatient settings. We used
the Hospital Con-
sumer Assessment of Healthcare Providers and Systems
(HCAHPS) survey and
American Hospital Association data to determine patients'
ratings of physician
communication at the hospital level, and to collect information
about hospital-level
factors that can potentially influence physician communication.
Our sample con-
sisted of 2,756 hospitals.
We ran a regression analysis to determine the predictors of poor
physician
communication, measured as the percentage of patients in a
hospital who reported
that physicians sometimes or never communicated well. In our
sample of hospitals,
this percentage ranged between 0% and 21%, with 25% of
hospitals receiving poor
ratings from more than 6% of patients. Three organizational
factors had statistically
significant negative associations with physician communication:
for-profit owner-
ship, hospital size, and hospitalists providing care in the
hospital. On the other
hand, the number of full-time-equivalent physicians and dentists
per 10,000 inpa-
17. tient days, physician ownership of the hospital, Medicare share
of inpatient days, and
public ownership were positively associated with patients'
ratings of physician
communication. Physician staffing levels are an understudied
area in healthcare
research. Our findings indicate that physician staffing levels
affect the quality of
physician communication with patients. Moreover, for-profit
and larger hospitals
should invest more in physician communication given the role
that HCAHPS plays
in value-based purchasing.
For more information about the concepts in this article, contact
Dr. Al-Amin at
[email protected]
28
mailto:[email protected]
Patients' Ratings of P hysician Communication
I N T R O D U C T I O N
Patient-physician relationships, and
communication specifically, influence
patient outcomes, patient satisfaction,
recall of information, and adherence to
treatment regimens (Chang et al., 2006;
Roter, 1989; Schneider, Kaplan, Green-
field, Li, & Wilson, 2004; Zachariae et
ah, 2003). Evidence also indicates that
physician communication is associated
with a shorter length of stay and fewer
complications (Trummer, Mueller,
18. Nowak, Stidl, & Pelikan, 2006). As
Windish and Olson (2011, p. 44)
pointed out, the "patient-physician
relationship is the cornerstone for
quality of health care." The ll.S. Medical
Licensing Examination and Accredita-
tion Council for Graduate Medical
Education emphasizes the importance
of patient-physician communication
through the evaluation of residents'
communication skills (Zolnierek <&
DiMatteo, 2009). The Hospital Con-
sumer Assessment of Healthcare Provid-
ers and Systems (HCAHPS) survey has
provided publicly available data pertain-
ing to patients' hospital experiences.
HCAHPS results were first reported
publicly in March 2008 (Rothman, Park,
Hays, Edwards, & Dudley, 2008).
HCAHPS contains measures of interper-
sonal communication, specifically
quality of communication with physi-
cians and nurses. In 2009, 1 year after
HCAHPS scores were first released,
hospitals witnessed a modest improve-
ment in their overall ratings and patient
ratings on all dimensions, with the
exception of physician communication
(Elliott et al., 2010).
Clever, fin, Levinson, and Meltzer
(2008) argue that physician commu-
nication is significantly associated with
patient satisfaction and with patients'
overall ratings of their hospital experi-
19. ence. Therefore, physician communica-
tion is not only important for its impact
on patient outcomes but also is impor-
tant because of its role in influencing
overall patient ratings of the hospital
(O'Malley et al., 2005). Patient percep-
tions and overall ratings of the inpatient
experience have emerged as important
indicators of hospital performance.
Value-based purchasing (VBP) provides
financial incentives for hospitals to
improve HCAHPS scores and to main-
tain good scores (Elliott et al., 2010).
Hence, patient ratings of the hospital
experience are an aspect of care that can
potentially influence the hospital's
livelihood. Among the care dimensions
that influence patient perceptions of
quality of care, physician communica-
tion is one of the most important. In
fact, pay-for-performance initiatives will
become tied less to technical competen-
cies and more to the quality of patient-
physician interactions (Safavi, 2006b).
While ample literature exists regard-
ing the impact of patient-physician
communication on patient satisfaction,
clinical outcomes, and organizational
outcomes (Hammerly, Harmon, &
Schwaitzberg, 2014), limited research is
available on the organizational factors
that shape this communication. Physi-
cian behavior, including physician
communication, does not occur in a
vacuum, but is influenced by organiza-
20. tional structure, environment, and
culture. Physicians' attitudes about
healthcare organizations may influence
their cooperative behavior, and these
attitudes are shaped by the degree to
29
Journal of H ealthcare Management 61:1 January/F ebruary
2016
which physicians identify with the
organization (Dukerich, Golden, &
Shortell, 2002). Furthermore, Ham-
merly et al. (2014) argue that organiza-
tional efforts to improve physician
alignment should take into consider-
ation physicians' emotional intelligence,
including their communication and
interpersonal skills.
The main purpose of this study is to
examine organizational-level factors that
influence physician communication
with patients in inpatient settings.
Physicians operate in an organizational
context and, although communication
skills vary at the individual level, organi-
zational structure, culture, staffing levels,
availability of electronic health records
(EHRs), and other organizational-level
factors affect physicians and, in turn, the
time, commitment, and incentives they
have to provide better patient experi-
21. ences. This study contributes to our
understanding of how organizational
factors may affect physician communi-
cation, as measured by HCAHPS scores.
Given patient expectations, the potential
for financial penalties, and the negative
impact that poor physician communica-
tion can have on a hospital's public
image, this understanding is crucial for
hospital leaders.
Physician ownership of hospital
shares, defined by the American Hospi-
tal Association (AHA) (2009) as a
hospital "owned in whole or in part by
physicians or a physician group," is one
factor that influences physicians' align-
ment and identification with the hospi-
tal and, thus, their attitudes toward
hospital performance and success, their
subsequent behavior, and its effects on
organizational performance (McCarthy,
Reeves, & Turner, 2010). The organiza-
tional theory literature contains ample
research on the role of employee owner-
ship and its influence on organizational
performance, especially for professional
service firms such as hospitals (Klein,
1987; Long, 1980). Physician ownership
has also been examined in previous
healthcare research about the effects of
organizational factors on the quality of
physicians' services (Conrad & Chris-
tianson, 2004) and on patients' satisfac-
tion, as evidenced by HCAHPS ratings
22. (Makarem & Al-Amin, 2014).
In addition to ownership, which
might influence physicians' attitudes,
operational variables (such as physician
staffing levels and number of full-time-
equivalent [FTE] physicians available for
a certain number of inpatient days) are
likely to affect quality of care, the
amount of time the physician has to
take care of patients, and the quality of
physician communication. Although the
effect of nurse staffing levels on patient
satisfaction has received a lot of atten-
tion from researchers (Aiken, Clarke,
Sloane, Sochalski, & Silber, 2002; Vahey,
Aiken, Sloane, Clarke, & Vargas, 2004),
the relationship between physician
staffing levels and quality and patient
experience is understudied. Shanafelt et
al. (2012) found a prevalence of burn-
out among physicians in the United
States, which can have detrimental
effects on quality of care, but their study
did not take physician staffing levels
into account.
Given the critical role that physician
communication plays in patient out-
comes and satisfaction, it is important
to explain the variation in patient
ratings of physician communication not
30
23. Patients' Ratings of Physician Communication
just between patients, but also between
hospitals. To that end, we take a step
back from understanding how to
improve physician communication to
focus on establishing a clearer picture of
the effects of organizational-level factors
on patient perceptions of physician
communication.
C O N C E P T U A L F R A M E W O R K
The conceptual framework by Donabe-
dian (1980) has been used frequently in
health services research on quality.
According to this framework, there are
three categories for assessing quality:
(1) structure—organizational character-
istics or attributes, such as staff-to-
patient ratio, that influence care delivery;
(2) process—protocols, practices, and
the actual steps followed in delivering
the service; and (3) outcomes—measures
such as survival and mortality rates,
readmission rates, and patient satisfac-
tion and number of complaints (Blies-
mer, Smayling, Kane, & Shannon, 1998;
Davis, 1991). Both structure and process
influence outcomes.
Donabedian differentiates between
two domains of quality: (1) technical, the
medical and clinical dimensions of care
such as mortality and survival rates, and
(2) interpersonal, the sociopsychological
24. features of physician-patient communi-
cation (Cleary & McNeil, 1988). We focus
on physician communication, an inter-
personal dimension of quality, which
also influences technical quality because
poor physician-patient communication
can result in patients' not understanding
their treatment regimen and in not
complying with physicians' orders and
recommendations (Cleary & McNeil,
1988). Our main objective is to
determine how structural dimensions
influence physician-patient communica-
tion. We hypothesize that a higher
physician staffing level, a key structural
attribute, is associated with higher ratings
of physician-patient communication.
Using HCAHPS data, Kutney-Lee et al.
(2009) found that nurse staffing levels
were significantly related to patients'
ratings of nurse communication. We
predict a similar relationship between
physician staffing levels and patients'
ratings of physician communication.
M E T H O D S
Data Sources
We used two sources of secondary data
to determine patients' ratings of physi-
cian communication at the hospital
level and hospital-level factors that
could potentially influence the quality
of physician communication. We used
2009 HCAHPS survey data, which are
publicly available on the Centers for
25. Medicare & Medicaid Services Hospital
Compare website. The HCAHPS survey
was developed to assess patients' experi-
ences of their hospital stay, and its
validity and reliability are supported by
several studies (Goldstein, Farquhar,
Crofton, Darby, & Garfinkel, 2005;
O'Malley et al., 2005; Rothman et al.,
2008). The publicly available data adjust
for patient-mix factors such as age,
education, health status, and method of
suivey administration (Elliott et al.,
2009; Jha, Joynt, Orav, & Epstein, 2012).
Physician communication, one of the
eight dimensions in HCAHPS, is mea-
sured by asking patients to rate how
often their doctors communicated well
with them. The final results are then
31
Journal of H ealthcare M anagement 61:1 January/ F ebruary
2016
reported as the percentage of patients in
a hospital who responded (1) always,
(2) usually, and (3) sometimes or never.
For our analysis, we merged the
AHA annual survey database (2009)
with HCAHPS data. All organizational-
level variables were derived from the
AHA database. Specifically, we retrieved
information about hospital size, FTE
26. physicians and dentists per 10,000
inpatient days, hospitalists providing
care at the hospital, physician owner-
ship, for-profit ownership, public
ownership, teaching status, specialty
status, Medicare share of admissions
(i.e., Medicare admissions divided by
total admissions), EHRs, and high
technology index.
V a ria b le s
Dependent Variable
Because we were interested in organiza-
tional factors that could impede the
quality of patient-physician communica-
tion, we defined our dependent variable
as the percentage of patients in a hospital
who reported that physicians "sometimes
or never" communicated well. This
variable was reported in HCAHPS.
Independent Variables
The AHA database includes data regard-
ing part-time and FTE hospital staff.
However, the data do not distinguish
between inpatient and outpatient
settings, and they report FTE medical
doctors (MDs) and dentists as one
measure; hence, we were unable to
exclude dentists from our staffing vari-
able. From the AHA database, we
included one staffing measure in our
model: FTE MDs and dentists per 10,000
patient days. Several studies have used
27. the number of FTE registered nurses
(RNs) per 1,000 patient days as a mea-
sure of RN staffing levels (Kane, Shamli-
yan, Mueller, Duval, & Wilt, 2007; Mark,
Harless, McCue, & Xu, 2004). We created
a similar variable for physician staffing
level by dividing the number of FTE MDs
and dentists by inpatient days and
multiplying the quotient by 10,000; we
used 10,000 instead of 1,000 because the
number of MDs and dentists at a hospi-
tal is often much smaller than the
number of RNs. While studies tradition-
ally have examined the impact of nurse
staffing levels on quality and patient
satisfaction (Aiken et al., 2002; Bond,
Raehl, Pitterle, & Frank, 1999; McCue,
Mark, & Harless, 2003), ours is among
the first studies to examine the role of
physician staffing levels. Pharm, Raehl,
and Pitterles (1999) were among the few
researchers to investigate the relationship
between physician staffing levels and
quality of care, but they used hospital
mortality rate, a technical measure of
quality of care, as their outcome measure
and found the relationship to be insig-
nificant (White & Glazier, 2011). We also
included a dummy variable indicating
whether hospitalists provide care at the
hospital. Previous research indicates no
difference in patient satisfaction between
those treated by hospitalists and those
treated by primary care providers (Seiler
et al., 2012). However, given the growth
of hospitalists in the past decade, it is
28. important to compare hospitals that have
hospitalists with those that do not in
terms of physician communication
ratings.
Previous research findings indicate
that physician ownership has a positive
association with patients' overall ratings
3 2
Patients' Ratings of P hysician Communication
of the hospital experience (Makarem &
Al-Amin, 2014). According to Long
(1980), ownership results in increased
involvement and commitment. In fact,
when their incomes and reputation are
tied to hospital performance, physicians
are more driven to help the hospital
enhance its performance and achieve its
goals. Therefore, we included a dummy
variable—"hospital owned in whole or
in part by physicians or a physician's
group"—in our model to investigate the
effect of physician ownership on physi-
cian communication.
We also created a high-technology
index, which is the total number of
technologies or services in a hospital
that are considered to be high technol-
ogy. The AHA database contains a list of
technologies and services available in
29. hospitals. Here are the high-technology
services, which we modified from
Landon et al. (2006):
1. Adult cardiac surgery
2. Adult diagnostic/invasive
catheterization
3. Certified trauma center
4. Extracorporeal shock-wave
lithotripter
5. Bone marrow transplant services
6. Heart transplant
7. Kidney transplant
8. Liver transplant
9. Lung transplant
10. Tissue transplant
11. Other transplant
12. Robotic surgery
13. Computer-assisted orthopedic
surgery
We controlled for organizational
characteristics that have been found to
influence HCAHPS ratings (Jha, Orav,
Zheng, & Epstein, 2008; Lehrman et al.,
2010). We classified hospitals as teach-
ing hospitals if they belonged to the
Council of Teaching Hospitals and
Health Systems. Other organizational
factors included as predictors in our
model are hospital size (measured as
the number of beds in a hospital),
30. for-profit ownership, public ownership,
presence of fully implemented EHRs,
specialty hospital, and Medicare share of
inpatient days. Specialty hospital is a
dichotomous variable indicating
whether the hospital is a limited service
hospital, on the basis of the AHA
database. We included these organiza-
tional variables in the model because of
their documented influence on patient
ratings of hospital experience or quality
of care (Jha et al., 2008; Makarem &
Al-Amin, 2014).
R e g r e s s i o n A n a l y s i s a n d S a m p l e
D e s c r i p t i o n
We ran the regression analysis using
statistical software (Stata 13, StataCorp)
to determine the association between
ratings of physician communication and
organizational-level predictors. Outliers
or extreme values influence regression
parameters and, therefore, are of con-
cern in any regression analysis. High
leverage refers to data points that have
extreme values on a given predictor
(Bobko, 2001). High leverage is of
specific concern to this study because
one of the main independent variables—
FTE MDs and dentists per 10,000
inpatient days—has not, to our knowl-
edge, been validated in the literature.
33
31. Journal of H ealthcare M anagement 61:1 January/ F ebruary
2016
Therefore, we paid specific attention to
this variable. After removing hospitals
with missing data, we found a mean of
5.92 FTE MDs and dentists per 10,000
inpatient days, with a standard devia-
tion (SD) of 17 (75th percentile = 5.71
and maximum value = 625). Clearly,
there were points with high leverage.
Therefore, we used the extremes com-
mand in the statistical software, which
reports the top five cases with extreme
values, and we eliminated these cases
from the data set (values ranged from
203 to 625 FTE MDs and dentists per
10,000 inpatient days). Our final sample
consisted of 2,756 hospitals.
In our sample of hospitals, 9% have
teaching status, 14% are for-profits, 18%
are public hospitals, only 5% are par-
tially or fully owned by physicians, 3%
are specialty hospitals, 68% have hospi-
talists providing care, and 23% have
fully implemented EEIRs (77% had
either partially implemented EHRs or no
EHRs). The average hospital size is 210
beds, the average number of FTE MDs
and dentists per 10,000 inpatient days is
5.5, and the average Medicare share of
admissions is 50%. The hospitals in our
sample have an average of 2.4 services or
32. technologies out of a maximum possible
high technology index score of 13. Table
1 provides details about characteristics
of the hospitals. After testing for multi-
collinearity, we found a significant
correlation between hospital size and
high technology index (r = 0.74).
Therefore, we dropped the high technol-
ogy index variable from the model.
Given the recommended threshold of 10
for variance inflation factors, we found
no further evidence of multicollinearity
in the regression model (Hair, Tatham,
Anderson, & Black, 2006).
T A B L E 1
C h a ra c te r is tic s of H o s p ita ls in th e S a m p le
N o . (%) of H o s p ita ls
C h a ra c te r is tic s N = 2 ,7 5 6 M e a n (SD)
Teaching Hospital (Belongs to COTH) 256 (9 ) —
For-Profit Ownership 386 (14) —
Public Ownership 493 (18) —
Physician Ownership 136(5) —
Specialty Status 91 (3) —
Hospitalists Provide Care 1,879 (68) —
Fully Implemented Electronic Health Records 637 (23) —
Number of Beds — 210 (212)
33. Full-Time-Equivalent Physicians and Dentists per — 5.48
(10.96)
10,000 Inpatient Days
Medicare % of Inpatient Days — 50.5 (16.88)
Note. SD = standard deviation; COTH = Council ofTeaching
Hospitals and Health Systems.
3 4
Patients' Ratings of P hysician Communication
T A B L E 2
E ffe c ts o f O rg a n iz a tio n a l F a c to rs on P a t ie n ts ’
R a t in g s of P h y s ic ia n C o m m u n ic a tio n
P re d ic to r
R e g re s s io n
C o e ffic ie n t t /7 V a lu e *
Teaching Hospital (Belongs to COTH) 0.0922 0.53 .596
For-Profit Hospital 1.2775 9.24 «* .000
Public Ownership -0.3917 -3.53 « .000
Specialty Status -1.1109 0.48 .630
Physician Ownership -1.5118 -6.85 « .000
Electronic Health Records 0.1204 1.22 .223
Num ber of Beds 0.0027 10.57 = .000
Full-Time-Equivalent Physicians and
Dentists per 10,000 Inpatient Days -0.0084 -2.22 .026
Hospitalists Provide Care 0.7252 7.73 =» .000
Medicare % of Inpatient Days -0.0066 -2.6 .009
34. Note. F( 10,2756) = 53.75 (p < .001); adjusted R2 = 0.16; N =
2,756.
Note. Dependent variable: physician communication =
percentage of patients who rated "physician communicated
well" as
"sometimes or never."
*p value significant at < .05.
R E S U L T S
In our sample of 2,756 hospitals, an
average of 4.65% (SD = 2.32%) of
patients reported that physicians com-
municated well "sometimes or never."
In the best-performing hospitals, no
patients reported that physicians some-
times or never communicated well,
whereas 21 % of patients in the worst-
performing hospitals reported that
physicians sometimes or never commu-
nicated well. In 25% of the hospitals,
more than 6% of patients reported that
physicians communicated poorly.
The regression analysis results
indicate that the regression model is
significant with F = 53.75 (p < .001),
and that the predictors in our model
account for 16% of the variance in
physician ratings (Table 2). The results
also show that all but three hospital-
level factors have a statistically signifi-
cant association with patient ratings of
35. physician communication at a .05
significance level. The hospital's spe-
cialty status, teaching status, and avail-
ability of fully implemented EHRs had
no significant association with ratings of
physician communication. Hospital
size, hospitalists' providing care at the
hospital, and for-profit ownership were
significant predictors of, and positively
associated with, the percentage of
patients who rated physician communi-
cation poorly (p < .01). For-profit
hospitals and larger hospitals received
poorer patient ratings of physician
communication. Also, the percentage of
patients who reported poor physician
communication was higher in hospitals
35
Journal of H ealthcare M anagement 61:1 January/ F ebruary
2016
in which hospitalists provided care (p <
.01). To investigate this further, we ran a
single-factor analysis of variance fol-
lowed by a Tukey Honest Significant
Difference post hoc test to compare
physician communication ratings
between (1) hospitals in which hospital-
ists did not provide care, (2) hospitals
that contracted with independent
hospitalists groups, and (3) hospitals
that employed hospitalists. The results
36. of our analysis show a significant
difference between the three groups in
the mean percentage of patients who
reported poor physician communication
(p < .001). Hospitals in which hospital-
ists did not provide care had the lowest
percentage (3.8%) of patients reporting
poor physician communication, fol-
lowed by hospitals that employed
hospitalists (4.8%). Hospitals that
contracted with independent hospitalist
groups had the highest percentage of
patients (5.2%) reporting poor physi-
cian communication.
In contrast, FTE MDs and dentists
per 10,000 inpatient days, physician
ownership, public ownership, and
Medicare share of inpatient days had
statistically significant negative associa-
tions with the percentage of patients
who rated physician communication
poorly. In our sample, hospitals with
more FTE MDs and dentists per 10,000
inpatient days had a lower percentage of
patients reporting poor physician
communication (p = .026). In other
words, lower physician staffing levels are
associated with poorer patient ratings of
physician communication. Also, hospi-
tals that are fully or partially owned by
physicians had a lower percentage of
patients reporting that physicians
communicated poorly (p < .01). Simi-
larly, public hospitals and those with a
37. higher share of Medicare inpatient days
had a lower percentage of patients
reporting poor physician communica-
tion (p < .01).
D I S C U S S I O N
The healthcare system in the United
States has moved toward VBP, which
rewards or penalizes hospitals on the
basis of their performance on patient
experiences, clinical processes, patient
outcomes, and, in the future, hospital
efficiency (Ryan & Damberg, 2013).
Moreover, patients' ratings of hospital
stays and outcome measures are now
publicly available. Given the impact that
VBP could have on hospital financial
performance and the impact that public
reporting could have on patients' choice
of hospitals, patient satisfaction with
physician communication is a key
improvement area for hospitals. An
organization's contextual factors influ-
ence employee behavior, yet research is
scarce regarding how hospital-level
factors affect physician performance and
behavior. Understanding hospital-level
variables that influence physician
performance is important, especially in
relation to physician communication
and interpersonal skills (Glick, 1985).
This study offers a better understanding
of organizational factors that impede
physician performance in an inpatient
setting by examining the effects of
various hospital characteristics on
38. patient perceptions of physician
communication.
In addition to considering multiple
organizational factors commonly
examined in healthcare quality research,
3 6
Patients' Ratings of P hysician C ommunication
this study sheds some light on the role
of factors, such as physician staffing,
that have been overlooked in previous
research. To the best of our knowledge,
no other studies have specifically
investigated how these organizational
factors predict poor patient-physician
communication. Our model shows a
statistically significant association
between many organizational factors—
7 out of 10 considered—and physician
communication. Consequently, organi-
zational factors should be included
when studying patient perceptions of
hospital performance and more specifi-
cally physician performance. Our study
findings have important implications for
physicians, hospital managers, and
policymakers.
One main and novel finding is the
significant role of physician staffing
levels, which is associated with patient
39. perceptions of physician communica-
tion. Given the prevalence of physician
burnout in the United States (Shanafelt
et al., 2012), this is an important finding
that sheds light on an underexplored
hospital-level factor that potentially
could influence quality of care and
patient experiences. Driven by hospitals'
interest in increasing market share and
aligning incentives with those of physi-
cians, hospitals have been employing
full-time physicians at a quick pace since
the passage of the Affordable Care Act
(ACA) (O'Malley, Bond, & Berenson,
2011). As hospitals rely more on physi-
cian employees, we need to be aware of
how physician workload or physician
staffing levels affect patient experiences.
By focusing solely on nurse staffing,
which is not directly linked to patient
ratings of physician communication,
most studies have overlooked the
influence of physician staffing on health
outcomes and patient satisfaction. A
smaller number of FTE MDs and den-
tists per 10,000 patient days indicates
higher workloads and, consequently,
less time and energy to spend with
patients. Because this can have a detri-
mental effect on the quality of patient-
physician communication, hospital
managers should pay special attention
to physician staffing levels. Another key
factor related to physician staffing is the
association between hospitalists and
40. patient ratings of physician communica-
tion. Our findings indicate that hospi-
tals that contract with independent
hospitalist groups had the poorest
ratings of physician communication.
Thus, it is important to differentiate
between the various arrangements
hospitals have with hospitalists provid-
ing inpatient care.
Another key hospital-level predictor
of physician communication ratings is
physicians' full or partial ownership of
the hospital. Our findings indicate that
hospitals in which physicians own
shares receive a lower percentage of poor
physician communication ratings than
hospitals in which physicians do not
own shares. This finding is not surpris-
ing given that ownership influences
employee attitudes, commitment, and
performance (Klein, 1987; McCarthy et
al., 2010). In line with the literature, our
study found that physician ownership is
likely to influence the quality of
patient-physician communication and,
thus, patient experiences, satisfaction
levels, and ratings.
Consistent with previous research,
our findings show that for-profit
37
41. Journal of H ealthcare M anagement 61:1 January/ F ebruary
2016
hospitals and hospitals that are larger in
size receive poorer patient ratings of
physician communication. In fact,
studies have reported lower patient
ratings of their overall hospital experi-
ence in for-profit hospitals (Jha et al.,
2012). The main goal of for-profit
hospitals is to generate profits for
shareholders. This goal is usually
achieved with a focus on efficiency,
which might come at the expense of the
patient experience. Also, research
findings indicate that size is negatively
associated with patients' overall ratings
of their hospital experience, with
smaller hospitals reporting better ratings
(Jha et al., 2008). Therefore, for-profit
hospitals and larger hospitals should
pay special attention to the quality of
physician communication and imple-
ment strategies and incentive systems for
improving it.
C O N C L U S I O N
S tu d y L im i t a t io n s
This study has a number of limitations.
First, the cross-sectional nature of the
data, limited to HCAHPS ratings 1 year
after the survey's public release, does not
allow for observing changes in physician
communication over time or how these
changes may have been affected by
42. organizational-level factors. Second,
although we considered organizational
factors that are commonly examined in
healthcare research, other factors—such
as organizational culture, physician job
satisfaction, and physician training—
could have significant effects on physi-
cian communication. Our findings
indicate that a fully implemented EHR
has no significant association with
patient perceptions of physician commu-
nication; however, our study did not take
into account whether physicians have
been trained to effectively communicate
with their patients using EHRs.
Finally, there are limitations associ-
ated with some of our measures.
Although we created a physician staffing
level variable that is similar to the
commonly used measure for nurse
staffing, this measure, to our knowl-
edge, has not been tested or validated in
other studies. Also, our outcome
variable—patients' ratings of physician
communication—is measured in
HCAHPS by means of a frequency scale
ranging from "sometimes or never" to
"always," rather than by asking patients
to rate the quality of communication
using scale points such as "poor" or
"excellent." This can limit the validity of
the measure because "always" is not
necessarily the same as "excellent"
(Reeves, Binder, & Grida, 2008).
43. P r a c t ic a l Im p l ic a t io n s a n d F u tu r e
R e s e a r c h D ir e c t io n s
With the exception of the teaching and
specialty status and the availability of
fully implemented EHRs, all remaining
seven hospital-level factors examined in
this study were significant predictors of
patient ratings of physician communica-
tion. Thus, organizational-level factors
should be considered in future research
aimed at examining different aspects of
healthcare quality, especially patient
perceptions and ratings of hospitals.
Hospital leaders should be concerned
about public reporting of data and how
this may affect their bottom line. The
results of this study indicate that hospi-
tals may be able to improve the patient
3 8
Patients' Ratings of P hysician Communication
experience, evidenced by HCAHPS
ratings, by paying attention to organiza-
tional factors such as staffing, the
hospitalists model, physician workload,
and physician engagement and align-
ment with organizational goals.
Specifically, hospitals need to pay
attention to physician staffing levels.
Moreover, hospitals that rely on hospi-
44. talists need to consider the benefits and
disadvantages of employing hospitalists
versus contracting with independent
groups. Doing so is important, not only
with regard to patient ratings, but also
with regard to outcomes and efficiency.
While offering physicians shares in
the hospital is not a feasible option after
the passage of the ACA, different mecha-
nisms are available through which
hospitals can provide physicians with a
sense of ownership and, hence,
strengthen the incentive to provide a
better patient experience. An example is
participating bond transactions (PBTs),
which tie physician income to hospital
performance. PBTs are tax-exempt bonds
that carry a high yield of about 11% to
14%, and the interest payment depends
on hospital performance; thus, these
bonds result in strong alignment
between physicians and hospitals
(Al-Amin, Weech-Maldonado, & Prad-
han, 2013; Safavi, 2006a).
In an increasingly competitive
market, public reporting of patient
ratings can push hospitals to perform
better to sustain their market share
(Chou, Deily, Li, & Lu, 2014). Research
is needed to further understand organi-
zational changes that can lead to
improved physician communication
over time. Researchers should examine
the long-term effect of public reporting
45. on physicians' behavior, especially their
communication with patients. In
addition to longitudinal studies of
secondary HCAHPS and AHA data,
researchers could benefit from using
different methodologies, such as case
studies and matched control designs, to
compare hospitals with similar capabili-
ties and target markets to gain a deeper
understanding of how organizational
factors affect the quality of physician
communication.
R E F E R E N C E S
Aiken, L. H., Clarke, S. P., Sloane, D. M.,
Sochalski, J., & Silber, J. H. (2002).
I lospital nurse staffing and patient
mortality, nurse burnout, and job dissatis-
faction. Journal of the American Medical
Association, 288(16), 1987-1993.
Al-Amin, M., Weech-Maldonado, R., & Pradhan,
R. (2013). Hospital-physician relation-
ships: Implications from the professional
service firms literature. Advances in Health
Care Management, 15, 165-184.
American Hospital Association. (2009). 2009
AHA annual survey health forum. Retrieved
from http://www.ahadataviewer.com
/Global/survey%20instruments/AHA
_Annual_Survey_FY09.pdf
Bliesmer, M. M., Smayling, M., Kane, R. L., &
46. Shannon, I. (1998). The relationship
between nursing staffing levels and
nursing home outcomes. Journal of Aging
and Health, 10(3), 351-371.
Bobko, P. (2001). Correlation and regression:
Applications for industrial organizational
psychology and management. Thousand
Oaks, CA: Sage Publications.
Bond, C. A., Raehl, C. L„ Pitterle, M. E„ &
Franke, T. (1999). Health care professional
staffing, hospital characteristics, and
hospital mortality rates. Pharmacotherapy,
19(2), 130-138.
Chang, J. T„ Hays, R. D„ Shekelle P. G„
MacLean, C. I I., Solomon, D. H., Reuben,
D. B„ . . . Wenger, N. S. (2006). Patients'
global ratings of their health care are not
associated with the technical quality of
their care. Annals of Internal Medicine,
144(9), 665-672.
39
http://www.ahadataviewer.com
Journal of H ealthcare M anagement 61:1 January/F ebruary
2016
Chou, S. Y„ Deily, M. E„ Li, S„ & Lu, Y. (2014).
Competition and the impact of online
hospital report cards. Journal of Health
Economics, 34, 42-58.
47. Cleary, P. D., & McNeil, B. J. (1988). Patient
satisfaction as an indicator of quality care.
Inquiry, 25{ 1), 25-36.
Clever, S. L., Jin, L., Levinson, W., & Meltzer, D.
O. (2008). Does doctor-patient commu-
nication affect patient satisfaction with
hospital care? Results of an analysis with a
novel instrumental variable. Health Services
Research, 43(5), 1505-1519.
Conrad, D. A., & Christianson, J. B. (2004).
Penetrating the 'black box': Financial
incentives for enhancing the quality of
physician services. Medical Care Research
and Review, 61 (3), 37-68.
Davis, M. A. (1991). On nursing home quality:
A review and analysis. Medical Care
Research and Review, 48(2), 129-166.
Donabedian, A. (1980). Exploration in quality
assessment and monitoring (Vol. 1): The
definition of quality and approaches to its
assessment. Chicago, IL: Health Administra-
tion Press.
Dukerich, J. M., Golden, B. R., & Shortell, S. M.
(2002). Beauty is in the eye of the
beholder: The impact of organizational
identification, identity, and image on the
cooperative behaviors of physicians.
Administrative Science Quarterly, 47(3),
507-533.
48. Elliott, M. N„ Lehrman, W. G., Goldstein, E.
H., Giordano, L. A., Beckett, M. K., Cohea,
C. W., & Cleary, P. D. (2010). Hospital
survey shows improvements in patient
experience. Health Affairs, 29(11),
2061-2067.
Elliott, M. N., Zaslavsky, A. M., Goldstein, E.,
Lehrman, W., Hambarsoomians, K.,
Beckett, M. K., & Giordano, L. (2009).
Effects of survey mode, patient mix, and
nonresponse on CAHPS hospital survey
scores. Health Services Review, 44(2.1),
501-518.
Glick, W. H. (1985). Conceptualizing and
measuring organizational and psychologi-
cal climate: Pitfalls in multilevel research.
Academy of Management Review, 10(3),
601-616.
Goldstein, E„ Farquhar, M., Crofton, C., Darby,
C., & Garfinkel, S. (2005). Measuring
hospital care from the patients' perspec-
tive: An overview of the CAHPS hospital
survey development process. Health
Services Research, 40(6.2), 1977-1995.
Hair, J. F., Tatham, R. L., Anderson, R. E„ &
Black, W. (2006). Multivariate data analysis.
Upper Saddle River, NJ: Pearson Prentice
Hall.
Hammerly, M. E„ Harmon, L„ & Schwaitzberg,
S. D. (2014). Good to great: Using
49. 360-degree feedback to improve physician
emotional intelligence. Journal of Health-
care Management, 59(5), 354-365.
Jha, A. K., Joynt, K. E., Orav, E. J., & Epstein, A.
M. (2012). The long-term effect of premier
pay for performance on patient outcomes.
New England Journal of Medicine, 366,
1606-1615.
Jha, A. K., Orav, E. J., Zheng, J., & Epstein, A. M.
(2008). Patients' perceptions of hospital
care in the United States. New England
Journal of Medicine, 359(18), 1921-1931.
Kane, R. L., Shamliyan, T. A., Mueller, C.,
Duval, S„ & Wilt, T. J. (2007). The
association of registered nurse staffing
levels and patient outcomes: Systematic
review and meta-analysis. Medical Care,
45(12), 1195-1204.
Klein, K. J. (1987). Employee stock ownership
and employee attitudes: A test of three
models. Journal of Applied Psychology,
72(2), 319-332.
Kutney-Lee, A., McHugh, M. D., Sloane, D. M.,
Cimiotti, J. P., Flynn, L., Neff, D. F„ &
Aiken, L. H. (2009). Nursing: A key to
patient satisfaction. Health Affairs, 28(4),
w669-w677.
Landon, B. E., Normand, S. L., Lessler, A.,
O'Malley, A. J., Schmaltz, S., Loeb, J. M., &
McNeil, B. J. (2006). Quality of care for
50. the treatment of acute medical conditions
in US hospitals. Archives of Internal
Medicine, 166(22), 2511-2517.
Lehrman, W. G., Elliott, M. N„ Goldstein, E.,
Beckett, M. K., Klein, D. J., & Giordano, L.
A. (2010). Characteristics of hospitals
demonstrating superior performance in
patient experience and clinical process
measures of care. Medical Care Research and
Review, 67(1), 38-55.
Long, R. J. (1980). Job attitudes and organiza-
tional performance under employee
ownership. Academy of Management
Journal, 23(4), 726-737.
Makarem, S. C., & Al-Amin, M. (2014). Beyond
the service process: The effects of organiza-
tional and market factors on customer
4 0
P atients ' Ratings of P hysician C ommunication
perceptions of health care services. Journal
of Service Research, 17(4), 399-414.
Mark, B. A„ Harless, D. W., McCue, M., & Xu, Y.
(2004) . A longitudinal examination of
hospital registered nurse staffing and
quality of care. Health Services Research,
39(2), 279-300.
51. McCarthy, D., Reeves, E., & Turner, T. (2010).
Can employee share-ownership improve
employee attitudes and behaviour?
Employee Relations, 32(4), 382-395.
McCue, M., Mark, B. A., & Harless, D. W.
(2003). Nurse staffing, quality, and
financial performance. Journal of Health
Care Finance, 29(4), 54-76.
O'Malley, A. S., Bond, A. M., & Berenson, R. A.
(2011). Rising hospital employment of
physicians: Better quality, higher costs?
Issue Brief: Center for Studying Health System
Change, 136, 1-4.
O'Malley, J. A., Zaslavsky, A. M., Hays, R. D.,
Hepner, K. A., Keller, S„ & Cleary, P. D.
(2005) . Exploratory factor analyses of the
CAHPS hospital pilot survey responses
across and within medical, surgical, and
obstetric services. Health Services Research,
40(6.2), 2078-2095.
Pharm, B., Raehl, C., & Pitterles, M. (1999).
Hospital mortality rates. Pharmacotherapy,
19(2), 130-138.
Reeves, )., Binder, J., & Grida, J. C. (2008).
More is not necessarily better. Marketing
Health Services, 28, 24-29.
Roter, D. (1989). Which facets of communica-
tion have strong effects on outcome: A
meta-analysis. In M. Stewart & D. Roter
(Eds.), Communication with medical patients.
52. Newbury Park, CA: Sage Publications.
Rothman, A., Park, H., Hays, R., Edwards, C., &
Dudley, A. (2008). Can additional patient
experience items improve the reliability of
and add new domains to the CAHPS
hospital survey? Health Services Research,
43(6), 2201-2222.
Ryan, A. M., & Damberg, C. L. (2013). What
can the past of pay-for-performance tell us
about the future of value-based purchasing
in Medicare? Healthcare, 1(1), 42-49.
Safavi, K. (2006a). Aligning financial incen-
tives. Journal of Healthcare Management,
51(3), 146-151.
Safavi, K. (2006b). Patient-centered pay for
performance: Are we missing the target?
Journal of Healthcare Management, 51(4),
215-218.
Schneider, J., Kaplan, S. H., Greenfield, S., Li,
W., & Wilson, I. B. (2004). Better physician-
patient relationships are associated with
higher reported adherence to antiretroviral
therapy in patients with HIV infection.
Journal of General Internal Medicine, 19(11),
1096-1103.
Seiler, A., Visintainer, P., Brzostek, R., Ehres-
man, M., Benjamin, E„ Whitcomb, W., &
Rothberg, M. B. (2012). Patient satisfac-
tion with hospital care provided by
hospitalists and primary care physicians.
53. Journal of Hospital Medicine, 7(2), 131-136.
Shanafelt, T. D., Boone, S., Tan, L., Dyrbye, L.
N., Sotile, W„ Satele, D., . . . Oreskovich,
M. R. (2012). Burnout and satsifaction
with work-life balance among US physi-
cians relative to the general US popula-
tion. Archives of Internal Medicine, 172(18),
1377-1385.
Trammer, U. F., Mueller, U. O., Nowak, P,
Stidl, T., & Pelikan, J. M. (2006). Does
physician-patient communication that
aims at empowering patients improve
clinical outcome?: A case study. Patient
Education and Counseling, 61(2), 299-306.
Vahey, D. C., Aiken, L. H., Sloane, D. M.,
Clarke, S. P, & Vargas, D. (2004). Nurse
burnout and patient satisfaction. Medical
Care, 42(February), 1157-1166.
White, H. L., & Glazier, R. H. (2011). Do
hospitalist physicians improve the quality
of inpatient care delivery? A systematic
review of process, efficiency and outcome
measures. BMC Medicine, 9(58).
Windish, D. M., & Olson, D. P. (2011).
Association of patient recognition of
inpatient physicians with knowledge and
satisfaction. Journal for Healthcare Quality:
Official Publication of The National Associa-
tion for Healthcare Quality, 33(3), 44-49.
Zachariae, R„ Pedersen, C. G., Jensen, A. B.,
54. Ehrnrooth, E., Rossen, P. B., & von der
Maase, H. (2003). Association of perceived
physician communication style with
patient satisfaction, distress, cancer-related
self-efficacy, and perceived control over the
disease. British Journal of Cancer, 88(5),
658-665.
Zolnierek, K. B., & DiMatteo, M. R. (2009).
Physician communication and patient
adherence to treatment: A meta-analysis.
Medical Care, 47(8), 826-834.
41
Journal of H ealthcare M anagement 61:1 January/F ebruary
2016
P R A C T I T I O N E R A P P L I C A T I O N
Jeffrey Canose, MD, FACHE, chief operating officer, Texas
Health Resources,
Arlington, Texas
B efore the terms Hospital Consumer Assessment of Healthcare
Providers and Systems (HCAHPS) surveys and value-based
purchasing (VBP) became part of our vocabu-
lary, healthcare organizations focused on patient perception,
satisfaction, and experi-
ence. The relationship of a physician's (and other caregivers')
interpersonal skills and
quality of communication with patient outcomes and
satisfaction has long been
recognized.
55. The HCAHPS surveys, which contain questions specifically
focused on how often
communication with patients occurs, has given us information
to challenge our
assumptions about how well we communicate with patients.
Healthcare organizations
and physicians have responded to the challenge of HCAHPS
surveys by enhancing
efforts around patient-centered behaviors and processes aimed
at improving the
quality of communication and keeping patients informed about
their care. While
these practices can be effective, their success in affecting
HCAHPS scores depends on
consistent and reliable execution. HCAHPS scores are also
sensitive to perceived or
actual barriers that make it difficult for caregivers to execute
performance consis-
tently. As healthcare leaders, we must support patients and
physicians by identifying
and removing or modifying barriers to effective communication.
Improving patient ratings of physician communication on the
HCAHPS survey
can be challenging. Al-Amin and Makarem look at an area that
has not yet had a
great deal of research: organizational factors that may influence
physician communi-
cation. The study provides insights into broad categories of
organizational factors
that can affect physicians' attitudes and their ability to
communicate effectively.
As organizations move from a medical staff model, composed of
community-
56. based physicians who have ongoing relationships with patients,
to an employed
physician and hospitalist model, healthcare leaders need to
better understand
organizational factors that may predict poor patient ratings of
physician communica-
tion. Physician engagement and alignment efforts are other
areas of needed research.
The most novel aspect of this study is quantification of
physician staffing and
workload as a predictor of patient ratings. More research on
staffing levels and
physician workload will be of value to administrators,
particularly in making deci-
sions to employ hospitalists or contract with groups to provide
patient care. Addi-
tional information will allow leaders to more adeptly balance
efficiency and cost
with quality, safety, and satisfaction of patients and physicians.
Many findings in this study validate what healthcare leaders
have empirically
observed. However, because the number of negative ratings is a
relatively small per-
centage of HCAHPS responses overall, further research to
identify organizational
4 2
P atients ' Ratings of P hysician C om m unication
factors that may predirt top box ratings of physician
communication would be valu-
57. able. Of particular interest are factors that move responses from
"usually" to "always."
Al-Amin and Makarem acknowledge study limitations, such as
its focus on
negative patient ratings provided in 2008—the first year of
HCAHPS surveys—and,
therefore, it does not take into account a multitude of efforts to
improve physician
communication in subsequent years. Moreover, in this initial
look at extenuating
organizational factors, the authors examine broad variables
(large versus small
organizations, for-profit versus not-for-profit organizations).
Research on organiza-
tional factors specific to each hospital category and their impact
on physician com-
munication would increase the relevance of the findings and
facilitate performance
improvement.
With the advent of VBP and public reporting, patients' ratings
of their experience
have the potential to affect an organization's reputation, market
share, and the
bottom line in ways that were not possible even a few years ago.
As healthcare
leaders, we have a responsibility to be aware of the factors that
affect the sustainabil-
ity and success of our organizations.
However, our larger obligation and the cornerstone of what we
do every day is
caring for people—body, mind, and spirit—in this special,
sacred, humbling, and
heroic ministry to which we have dedicated our careers. Timely
58. and thorough infor-
mation, communicated by physicians, nurses, and other
caregivers in a way patients
can understand, decreases anxiety, builds trust, and ultimately
leads to better out-
comes. Knowledge gained from studies such as this makes an
important contribution
to the literature that can lead to more successful partnerships
with physicians in
achieving this shared goal.
43
Copyright of Journal of Healthcare Management is the property
of American College of
Healthcare Executives and its content may not be copied or
emailed to multiple sites or posted
to a listserv without the copyright holder's express written
permission. However, users may
print, download, or email articles for individual use.
Module Four Worksheet
Every data collection and analysis method has limitations. For
this worksheet activity you will identify an article with a study
similar to that of your final project article. Identify all elements
of the article that you have studied in previous modules. In
addition, you will identify the limitations presented by the study
and the advantages and disadvantages of the statistical analysis
used.
59. To complete this assignment, complete the following steps:
1. Review the article you selected for the final project and
identify another article with a similar study in the references
list.
2. Obtain the article referenced by your final project article and
review it.
3. Download and complete this Module Four Worksheet
document. Address the following:
· Purpose, research question, and hypothesis
· Research methods
· Results or key findings
· Limitations
4. Upload and submit your completed worksheet assignment
Part I: Identify the Articles
1. What is the number of the article you have chosen from the
Final Project Articles document?
Article Number:
#4,5
Primary Article: Al-Amin, M., Makarem, S. C., & Canose, J.
(2016). The effects of hospital-level factors on patients’ ratings
of physician communication. Journal of Healthcare
Management, 61(1), 28–43.
2. What is the full APA style citation of the article you
identified from the references list of your final project article?
Al-Amin, M., Makarem, S. C., & Canose, J. (2016). The Effects
of Hospital-Level Factors on Patients' Ratings of Physician
Communication. Journal Of Healthcare Management, 61(1), 28-
60. 43.
Part II: Purpose, Research Question, and Hypothesis
1. What is the purpose of the study?
2. What is/are the research question(s)?
3. What is/are the hypothesis(es) of the study?
4. What is/are the explanatory variable(s)?
5. What is/are the response variable(s)?
Part III: Research Methods
61. 1. What population are the researchers interested in?
2. What is the sample? How did the researchers select their
sample?
3. How did the researchers collect their data?
4. What statistical analysis did the researchers use?
Part IV: Results or Key Findings
1. What was/were the result(s) of the research question(s)?
2. What were the differences in the groups that were being
studied?
62. 3. Did the result support the researchers’ hypothesis or not?
4. List (with support) any other results that you found
interesting.
Part V: Limitations
1. What did the researchers state as the limitations of their
study?
2. Why are these limitations?
3. Please list a question you have about the study that was not
addressed in this article.
63. 1
A Statement of Work (SOW) is typically used when the task is
well-known and can be described in specific terms.
Statement of Objective (SOO) and Performance Work Statement
(PWS) emphasize performance-based concepts
such as desired service outcomes and performance standards.
Whereas PWS/SOO's establish high-level outcomes
and objectives for performance and PWS's emphasize outcomes,
desired results and objectives at a more detailed
and measurable level, SOW's provide explicit statements of
work direction for the contractor to follow. However,
SOW's can also be found to contain references to desired
performance outcomes, performance standards, and
64. metrics, which is a preferred approach.
The Table of Content below is informational only and is
provided to you for purposes of outlining the
PWS/SOO/SOW. This sample is not all inclusive, therefore
the reader is cautioned to use professional judgment
and include agency specific references to their own
PWS/SOO/SOW.
Software Application and Web-based Service Interface Page 1
of 36
B.1 GENERAL DESCRIPTION
...............................................................................................
................................ 3
B.2 SERVICES AND PRICES/COSTS
...............................................................................................
..................... 3
B.3 INDIRECT / MATERIAL HANDLING RATE
69. H.5.2 SECURITY AND OTHER COMPLIANCE CONCERNS
.............................................................................. 30
H.6 KEY
PERSONNEL..........................................................................
................................................................. 31
H.7 ORGANIZATIONAL CONFLICT OF INTEREST AND
NON-DISCLOSURE REQUIREMENTS ............ 31
H.7.1 ORGANIZATIONAL CONFLICT OF INTEREST
......................................................................................... 31
H.8 TRANSFER OF HARDWARE/SOFTWARE
MAINTENANCE AGREEMENTS TO FOLLOW-ON
CONTRACTORS.....................................................................
......................................................................... 32
H.9 EARNED VALUE MANAGEMENT CRITERIA
...........................................................................................
32
I.1 FEDERAL ACQUISITION REGULATION (48 CFR
70. CHAPTER 1).............................................................. 33
I.2 FAR 52.217-8 OPTION TO EXTEND SERVICES (NOV
1999) .................................................................... 33
I.3 FAR 52.217-9 OPTION TO EXTEND THE TERM OF THE
CONTRACT (MAR 2000).............................. 33
J.1 LIST OF
ATTACHMENTS.....................................................................
......................................................... 33
73. Project Name & ID: ______________
May 1, 2011
NOTE: Paragraphs B.1 through B.3 of the offeror’s awarded
Alliant GWAC are applicable to this Task Order
Request (TOR) and are hereby incorporated by reference. In
addition, the following applies:
B.1 GENERAL DESCRIPTION
Consistent with Agency and Federal goals of enterprise, shared-
solution, and service-based approaches to
information technology: services may include a new systems,
consolidate and/or integrate systems, develop
interfaces with other systems/services, and expand the existing
systems to also support other program areas, and,
potentially, support data and requirements from other Federal
Government agencies.
The Contractor shall perform the effort required by this task
order on a Labor Hour and Firm Fixed Price (hybrid)
basis. The work shall be performed in accordance with all
sections of this task order and the offeror’s Alliant
GWAC, under which the resulting task order will be placed. The
Contractor must propose labor categories and
hourly rates that are contained within its Alliant contract, at
fully burdened rates that do not exceed the benchmark
74. rates established for each particular labor category in its Alliant
contract. Therefore, for the purposes of this task
order, the labor rates shall not exceed the benchmark rates
unless the Contractor proposes a specialized or rare labor
category not explicitly defined by any established labor
category description in the Alliant GWAC. If a highly
specialized or rare labor category is proposed, the Contractor
must provide the appropriate support rationale. Please
reference Section L.7(c) Price Supporting Documentation (Tab
C).
B.2 SERVICES AND PRICES/COSTS
The following abbreviations are used in this Task Order
Request:
(CLIN) Contract Line Item Number
(FFP) Firm Fixed Price
(LH) Labor Hour
(NSP) Not Separately Priced
(NTE) Not to Exceed
Note: An Indirect Handling Rate Or Other Overhead Charges
(Such As G&A) Shall Only Be Included If The
Underlying Contract Allows The Application Of Such A Charge
75. And Includes The Negotiated Rate/Charge.
The Nte Ceiling Amount Represents The Maximum Amount Of
The Government’s Liability. The Contractor
Exceeds The Ceiling At Its Own Risk.
*Transition-In Services (Clin 0004) Applicable To Base Year
Only
Transition-In Services Are Not Anticipated For The Incumbent.
Therefore, These Services Should Not Be Proposed
By The Incumbent.
All Other Offerors Shall Price Transition-In Services Separately
From The Total Price Of The Base Year.
B.3 INDIRECT / MATERIAL HANDLING RATE
Travel will be reimbursed at actual cost in accordance with the
limitations set forth in FAR 31.205-46.
Software Application and Web-based Service Interface Page 3
of 36
76.
77. Profit shall not be applied to travel costs. Contractors may
apply indirect costs to travel in accordance with the
Contractor’s usual accounting practices consistent with FAR
31.2.
B.4 INCREMENTAL FUNDING LIMITATION OF
GOVERNMENT’S OBLIGATION
(a) Contract line item(s) (CLINs) * through * are incrementally
funded. For these item(s), the sum
of $ * of the total ceiling is presently available for payment and
allotted to this task order. An allotment
schedule is set forth in paragraph (j) of this clause.
* To be inserted at time of award - after negotiation.
(b) For item(s) identified in paragraph (a), the Contractor agrees
to perform up to the point at which the
total amount payable by the Government, including
reimbursement in the event of termination of those
item(s) for the Government’s convenience, approximates the
total amount currently allotted to the contract.
78. The Contractor is not authorized to continue work on those
item(s) beyond that point. The Government
will not be obligated in any event to reimburse the Contractor in
excess of the amount allotted to the task
order for those item(s) regardless of anything to the contrary in
the clause entitled “Termination for
Convenience of the Government.” As used in this clause, the
total amount payable by the Government in
the event of termination of applicable contract line item(s) for
convenience includes costs, profit, and
estimated termination settlement costs for those item(s).
(c) The Contractor will notify the Contracting Officer in writing
at least ninety days prior to the date when,
in the Contractor’s best judgment, the work will reach the point
at which the total amount payable by the
Government, including any cost for termination for
convenience, will approximate 85 percent of the total
amount then allotted to the task order for performance of the
applicable item(s). The notification will state
(1) the estimated date when that point will be reached and (2)
an estimate of additional funding, if any,
needed to continue performance of applicable line items up to
the next allotment of funds. The notification
79. will also advise the Contracting Officer of the estimated amount
of additional funds that will be required
for the timely performance of the item(s) funded pursuant to
this clause, for a subsequent period as may be
specified in the allotment schedule in paragraph (i) of this
clause or otherwise agreed to by the parties. If
after such notification additional funds are not allotted by the
date identified in the Contractor’s
notification, or by an agreed substitute date, the Contracting
Officer will terminate any item(s) for which
additional funds have not been allotted, pursuant to the clause
of this contract entitled “Termination for
Convenience of the Government.”
(d) When additional funds are allotted for continued
performance of the contract line item(s) identified in
paragraph (a) of this clause, the parties will agree as to the
period of task order performance which will be
covered by the funds. The provisions of paragraphs (b) through
(d) of this clause will apply in like manner
to the additional allotted funds and any agreed to substitute
date, and the task order will be modified
accordingly.
(e) If, solely by reason of failure of the Government to allot
additional funds, by the dates indicated below,
80. in amounts sufficient for timely performance of the contract line
item(s) identified in paragraph (a) of this
clause, the Contractor incurs additional costs or is delayed in
the performance of the work under this task
order and if additional funds are allotted, an equitable
adjustment will be made in the price or prices
(including appropriate target, billing, firm fixed price, and
ceiling prices where applicable) of the item(s),
or in the time of delivery, or both. Failure to agree to any such
equitable adjustment hereunder will be a
dispute concerning a question of fact within the meaning of the
clause entitled “Disputes.”
(f) The Government may at any time prior to termination allot
additional funds for the performance of the
contract line item(s) identified in paragraph (a) of this clause.
(g) The termination provisions of this clause do not limit the
rights of the Government under the clause
entitled “Default.” The provisions of this clause are limited to
the work and allotment of the contract line
item(s) identified in paragraph (a) of this clause. This clause no
longer applies once the contract line
item(s) identified in paragraph (a) of this clause are fully
funded except with regard to the rights or
82. obligations of the parties concerning equitable adjustments
negotiated under paragraphs (d) and (e) of this
clause.
(h) Nothing in this clause affects the right of the Government to
terminate this task order pursuant to the
83. clause of the underlying contract entitled “Termination for
Convenience of the Government.”
Nothing in this clause shall be construed as authorization of
voluntary services whose acceptance is
otherwise prohibited under 31 U.S.C. 1342.
(j) The Government has allotted funds to this task order in
accordance with the following table:
CLIN DATE FUNDING
OBLIGATED
TOTAL TASK
ORDER
ESTIMATED
CEILING PRICE
AMOUNT OF
FUNDING
OBLIGATED
TOTAL FUNDED
ESTIMATED
CEILING PRICE
0001, 0002, 1001,
84. 1002, 2001, 2002,
3001, 3002, 4001,
4002
month/day/year $ $ $
Total $ $ $
B.5 CONTRACT ACCESS FEE
The Contract Access Fee (CAF) is ¾ of a percent (i.e., 0.0075)
to be applied to the total price/cost for contractor
performance as billed to the Government.
The formula is: Total CAF = Total Price or Costs * CAF
Percentage.
On all Orders, regardless of Order type, Contractors must
estimate CAF in their proposals and OCOs may fund CAF
as a separate Contract Line Item Number (CLIN).
The Contractor remits the CAF to GSA in accordance with
Alliant GWAC Section G.9.5.
C.1 PURPOSE
The purpose of this task order is to obtain services related to the
Operations, Corrective Maintenance, and
Development/Modernization/Enhancement (DME), of the
Agency’s electronic grants management (eGrants) and
85. other related Information Technology (IT) systems. These
systems primarily support program offices.
The current IT systems within scope of this task order include
Integrated Disbursement and Information System
Online (IDIS OnLine), Performance Measurement System
(PERMS), and the Title V system. Consistent with
Agency and Federal goals of enterprise, shared-solution, and
service-based approaches to information technology:
services may also be required to develop new systems,
consolidate and/or integrate systems, develop interfaces with
other systems/services, and expand the existing systems to also
support other program areas, and, potentially,
support data and requirements from other Federal Government
agencies.
C.2 BACKGROUND
Offices under the Office of the Chief Information Officer
(OCIO) monitor most IT functions in the Agency.
Systems (applications) work is currently performed under the
OCIO Office of Systems Integration and Efficiency
(OSIE). Additionally, staff in the division serves as the focal
point in coordinating the technical activities involved
with other OCIO organizations including the Chief Information
Officer and Deputies, Investment Management,
86. Enterprise Architecture (EA), Policy and e-Gov, IT Operations,
and IT Security offices.
The Agency serves as the focal point for coordinating efforts
with external stakeholders including grantees, public
interest groups, citizens, White House Office of Management
and Budget (OMB), and Congress.
Software Application and Web-based Service Interface Page 5
of 36
87. For purposes of this task order there is one clear distinction that
is validated by the Department’s organizational
structure. The people who work in OCIO respond to and
88. effectively manage all technical aspects of this task order.
The people who work in CPD respond to and effectively manage
all business aspects of this task order.
The business processes covered under this procurement include,
but are not necessarily limited to, the general
aspects of the Grants Management Lifecycle.
This Grants Management Lifecycle is consistent and compatible
with the benchmarks identified in the Federal e-
Grants initiative and the Grants Management Line of Business.
The IT systems within scope of this task order each
support one or multiple functions of the Grants Management
Lifecycle.
CPD’s vision for Electronic Grants Management is to:
Automate or increase efficiency of grant management and
administrative processes
Retire manual and/or paper-based processes
Increase use of single-sign-on so grantees have fewer points-of-
entry to grants systems
Increase integration among grants systems
Reduce reliance on stove-piped, single-purpose solutions
Streamline database design to increase performance and
reliability
89. Centralize data where feasible (single-source) and share via
services
Reduce overall data footprint
Increase accuracy and standardization of data
Reduce data entry burden for grantees and staff
Better utilize existing data for improved analysis, reporting, and
decision-making
Improve system design, interface, usability, and user-
friendliness
Reduce reliance on manual data corrections to reduce overall
operational costs
Improve quality of system releases to minimize need for
corrective maintenance
Enable additional grant programs to leverage the eGrants
systems for cost savings
Further enhance systems with stronger financial controls for
improved accountability
Develop public-facing interfaces for improved transparency
Utilize innovative web technologies for integrated and cost-
effective solutions
Rapidly and efficiently respond to legislative mandates
requiring system changes
Reduce overall costs to operate/maintain eGrants systems
90. CPD believes this vision will lead to more rapid award and
disbursement of funds to grantees, better execution of
grants, greater capacity of grantees, and better on-the-ground
performance of grants. Most importantly, the Agency
believes an improved and integrated spectrum of IT systems
will directly lead to improved access to affordable
housing, better neighborhood conditions, job creation, and more
targeted services to better meet the needs of low-
income families, the homeless, HIV/AIDS patients, and other
key beneficiaries of Agency’s grant programs. In
times of limited Federal dollars for grant programs, optimizing
use of IT systems can directly lead to improved
outcomes, i.e., reduced grantee time spent on administrative
paperwork frees up staff time to directly execute and
oversee grant activities.
Additionally, CPD believes that grant programs in other
program offices could benefit in terms of significant
efficiency gains and administrative cost savings if they
leveraged CPD’s grants management systems to administer
their grants, and abandoned existing stove-piped, legacy, and/or
paper-based solutions. CPD’s grants management
systems are poised to begin servicing other grant programs
around the Department.
91. C.2.1 AGENCY MISSION
The Agency seeks to develop viable communities by promoting
integrated approaches that provide decent housing,
a suitable living environment, and expand economic
opportunities for low and moderate income persons. The
primary means towards this end is the development of
partnerships among all levels of government and the private
sector, including for-profit and non-profit organizations.
Software Application and Web-based Service Interface Page 6
of 36
The Agency seeks to empower local residents by helping to
give them a voice in the future of their neighborhoods;
stimulate the creation of community based organizations; and
enhance the management skills of existing
organizations so they can achieve greater production
capacity. Housing and community development are not
viewed
as separate programs, but rather as among the myriad
elements that make up a comprehensive vision of community
development. These groups are at the heart of a bottom-up
housing and community development strategy. The IT
92. systems identified in this task order request are dedicated
to supporting this mission.
Work outlined in this task order request is directly related
to the following Strategic Goals:
The Contractor shall provide innovative, integrated, EA-
compliant, and cost-effective IT solutions that increase
efficiency, reduce data entry, reduce IT system operations
costs, and reduce manual/paper-based administrative
burdens for staff and grantees in order to meet this
mission.
C.2.2 CURRENT ENVIRONMENT
The Technical Environment for each of the existing IT
systems is defined in Attachment 1 to this solicitation.
The Agency currently uses the following desktop business
applications: Microsoft Windows XP, Microsoft Access
version 2007, Microsoft Excel version 2007, Microsoft
PowerPoint version 2007, Microsoft Word version 2007,
Microsoft Project version 2007 and Microsoft Visio version
2007, but regularly upgrades the environment. The
current Technical Reference Model (TRM) can be found on
93. the website. All deliverables will be in a format
compatible with standards listed.
C.3 SCOPE
The milestones and deliverables in the following
requirements will be implemented and thoroughly discussed
with
the GSA Contracting Officer’s Representative (COR) and the
Agency Technical Points of Contact (TPOCs)
(Government Technical Representative [GTR]/Government
Technical Monitor [GTM]). This task order will be
performed for a five-year period with one base period, and
four option years.
The Contractor shall support the following functions:
IT System Steady-State Operational Support services
necessary to continue on-going operations of existing
IT systems.
IT System Steady-State Corrective Maintenance services,
including application bug fixes, fixes to reports
that are inaccurate, correcting business rules that contain bad
logic, and/or assistance in completion of
scheduled Enterprise Architecture (EA) and infrastructure or
94. software upgrades as identified by OCIO.
Systems Development, Modernization and Enhancement
(DME) services for each of the eGrants systems
and subsystems as budgets permit. DME typically includes
requirements analysis, design, development,
testing, and deployment of changes and enhancements to
existing systems to engender new or modified
functionality in response to regulatory and statutory
changes. DME may also include development of future
systems, consolidation of systems, integration of systems
for improved data sharing, and/or the expansion
of the existing systems to support other grant-making
program areas in the Agency or potentially from
other Federal Government agencies. All of these services will
include coordination with the infrastructure
support vendor(s) and, from the Contractor’s side, effective
project management in alignment with Project
Planning and Management (PPM) process.
C.4 OBJECTIVE
The Contractor shall be responsible for providing substantial
value to the Agency in the form of technical services to
ensure successful business operations, maintenance, and