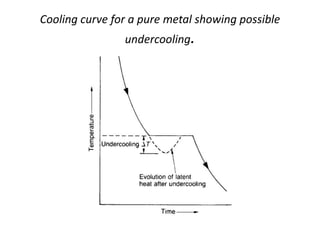
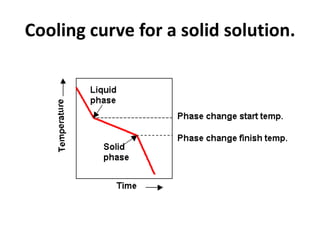
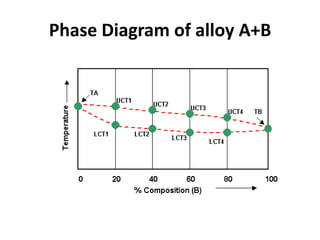
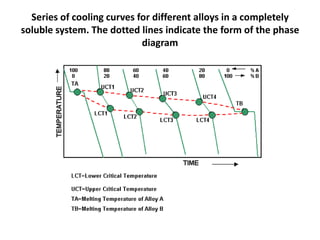
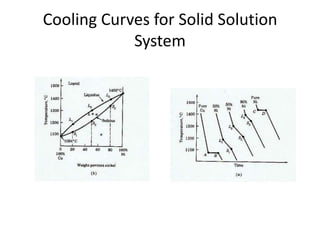
Cooling curves provide information about phase changes that occur as materials cool over time.
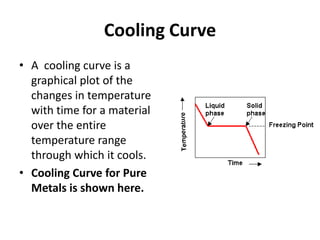
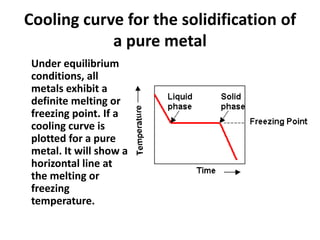
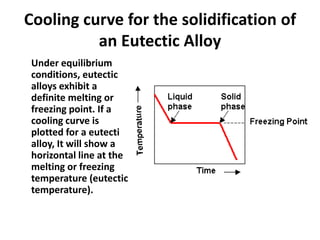
A cooling curve graphs the temperature of a material as it cools from the liquid state back to room temperature. For pure metals, the cooling curve shows a horizontal line at the freezing/melting point. For alloys, the initial and final phase change temperatures on the cooling curve are used to construct phase diagrams that map out the phases present at different compositions and temperatures. Cooling curves for different alloy compositions reveal information about solid solutions and eutectic systems.