More Related Content
Similar to Converg ex bac bnyjw-1
Similar to Converg ex bac bnyjw-1 (20)
Converg ex bac bnyjw-1
- 1. 2.59
1/10/13
JAYWALK CONSENSUS (SM)
17
Independent Research Providers Covering
BAC
Bank of America Corp
Important Information The information contained herein is for informational purposes only and is not intended to provide tax, legal or investment advice. This information is compiled
directly from (1) the research providers’ recommendations on the equity securities displayed and (2) Morningstar, Inc., a third-party financial data vendor and is based on information sources
believed to be accurate and reliable. Such information, however, is presented without warranty of any kind. Past performance should not be taken as an indication of future performance, and
no representation of any kind is made as to future performance. Jaywalk and Morningstar, Inc. are not soliciting any action based upon such information, or endorsing any recommendation or
opinion expressed by the Jaywalk Consensus (SM)
and the research providers. Accordingly, neither Jaywalk and any of its affiliates, nor Morningstar, Inc., guarantee the timeliness, accuracy,
completeness, sequence, or adequacy of the information. You agree that any and all use you make of the information is solely at your own risk and without recourse to Jaywalk, any of its
affiliates, Morningstar, Inc., or any independent research provider.
Copyright ©2013 Jaywalk. All Rights Reserved.
ABOUT THE JAYWALK CONSENSUS
(SM)
The Jaywalk Consensus
(SM)
metrics service provides an average of all of the independent
research providers’ ratings on the given security. By averaging these ratings, investors are
given insight into the independent research community’s perspective on individual securities.
The research providers who participate in the Jaywalk Consensus
(SM)
are professional firms
that attest to having no investment banking or other potential conflicts that might impact the
integrity of their research.
CURRENT JAYWALK CONSENSUS (SM)
on 1/10/13
▼
▼
▼
▼
2.59
5 1
2
3
4
STRONG STRONG
BUY
HOLD
SELL
SELL BUY
(1=Buy, 2=Hold, 3=Sell)
Jaywalk Consensus (SM)
3 point scale score: 1.71
BAC STOCK PRICE HISTORY 60 Day Moving Average
$0
$10
$20
2012
Average Daily Volume in millions
0
1,000
2,000
3,000
2012
KEY STATISTICS as of 01/09/2013
Industry Banks - Regional - US
Sector Financial Services
Close Price $11.43
52-Week Price Range $6.41 - $12.20
Volume 336,167,554
Average Daily Volume 164,369,571
Market Capitalization $123.19 Billion
Enterprise Value $463.79 Billion
P/E (Trailing) 31.06
Dividend as of 12/05/2012 $0.04
Dividend Yield 0.3%
5-year Historical EPS Growth Rate -1.0%
Liquidity Ratio - -
Shares Outstanding 10.8 Billion
Employees 288,000
BREAKDOWN OF INDEPENDENT RATINGS
Below is the breakdown of analyst ratings in the Jaywalk Consensus (SM)
. For example, if there is a Jaywalk
Consensus (SM)
of 2.5 with 10 IRPs covering the stock, and there are 5 buys and 5 holds, this shows a solid
overall consensus with no negative ratings. Additionally, if this stock had a consensus of 3.0 last month and a
consensus of 4.0 two months ago, then the consensus on that stock shows a trend of consistent
improvement.
9/30/12
10/31/12
11/30/12
12/31/12
1/10/13
Very Positive or Strong Buy (Rating=1) 3
3
3
4
3
Positive or Buy (Rating=2) 4
4
5
4
5
Neutral or Hold (Rating=3) 8
7
6
6
6
Negative or Sell (Rating=4) 1
2
2
2
2
Very Negative or Strong Sell (Rating=5) 1
1
1
1
1
Total Independent Research Providers 17
17
17
17
17
Jaywalk Consensus (SM)
2.59
2.65
2.59
2.53
2.59
INDEPENDENT RESEARCH
PROVIDER RATING DISTRIBUTION
17 Independent Research Providers
VERY
NEGATIVE
STRONG
SELL
1
NEGATIVE
SELL
2
NEUTRAL
HOLD
6
POSITIVE
BUY
5
VERY
POSITIVE
STRONG
BUY
3
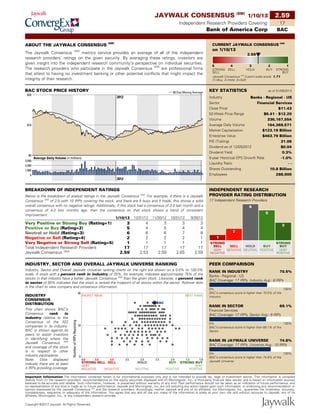
INDUSTRY, SECTOR AND OVERALL JAYWALK UNIVERSE RANKING
Industry, Sector and Overall Jaywalk Universe ranking charts on the right are shown on a 0.0% to 100.0%
scale. A stock with a percent rank in industry of 25%, for example, indicates approximately 75% of the
stocks in that industry have a better Jaywalk Consensus (SM)
than the given stock. Likewise, a percent rank
in sector of 50% indicates that the stock is ranked the midpoint of all stocks within the sector. Rollover dots
in the chart to view company and consensus information.
INDUSTRY
CONSENSUS
DISTRIBUTION
This chart shows BAC’s
Consensus rank in
industry relative to the
Consensus of the 322
companies in its industry.
BAC is shown against its
peers to assist investors
in identifying where the
Jaywalk Consensus (SM)
and coverage of the stock
is in respect to other
industry participants.
Note: Dots displayed
indicate there are at least
4 IRPs providing coverage.
VERY
NEGATIVE
STRONG SELL
NEGATIVE
SELL
NEUTRAL
HOLD
POSITIVE
BUY
VERY
POSITIVE
STRONG BUY
5.0 4.5 4.0 3.5 3.0 2.5 2.0 1.5 1.0
0
10
20
Number
of
IRPs
Reporting
WORST RANK BEST RANK
BAC
PEER COMPARISON
RANK IN INDUSTRY 70.5%
Banks - Regional - US
BAC Coverage: 17 IRPs, Industry Avg.: 8 IRPs
0% 100%
BAC's consensus score is higher than 70.5% of the
Industry.
RANK IN SECTOR 69.1%
Financial Services
BAC Coverage: 17 IRPs, Sector Avg.: 9 IRPs
0% 100%
BAC's consensus score is higher than 69.1% of the
Sector.
RANK IN JAYWALK UNIVERSE 74.8%
BAC Coverage: 17 IRPs, Universe Avg.: 10 IRPs
0% 100%
BAC's consensus score is higher than 74.8% of the
Jaywalk Universe.