Download to read offline


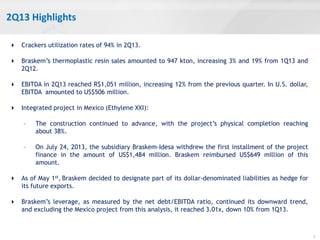
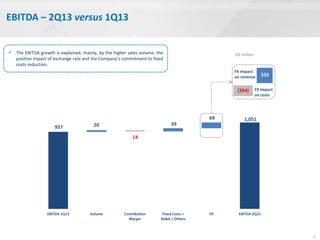
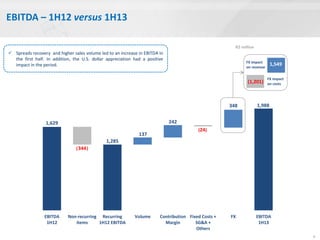
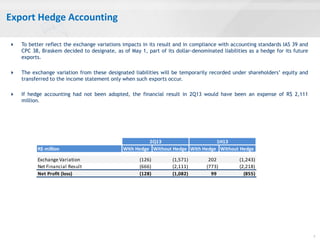
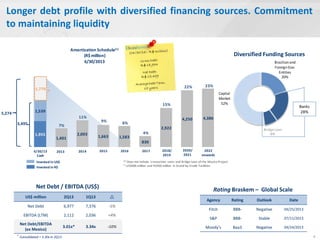
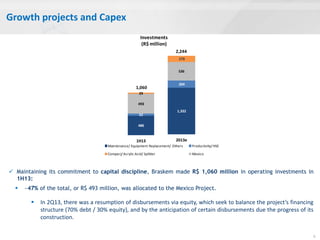


Braskem reported its 2Q13 earnings. EBITDA increased 12% from the previous quarter to R$1,051 million due to higher sales volumes, a positive foreign exchange impact, and cost reductions. The Mexico project construction advanced to 38% completion. Braskem adopted hedge accounting to better reflect exchange rate impacts. Leverage excluding Mexico declined to 3.01x due to debt reduction. Braskem will focus on strengthening client relationships, advancing industrial policies, boosting competitiveness through costs and capacity, progressing key projects, and maintaining financial strength.