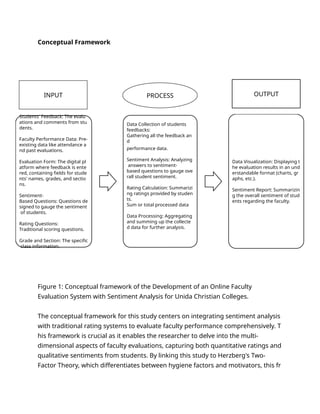
Students' Feedback: The evalu
ations and comments from stu
dents.
Faculty Performance Data: Pre-
existing data like attendance a
nd past evaluations.
Evaluation Form: The digital pl
atform where feedback is ente
red, containing fields for stude
nts' names, grades, and sectio
ns.
Sentiment-
Based Questions: Questions de
signed to gauge the sentiment
of students.
Rating Questions:
Traditional scoring questions.
Grade and Section: The specific
class information.
Data Collection of students
feedbacks:
Gathering all the feedback an
d
performance data.
Sentiment Analysis: Analyzing
answers to sentiment-
based questions to gauge ove
rall student sentiment.
Rating Calculation: Summarizi
ng ratings provided by studen
ts.
Sum or total processed data
Data Processing: Aggregating
and summing up the collecte
d data for further analysis.
Data Visualization: Displaying t
he evaluation results in an und
erstandable format (charts, gr
aphs, etc.).
Sentiment Report: Summarizin
g the overall sentiment of stud
ents regarding the faculty.
INPUT OUTPUT
Conceptual Framework
Figure 1: Conceptual framework of the Development of an Online Faculty
Evaluation System with Sentiment Analysis for Unida Christian Colleges.
The conceptual framework for this study centers on integrating sentiment analysis
with traditional rating systems to evaluate faculty performance comprehensively. T
his framework is crucial as it enables the researcher to delve into the multi-
dimensional aspects of faculty evaluations, capturing both quantitative ratings and
qualitative sentiments from students. By linking this study to Herzberg's Two-
Factor Theory, which differentiates between hygiene factors and motivators, this fr
PROCESS
amework illustrates how students' feedback can encompass both satisfaction elem
ents (motivators) and dissatisfaction elements (hygiene factors). This approach pro
vides a nuanced understanding of faculty performance, highlighting areas of stren
gth and opportunities for improvement. The visual representation of the relationsh
ip between the construct
students' feedback, faculty performance data, and the resulting evaluation reports
offers a clear roadmap for exploring the research problem based on established th
eories.
Start
Students input their Name, Grade and
Section then their feedback.
This includes both the ratings (score-
based evaluations) and quality
feedback (comments) provided by
students during faculty evaluations
Evaluation Reports:
The system generates reports that
include both the quantitative
results and qualitative insights
(overall sentiment score, common
themes from feedback).
End
Sentiment Analysis:
Applying natural language processing
(NLP) techniques to analyze the
qualitative feedback and extract
sentiments (positive, negative, neutral).
Data Validation and Categorization:
Ensuring the feedback is accurate,
removing inappropriate or unrelated
comments, and categorizing the
responses into different sentiment
classes.
Quantitative Analysis:
Simultaneously processing the
numerical data from quantitative
ratings.
Integration:
Combining sentiment data with the
quantitative results to provide a
holistic view of faculty performance.
Conceptual-Framework input process outpu

Conceptual-Framework input process outpu

  • 1.
    Students' Feedback: Theevalu ations and comments from stu dents. Faculty Performance Data: Pre- existing data like attendance a nd past evaluations. Evaluation Form: The digital pl atform where feedback is ente red, containing fields for stude nts' names, grades, and sectio ns. Sentiment- Based Questions: Questions de signed to gauge the sentiment of students. Rating Questions: Traditional scoring questions. Grade and Section: The specific class information. Data Collection of students feedbacks: Gathering all the feedback an d performance data. Sentiment Analysis: Analyzing answers to sentiment- based questions to gauge ove rall student sentiment. Rating Calculation: Summarizi ng ratings provided by studen ts. Sum or total processed data Data Processing: Aggregating and summing up the collecte d data for further analysis. Data Visualization: Displaying t he evaluation results in an und erstandable format (charts, gr aphs, etc.). Sentiment Report: Summarizin g the overall sentiment of stud ents regarding the faculty. INPUT OUTPUT Conceptual Framework Figure 1: Conceptual framework of the Development of an Online Faculty Evaluation System with Sentiment Analysis for Unida Christian Colleges. The conceptual framework for this study centers on integrating sentiment analysis with traditional rating systems to evaluate faculty performance comprehensively. T his framework is crucial as it enables the researcher to delve into the multi- dimensional aspects of faculty evaluations, capturing both quantitative ratings and qualitative sentiments from students. By linking this study to Herzberg's Two- Factor Theory, which differentiates between hygiene factors and motivators, this fr PROCESS
  • 2.
    amework illustrates howstudents' feedback can encompass both satisfaction elem ents (motivators) and dissatisfaction elements (hygiene factors). This approach pro vides a nuanced understanding of faculty performance, highlighting areas of stren gth and opportunities for improvement. The visual representation of the relationsh ip between the construct students' feedback, faculty performance data, and the resulting evaluation reports offers a clear roadmap for exploring the research problem based on established th eories.
  • 4.
    Start Students input theirName, Grade and Section then their feedback. This includes both the ratings (score- based evaluations) and quality feedback (comments) provided by students during faculty evaluations Evaluation Reports: The system generates reports that include both the quantitative results and qualitative insights (overall sentiment score, common themes from feedback). End Sentiment Analysis: Applying natural language processing (NLP) techniques to analyze the qualitative feedback and extract sentiments (positive, negative, neutral). Data Validation and Categorization: Ensuring the feedback is accurate, removing inappropriate or unrelated comments, and categorizing the responses into different sentiment classes. Quantitative Analysis: Simultaneously processing the numerical data from quantitative ratings. Integration: Combining sentiment data with the quantitative results to provide a holistic view of faculty performance.