Module-1: Introduction
•Introduction toComputer Vision: Image
representation and Image analysis task, Image
representations, Image Digitization,
•Digital Image Properties: Metric and topological
properties of digital images, Histograms,
Entropy, Visual perception of the image, Image
quality and Noise in images.
3.
Image representation
• Mathematicalmodels are often used to describe images and
other signals.
• A signal is a function depending on some variable with
physical meaning; it can be one-dimensional (e.g.,
dependent on time), two-dimensional (e.g., an image
dependent on two co-ordinates in a plane), three-
dimensional (e.g., describing a volumetric object in space), or
higher dimensional.
• A scalar function might be sufficient to describe a
monochromatic image, while vector functions may be used
to represent, for example, color images consisting of three
component colors.
4.
Image representation
Functions weshall work with may be categorized as
Continuous
Discrete
Digital.
• We shall take the usual intuitive definition of image—an
example might be the image on the human retina, or
captured by a video camera.
• This can be modeled by a continuous (image) function of two
variables f(x, y) where (x, y) are co-ordinates in a plane, or
perhaps three variables f(x, y, t), where t is time.
5.
The continuous imagefunction
• The (gray-scale) image function values correspond to brightness
at image points. The function value can express other physical
quantities as well (temperature, pressure distribution, distance
from the observer, etc.). Brightness integrates different optical
quantities
• The image on the retina or on a camera sensor is intrinsically
two-dimensional (2D). We shall call such an image bearing
information about brightness points an intensity image. The 2D
image on the imaging sensor is commonly the result of
projection of a three-dimensional (3D) scene.
6.
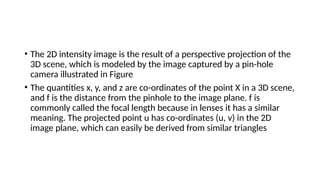
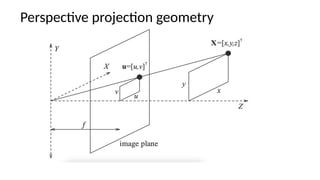
• The 2Dintensity image is the result of a perspective projection of the
3D scene, which is modeled by the image captured by a pin-hole
camera illustrated in Figure
• The quantities x, y, and z are co-ordinates of the point X in a 3D scene,
and f is the distance from the pinhole to the image plane. f is
commonly called the focal length because in lenses it has a similar
meaning. The projected point u has co-ordinates (u, v) in the 2D
image plane, which can easily be derived from similar triangles
• A non-linearperspective projection is often approximated by a linear
parallel (or orthographic) projection, where f → ∞. Implicitly, z → ∞
says that the orthographic projection is a limiting case of the
perspective projection for faraway objects.
• Image processing often deals with static images, in which time is
constant. A monochromatic static image is represented by a
continuous image function f(x, y) whose arguments are co-ordinates
in the plane.
9.
• Computerized imageprocessing uses digital image functions which
are usually represented by matrices, so co-ordinates are natural
numbers. The domain of the image function is a region R in the plane
• R={(x, y), 1 ≤ x ≤ x m , 1 ≤ y ≤ y n},
• The range of image function values is also limited; by convention, in
monochromatic images the lowest value corresponds to black and the
highest to white. Brightness values bounded by these limits are gray-
levels.
10.
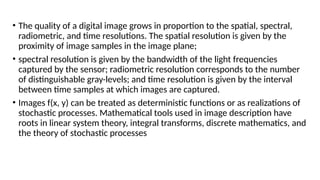
• The qualityof a digital image grows in proportion to the spatial, spectral,
radiometric, and time resolutions. The spatial resolution is given by the
proximity of image samples in the image plane;
• spectral resolution is given by the bandwidth of the light frequencies
captured by the sensor; radiometric resolution corresponds to the number
of distinguishable gray-levels; and time resolution is given by the interval
between time samples at which images are captured.
• Images f(x, y) can be treated as deterministic functions or as realizations of
stochastic processes. Mathematical tools used in image description have
roots in linear system theory, integral transforms, discrete mathematics, and
the theory of stochastic processes
11.
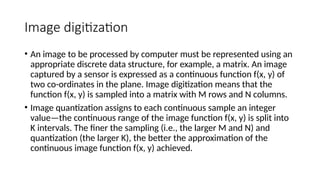
Image digitization
• Animage to be processed by computer must be represented using an
appropriate discrete data structure, for example, a matrix. An image
captured by a sensor is expressed as a continuous function f(x, y) of
two co-ordinates in the plane. Image digitization means that the
function f(x, y) is sampled into a matrix with M rows and N columns.
• Image quantization assigns to each continuous sample an integer
value—the continuous range of the image function f(x, y) is split into
K intervals. The finer the sampling (i.e., the larger M and N) and
quantization (the larger K), the better the approximation of the
continuous image function f(x, y) achieved.
12.
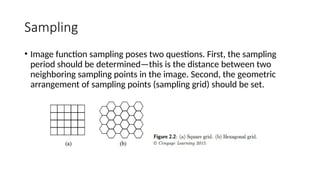
Sampling
• Image functionsampling poses two questions. First, the sampling
period should be determined—this is the distance between two
neighboring sampling points in the image. Second, the geometric
arrangement of sampling points (sampling grid) should be set.
13.
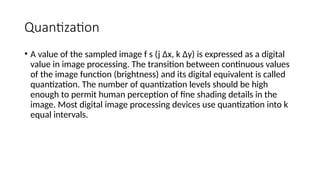
Quantization
• A valueof the sampled image f s (j ∆x, k ∆y) is expressed as a digital
value in image processing. The transition between continuous values
of the image function (brightness) and its digital equivalent is called
quantization. The number of quantization levels should be high
enough to permit human perception of fine shading details in the
image. Most digital image processing devices use quantization into k
equal intervals.
14.
Digital image properties
Metricand topological properties of digital images
A digital image consists of picture elements with finite size—these
pixels carry information about the brightness of a particular location in
the image.
Some intuitively clear properties of continuous images have no
straightforward analogy in the domain of digital images. Distance is an
important example.
Any function D holding the following three condition is a ‘distance’ (or a
metric)D(p, q) ≥ 0 ; D(p, q) = 0 if and only if p = q , D(p, q) = D(q, p) , D(p,
r) ≤ D(p, q) + D(q, r) ,identity, symmetry, triangular inequality.
15.
• The Euclideandistance D E known from classical geometry and
everyday experience is defined by


![[Deck] What's New in Spark-Iceberg Integration via DSV2.pptx](https://cdn.slidesharecdn.com/ss_thumbnails/deckwhatsnewinspark-icebergintegrationviadsv2-260210005337-25955b12-thumbnail.jpg?width=640&height=640&fit=bounds)


