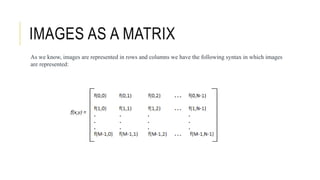
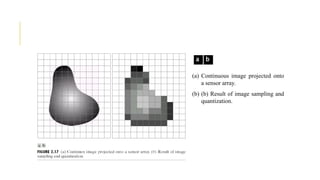
DIGITAL IMAGE
PROCESSING
Introduction (Unit-1)
SKM
WHAT IS AN IMAGE?
An image may be defined as a two-dimensional function, f(x, y), where x and y are spatial (plane)
coordinates, and the amplitude of f at any pair of coordinates (x, y) is called the intensity or gray level of
the image at that point. When x, y, and the amplitude values of f are all finite, discrete quantities, we call
the image a digital image.
WHAT IS DIGITAL IMAGE
PROCESSING (DIP)?
Digital image processing refers to the manipulation, enhancement, and analysis of digital images using
computer algorithms and techniques. It involves the application of various mathematical operations and
algorithms to alter or extract information from digital images. In this process, images are treated as two-
dimensional arrays of pixels, where each pixel represents a point of color and brightness.
Pixel is the smallest element of an image. A pixel is also known as PEL. Each pixel correspond to any one
value. In an 8-bit gray scale image, the value of the pixel between 0 and 255. The value of a pixel at any
point correspond to the intensity of the light photons striking at that point. Each pixel store a value
proportional to the light intensity at that particular location.
PIXEL
REPRESENTING DIGITAL IMAGES
Assume that an image f(x, y) is sampled so that the
resulting digital image has M rows and N columns.
The values of the coordinates (x, y) now become
discrete quantities. For notational clarity and
convenience, we shall use integer values for these
discrete coordinates. Thus, the values of the
coordinates at the origin are (x, y) = (0, 0). The next
coordinate values along the first row of the image
are represented as (x, y) = (0, 1). It is important to
keep in mind that the notation (0, 1) is used to
signify the second sample along the first row.
The basic steps involved in digital image processing are:
a. Image acquisition: This involves capturing an image using a digital camera or scanner, or importing an
existing image into a computer.
b. Image enhancement: This involves improving the visual quality of an image, such as increasing
contrast, reducing noise, and removing artifacts.
c. Image restoration: This involves removing degradation from an image, such as blurring, noise, and
distortion.
d. Image segmentation: This involves dividing an image into regions or segments, each of which
corresponds to a specific object or feature in the image.
STEPS INVOLVED IN DIGITAL IMAGE
PROCESSING
e. Image representation and description: This involves representing an image in a way that can be
analysed and manipulated by a computer, and describing the features of an image in a compact and
meaningful way.
f. Image analysis: This involves using algorithms and mathematical models to extract information
from an image, such as recognizing objects, detecting patterns, and quantifying features.
g. Image synthesis and compression: This involves generating new images or compressing existing
images to reduce storage and transmission requirements.
h. Digital image processing is widely used in a variety of applications, including medical imaging,
remote sensing, computer vision, and multimedia.
STEPS INVOLVED IN DIGITAL IMAGE
PROCESSING
ADVANTAGES OF DIGITAL IMAGE
PROCESSING
There are several advantages of digital image processing that make it a valuable tool in various fields:
 It allows for the improvement of image quality, making images more visually appealing and
informative.
 It helps in extracting valuable information from images, facilitating scientific analysis and
decision-making.
 It enables the detection and recognition of patterns, objects, and features within images, supporting
applications like face detection and optical character recognition.
 In medicine, it is essential for diagnosis and analysis in fields like radiology and pathology.
 It allows for efficient compression of images, reducing storage space and facilitating faster
transmission over networks.
OVERLAPPING FIELDS WITH
IMAGE PROCESSING
According to block 1, if input is an image and we get out
image as a output, then it is termed as Digital Image
Processing.
According to block 2, if input is an image and we get some
kind of information or description as a output, then it is termed
as Computer Vision.
According to block 3, if input is some description or code and
we get image as an output, then it is termed as Computer
Graphics.
According to block 4, if input is description or some keywords
or some code and we get description or some keywords as a
output, then it is termed as Artificial Intelligence
DISADVANTAGES OF DIGITAL IMAGE
PROCESSING
While digital image processing offers many advantages, there are some potential disadvantages to
consider:
 Implementing advanced image processing techniques may require specialized knowledge and
expertise, making it challenging for non-experts.
 Some image processing algorithms can be computationally intensive, requiring substantial
processing power and memory.
 In some cases, aggressive image compression or enhancement may result in a loss of original
image information.
 Improper application of image processing techniques can introduce artifacts or distortions in
the image.
 In critical applications, relying solely on automated image processing without human
validation may lead to errors or incorrect results.
TYPES OF AN IMAGE
BINARY IMAGE– The binary image as its name suggests, contain only two pixel elements i.e 0 & 1,where
0 refers to black and 1 refers to white. This image is also known as Monochrome.
BLACK AND WHITE IMAGE– The image which consist of only black and white color is called BLACK
AND WHITE IMAGE.
8 bit COLOR FORMAT– It is the most famous image format. It has 256 different shades of colors in it and
commonly known as Grayscale Image. In this format, 0 stands for Black, and 255 stands for white, and 127
stands for gray.
16 bit COLOR FORMAT– It is a color image format. It has 65,536 different colors in it. It is also known as
High Color Format. In this format the distribution of color is not as same as Grayscale image.
TYPES OF AN IMAGE
2 , 3 , 4 ,5 ,6 bit color format
The images with a color format of 2 , 3 , 4 ,5 and 6 bit are not widely used today. They were
used in old times for old TV displays , or monitor displays.
But each of these colors have more then two gray levels , and hence has gray color unlike
the binary image.
In a 2 bit 4, in a 3 bit 8 , in a 4 bit 16, in a 5 bit 32, in a 6 bit 64 different colors are present.
BIT DEPTH is determined by the number of bits used to define each pixel. The
greater the bit depth, the greater the number of tones (grayscale or color) that can
be represented. Digital images may be produced in black and white (bitonal),
grayscale, or color.
16 BIT COLOR FORMAT
It is a color image format. It has 65,536 different colors in it. It is also
known as High color format. It has been used by Microsoft in their
systems that support more then 8 bit color format. A 16 bit format is
actually divided into three further formats which are Red , Green and
Blue. The famous (RGB) format.
Now the question arises , that how would you distribute 16 into three.
If you do it like this,
5 bits for R , 5 bits for G , 5 bits for B
Then there is one bit remains in the end.
So the distribution of 16 bit has been done like this.
5 bits for R , 6 bits for G , 5 bits for B.
The additional bit that was left behind is added into the green bit.
Because green is the color which is most soothing to eyes in all of
these three colors.
24 BIT COLOR FORMAT
Unlike a 8 bit gray scale image , which has one matrix
behind it, a 24 bit image has three different matrices of
R , G , B.
1 bit (21) = 2 tones
2 bits (22) = 4 tones
3 bits (23) = 8 tones
4 bits (24) = 16 tones
8 bits (28) = 256 tones
16 bits (216) = 65,536 tones
24 bits (224) = 16.7 million tones
IMAGES AS A MATRIX
As we know, images are represented in rows and columns we have the following syntax in which images
are represented:
PLAYING ON THE PIXEL GRID:
CONNECTIVITY, NEIGHBOURHOODS
Suppose that we consider as neighbours only the four pixels that share an
edge (not a corner) with the pixel in question: (x+1,y), (x-1,y), (x,y+1),
and (x,y-1). These are called “4-connected” neighbours for obvious
reasons.
An alternative is to consider a pixel as connected not just pixels on the
same row or column, but also the diagonal pixels. The four 4-connected
pixels plus the diagonal pixels are called “8-connected” neighbours,
again for obvious reasons.
4-connected neighbours.
8-connected neighbours
4-connectivity and 8-connectivity are also transitive: if pixel A is
connected to pixel B, and pixel B is connected to pixel C, then there
exists a connected path between pixels A and C.
DISTANCES BETWEEN PIXELS
It is often useful to describe the distance between two pixels (x1, y1) and (x2, y2).
One obvious measure is the Euclidean (as the crow flies) distance
Another measure is the 4-connected distance D4 (sometimes called city-block distance
A third measure is the 8-connected distance D8 (sometimes called chessboard distance
SAMPLING AND QUANTIZATION
In order to become suitable for digital processing, an image function f(x,y) must be digitized both spatially
and in amplitude. Typically, a frame grabber or digitizer is used to sample and quantize the analogue video
signal. Hence in order to create an image which is digital, we need to covert continuous data into digital
form. There are two steps in which it is done:
•Sampling
•Quantization
The sampling rate determines the spatial resolution of the digitized image, while the quantization level
determines the number of grey levels in the digitized image. A magnitude of the sampled image is
expressed as a digital value in image processing. The transition between continuous values of the image
function and its digital equivalent is called quantization.
Sampling : related to coordinates values (Nyquist frequency)
Quantization : related to intensity values
SAMPLING AND QUANTIZATION
There are some variations in the sampled signal which are
random in nature. These variations are due to noise.
We can reduce this noise by more taking samples. More samples
refer to collectiong more data i.e., more pixels (in case of an
image) which will eventually result in better image quality with
less noise present.
The number of samples taken on the x-axis of a continuous
signal refers to the number of pixels of that image.
SAMPLING
It is opposite of sampling as sampling is done on the x-axis,
while quantization is done on the y-axis.
Digitization the amplitudes is quantization. In this, we divide
the signal amplitude into quanta (partitions).
The above quantized image represents 5 different levels of gray
and that means the image formed from this signal, would only
have 5 different colors. It would be a black and white image
more or less with some colors of gray.
QUANTIZATION
y (intensity values)
Generating a digital image. (a)
Continuous image. (b) A
scaling line from A to B in the
continuous image, used to
illustrate the concepts of
sampling and quantization. (c)
sampling and quantization. (d)
Digital scan line.
a b
c d
(a) Continuous image projected onto
a sensor array.
(b) (b) Result of image sampling and
quantization.
a b
0 0 0 75 75 75
12
8
12
8
12
8
12
8
0 75 75 75
12
8
12
8
12
8
25
5
25
5
25
5
75 75 75
20
0
20
0
20
0
25
5
25
5
25
5
20
0
12
8
12
8
12
8
20
0
20
0
25
5
25
5
20
0
20
0
20
0
12
8
12
8
12
8
25
5
25
5
20
0
20
0
20
0
75 75
17
5
17
5
17
5
22
5
22
5
22
5
75 75 75
10
0
17
5
17
5
10
0
10
0
10
0
22
5
22
5
75 75
10
0
75 75 75 35 35 35 0 0 0 35
35 35 35 0 0 0 35 35 35 75
10 10 10 20 20 20 20
1024
512
256
128
64
32
SAMPLING
1024 512 256
128 64 32
SAMPLING
QUANTIZATION
8-bit 7-bit 6-bit 5-bit
4-bit 3-bit 2-bit 1-bit
APPLICATIONS
Sampling and quantization allow images to be applied in medicine for accurate diagnosis. Visualizing
human body parts with the help of X-rays, MRI, and scans, thereby making it easier for computer-aided
diagnosis.
Furthermore, we can use sampling and quantization in remote sensing, which plays a major role in studying
objects in space in a cheaper way.
Moreover, the digitization of images facilitated the existence of the computer vision field. Machine
learning and deep learning algorithms are proven efficient with the help of digital images.
Sampling Quantization
Digitization of co-ordinate values. Digitization of amplitude values.
x-axis(time) – discretized. x-axis(time) – continuous.
y-axis(amplitude) – continuous. y-axis(amplitude) – discretized.
Sampling is done prior to the quantization process. Quantizatin is done after the sampling process.
It determines the spatial resolution of the digitized
images.
It determines the number of grey levels in the
digitized images.
It reduces c.c. to a series of tent poles over a time. It reduces c.c. to a continuous series of stair steps.
A single amplitude value is selected from different
values of the time interval to represent it.
Values representing the time intervals are rounded off
to create a defined set of possible amplitude values.
SAMPLING VS QUANTIZATION

Chapter-1.pptx

  • 1.
  • 2.
    WHAT IS ANIMAGE? An image may be defined as a two-dimensional function, f(x, y), where x and y are spatial (plane) coordinates, and the amplitude of f at any pair of coordinates (x, y) is called the intensity or gray level of the image at that point. When x, y, and the amplitude values of f are all finite, discrete quantities, we call the image a digital image.
  • 3.
    WHAT IS DIGITALIMAGE PROCESSING (DIP)? Digital image processing refers to the manipulation, enhancement, and analysis of digital images using computer algorithms and techniques. It involves the application of various mathematical operations and algorithms to alter or extract information from digital images. In this process, images are treated as two- dimensional arrays of pixels, where each pixel represents a point of color and brightness.
  • 4.
    Pixel is thesmallest element of an image. A pixel is also known as PEL. Each pixel correspond to any one value. In an 8-bit gray scale image, the value of the pixel between 0 and 255. The value of a pixel at any point correspond to the intensity of the light photons striking at that point. Each pixel store a value proportional to the light intensity at that particular location. PIXEL
  • 5.
    REPRESENTING DIGITAL IMAGES Assumethat an image f(x, y) is sampled so that the resulting digital image has M rows and N columns. The values of the coordinates (x, y) now become discrete quantities. For notational clarity and convenience, we shall use integer values for these discrete coordinates. Thus, the values of the coordinates at the origin are (x, y) = (0, 0). The next coordinate values along the first row of the image are represented as (x, y) = (0, 1). It is important to keep in mind that the notation (0, 1) is used to signify the second sample along the first row.
  • 6.
    The basic stepsinvolved in digital image processing are: a. Image acquisition: This involves capturing an image using a digital camera or scanner, or importing an existing image into a computer. b. Image enhancement: This involves improving the visual quality of an image, such as increasing contrast, reducing noise, and removing artifacts. c. Image restoration: This involves removing degradation from an image, such as blurring, noise, and distortion. d. Image segmentation: This involves dividing an image into regions or segments, each of which corresponds to a specific object or feature in the image. STEPS INVOLVED IN DIGITAL IMAGE PROCESSING
  • 7.
    e. Image representationand description: This involves representing an image in a way that can be analysed and manipulated by a computer, and describing the features of an image in a compact and meaningful way. f. Image analysis: This involves using algorithms and mathematical models to extract information from an image, such as recognizing objects, detecting patterns, and quantifying features. g. Image synthesis and compression: This involves generating new images or compressing existing images to reduce storage and transmission requirements. h. Digital image processing is widely used in a variety of applications, including medical imaging, remote sensing, computer vision, and multimedia. STEPS INVOLVED IN DIGITAL IMAGE PROCESSING
  • 8.
    ADVANTAGES OF DIGITALIMAGE PROCESSING There are several advantages of digital image processing that make it a valuable tool in various fields:  It allows for the improvement of image quality, making images more visually appealing and informative.  It helps in extracting valuable information from images, facilitating scientific analysis and decision-making.  It enables the detection and recognition of patterns, objects, and features within images, supporting applications like face detection and optical character recognition.  In medicine, it is essential for diagnosis and analysis in fields like radiology and pathology.  It allows for efficient compression of images, reducing storage space and facilitating faster transmission over networks.
  • 9.
    OVERLAPPING FIELDS WITH IMAGEPROCESSING According to block 1, if input is an image and we get out image as a output, then it is termed as Digital Image Processing. According to block 2, if input is an image and we get some kind of information or description as a output, then it is termed as Computer Vision. According to block 3, if input is some description or code and we get image as an output, then it is termed as Computer Graphics. According to block 4, if input is description or some keywords or some code and we get description or some keywords as a output, then it is termed as Artificial Intelligence
  • 10.
    DISADVANTAGES OF DIGITALIMAGE PROCESSING While digital image processing offers many advantages, there are some potential disadvantages to consider:  Implementing advanced image processing techniques may require specialized knowledge and expertise, making it challenging for non-experts.  Some image processing algorithms can be computationally intensive, requiring substantial processing power and memory.  In some cases, aggressive image compression or enhancement may result in a loss of original image information.  Improper application of image processing techniques can introduce artifacts or distortions in the image.  In critical applications, relying solely on automated image processing without human validation may lead to errors or incorrect results.
  • 11.
    TYPES OF ANIMAGE BINARY IMAGE– The binary image as its name suggests, contain only two pixel elements i.e 0 & 1,where 0 refers to black and 1 refers to white. This image is also known as Monochrome. BLACK AND WHITE IMAGE– The image which consist of only black and white color is called BLACK AND WHITE IMAGE. 8 bit COLOR FORMAT– It is the most famous image format. It has 256 different shades of colors in it and commonly known as Grayscale Image. In this format, 0 stands for Black, and 255 stands for white, and 127 stands for gray. 16 bit COLOR FORMAT– It is a color image format. It has 65,536 different colors in it. It is also known as High Color Format. In this format the distribution of color is not as same as Grayscale image.
  • 12.
    TYPES OF ANIMAGE 2 , 3 , 4 ,5 ,6 bit color format The images with a color format of 2 , 3 , 4 ,5 and 6 bit are not widely used today. They were used in old times for old TV displays , or monitor displays. But each of these colors have more then two gray levels , and hence has gray color unlike the binary image. In a 2 bit 4, in a 3 bit 8 , in a 4 bit 16, in a 5 bit 32, in a 6 bit 64 different colors are present. BIT DEPTH is determined by the number of bits used to define each pixel. The greater the bit depth, the greater the number of tones (grayscale or color) that can be represented. Digital images may be produced in black and white (bitonal), grayscale, or color.
  • 13.
    16 BIT COLORFORMAT It is a color image format. It has 65,536 different colors in it. It is also known as High color format. It has been used by Microsoft in their systems that support more then 8 bit color format. A 16 bit format is actually divided into three further formats which are Red , Green and Blue. The famous (RGB) format. Now the question arises , that how would you distribute 16 into three. If you do it like this, 5 bits for R , 5 bits for G , 5 bits for B Then there is one bit remains in the end. So the distribution of 16 bit has been done like this. 5 bits for R , 6 bits for G , 5 bits for B. The additional bit that was left behind is added into the green bit. Because green is the color which is most soothing to eyes in all of these three colors.
  • 14.
    24 BIT COLORFORMAT Unlike a 8 bit gray scale image , which has one matrix behind it, a 24 bit image has three different matrices of R , G , B. 1 bit (21) = 2 tones 2 bits (22) = 4 tones 3 bits (23) = 8 tones 4 bits (24) = 16 tones 8 bits (28) = 256 tones 16 bits (216) = 65,536 tones 24 bits (224) = 16.7 million tones
  • 15.
    IMAGES AS AMATRIX As we know, images are represented in rows and columns we have the following syntax in which images are represented:
  • 16.
    PLAYING ON THEPIXEL GRID: CONNECTIVITY, NEIGHBOURHOODS Suppose that we consider as neighbours only the four pixels that share an edge (not a corner) with the pixel in question: (x+1,y), (x-1,y), (x,y+1), and (x,y-1). These are called “4-connected” neighbours for obvious reasons. An alternative is to consider a pixel as connected not just pixels on the same row or column, but also the diagonal pixels. The four 4-connected pixels plus the diagonal pixels are called “8-connected” neighbours, again for obvious reasons. 4-connected neighbours. 8-connected neighbours 4-connectivity and 8-connectivity are also transitive: if pixel A is connected to pixel B, and pixel B is connected to pixel C, then there exists a connected path between pixels A and C.
  • 17.
    DISTANCES BETWEEN PIXELS Itis often useful to describe the distance between two pixels (x1, y1) and (x2, y2). One obvious measure is the Euclidean (as the crow flies) distance Another measure is the 4-connected distance D4 (sometimes called city-block distance A third measure is the 8-connected distance D8 (sometimes called chessboard distance
  • 18.
    SAMPLING AND QUANTIZATION Inorder to become suitable for digital processing, an image function f(x,y) must be digitized both spatially and in amplitude. Typically, a frame grabber or digitizer is used to sample and quantize the analogue video signal. Hence in order to create an image which is digital, we need to covert continuous data into digital form. There are two steps in which it is done: •Sampling •Quantization The sampling rate determines the spatial resolution of the digitized image, while the quantization level determines the number of grey levels in the digitized image. A magnitude of the sampled image is expressed as a digital value in image processing. The transition between continuous values of the image function and its digital equivalent is called quantization.
  • 19.
    Sampling : relatedto coordinates values (Nyquist frequency) Quantization : related to intensity values SAMPLING AND QUANTIZATION
  • 20.
    There are somevariations in the sampled signal which are random in nature. These variations are due to noise. We can reduce this noise by more taking samples. More samples refer to collectiong more data i.e., more pixels (in case of an image) which will eventually result in better image quality with less noise present. The number of samples taken on the x-axis of a continuous signal refers to the number of pixels of that image. SAMPLING
  • 21.
    It is oppositeof sampling as sampling is done on the x-axis, while quantization is done on the y-axis. Digitization the amplitudes is quantization. In this, we divide the signal amplitude into quanta (partitions). The above quantized image represents 5 different levels of gray and that means the image formed from this signal, would only have 5 different colors. It would be a black and white image more or less with some colors of gray. QUANTIZATION
  • 22.
    y (intensity values) Generatinga digital image. (a) Continuous image. (b) A scaling line from A to B in the continuous image, used to illustrate the concepts of sampling and quantization. (c) sampling and quantization. (d) Digital scan line. a b c d
  • 23.
    (a) Continuous imageprojected onto a sensor array. (b) (b) Result of image sampling and quantization. a b
  • 24.
    0 0 075 75 75 12 8 12 8 12 8 12 8 0 75 75 75 12 8 12 8 12 8 25 5 25 5 25 5 75 75 75 20 0 20 0 20 0 25 5 25 5 25 5 20 0 12 8 12 8 12 8 20 0 20 0 25 5 25 5 20 0 20 0 20 0 12 8 12 8 12 8 25 5 25 5 20 0 20 0 20 0 75 75 17 5 17 5 17 5 22 5 22 5 22 5 75 75 75 10 0 17 5 17 5 10 0 10 0 10 0 22 5 22 5 75 75 10 0 75 75 75 35 35 35 0 0 0 35 35 35 35 0 0 0 35 35 35 75 10 10 10 20 20 20 20
  • 25.
  • 26.
    1024 512 256 12864 32 SAMPLING
  • 27.
    QUANTIZATION 8-bit 7-bit 6-bit5-bit 4-bit 3-bit 2-bit 1-bit
  • 28.
    APPLICATIONS Sampling and quantizationallow images to be applied in medicine for accurate diagnosis. Visualizing human body parts with the help of X-rays, MRI, and scans, thereby making it easier for computer-aided diagnosis. Furthermore, we can use sampling and quantization in remote sensing, which plays a major role in studying objects in space in a cheaper way. Moreover, the digitization of images facilitated the existence of the computer vision field. Machine learning and deep learning algorithms are proven efficient with the help of digital images.
  • 29.
    Sampling Quantization Digitization ofco-ordinate values. Digitization of amplitude values. x-axis(time) – discretized. x-axis(time) – continuous. y-axis(amplitude) – continuous. y-axis(amplitude) – discretized. Sampling is done prior to the quantization process. Quantizatin is done after the sampling process. It determines the spatial resolution of the digitized images. It determines the number of grey levels in the digitized images. It reduces c.c. to a series of tent poles over a time. It reduces c.c. to a continuous series of stair steps. A single amplitude value is selected from different values of the time interval to represent it. Values representing the time intervals are rounded off to create a defined set of possible amplitude values. SAMPLING VS QUANTIZATION