Download to read offline

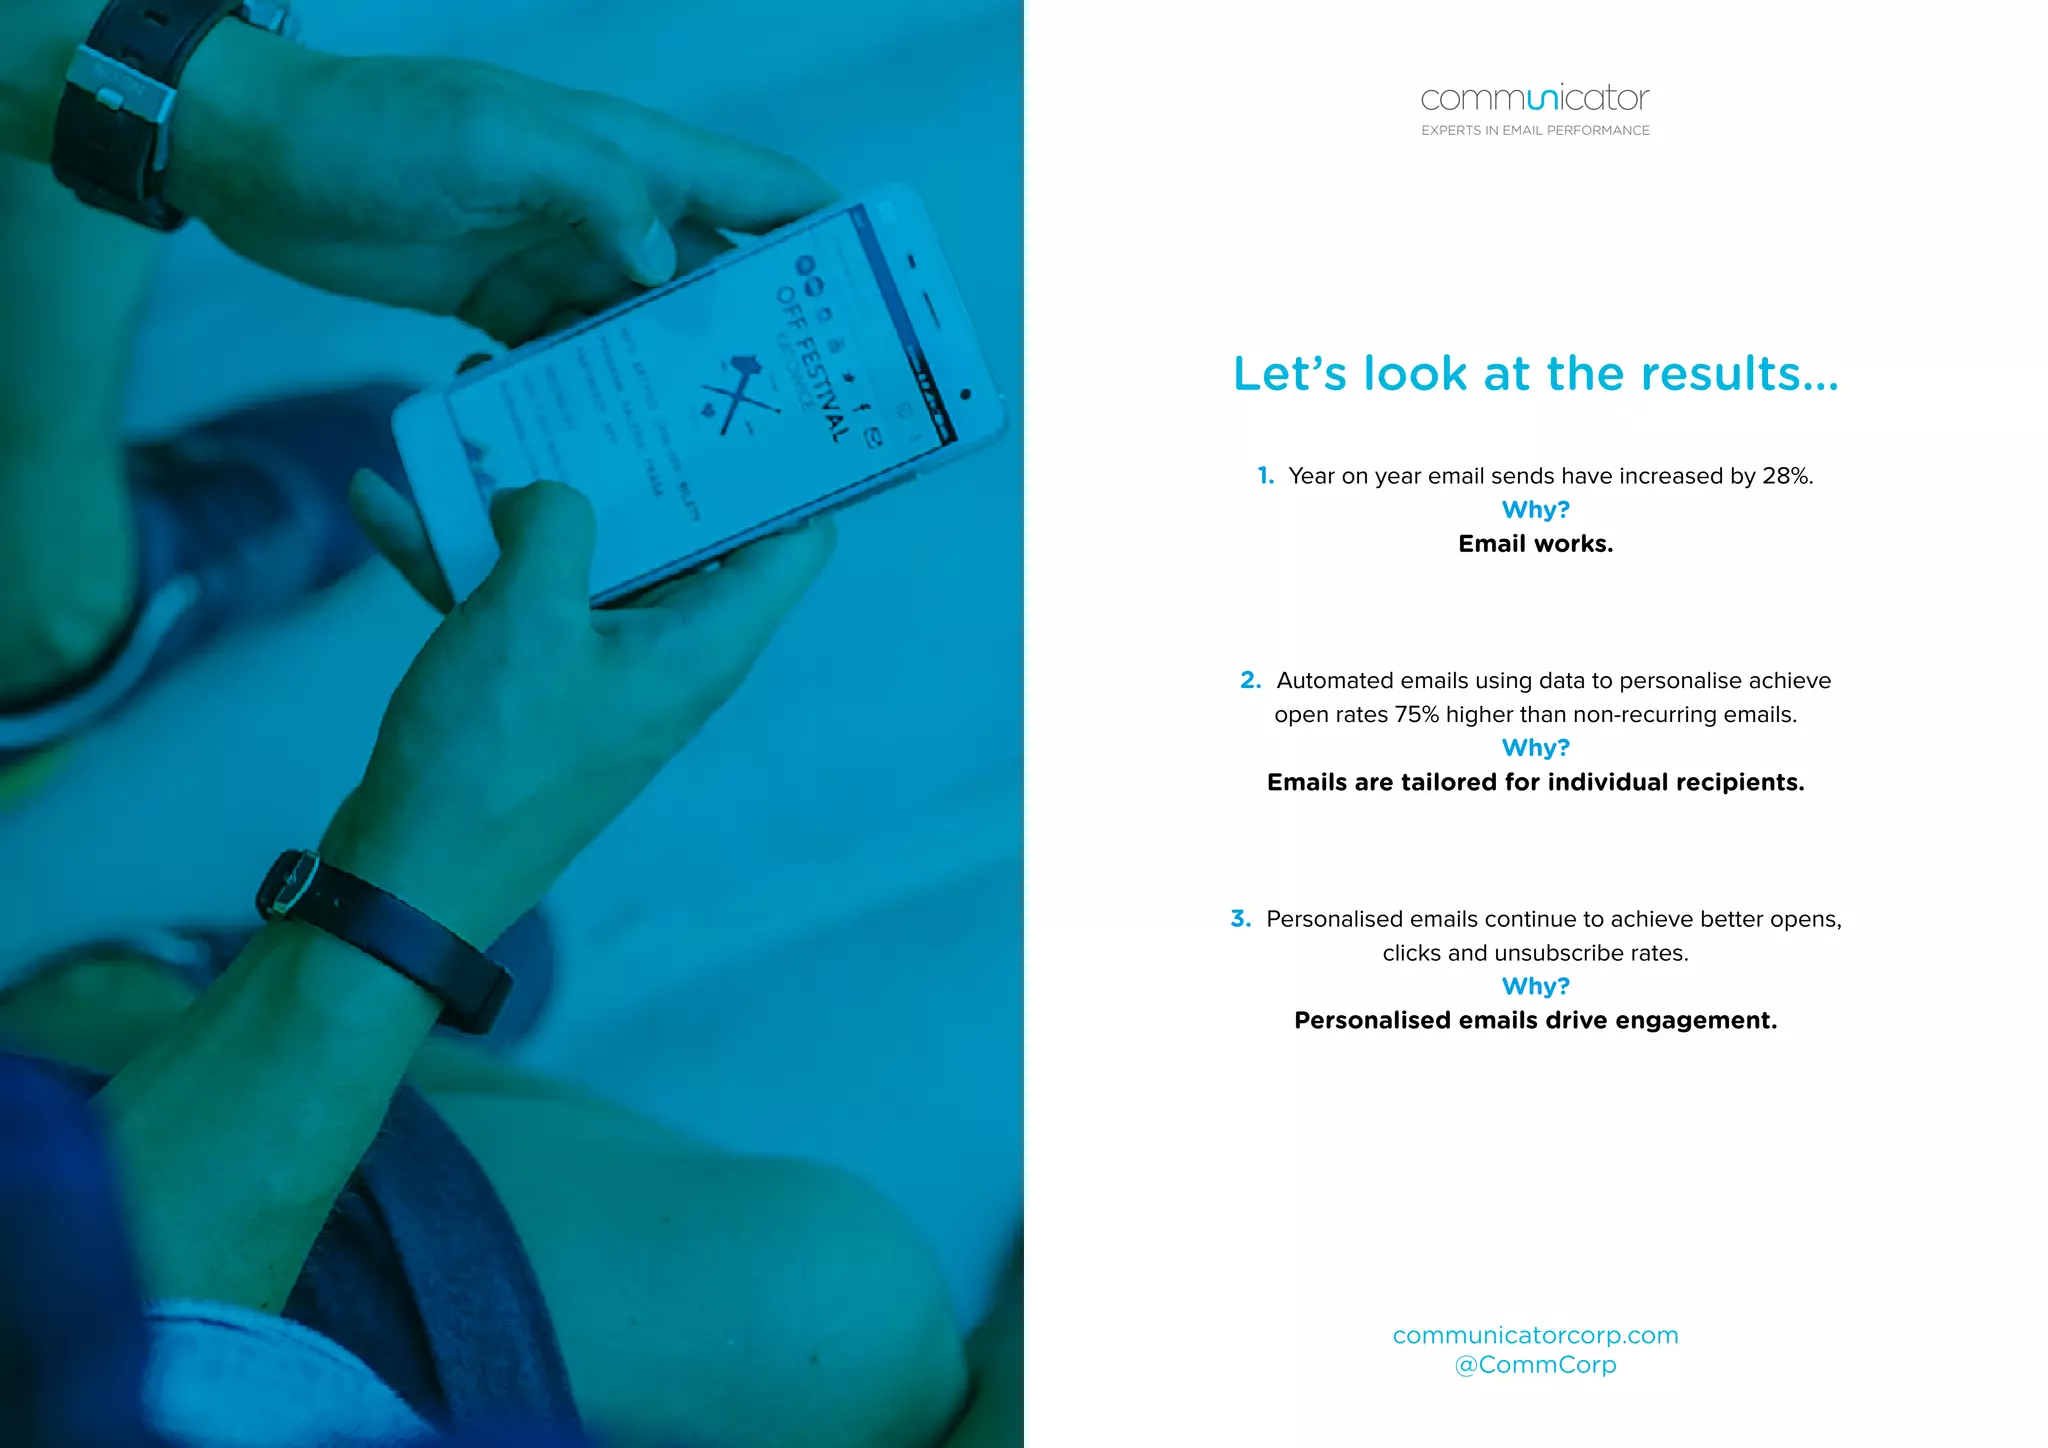
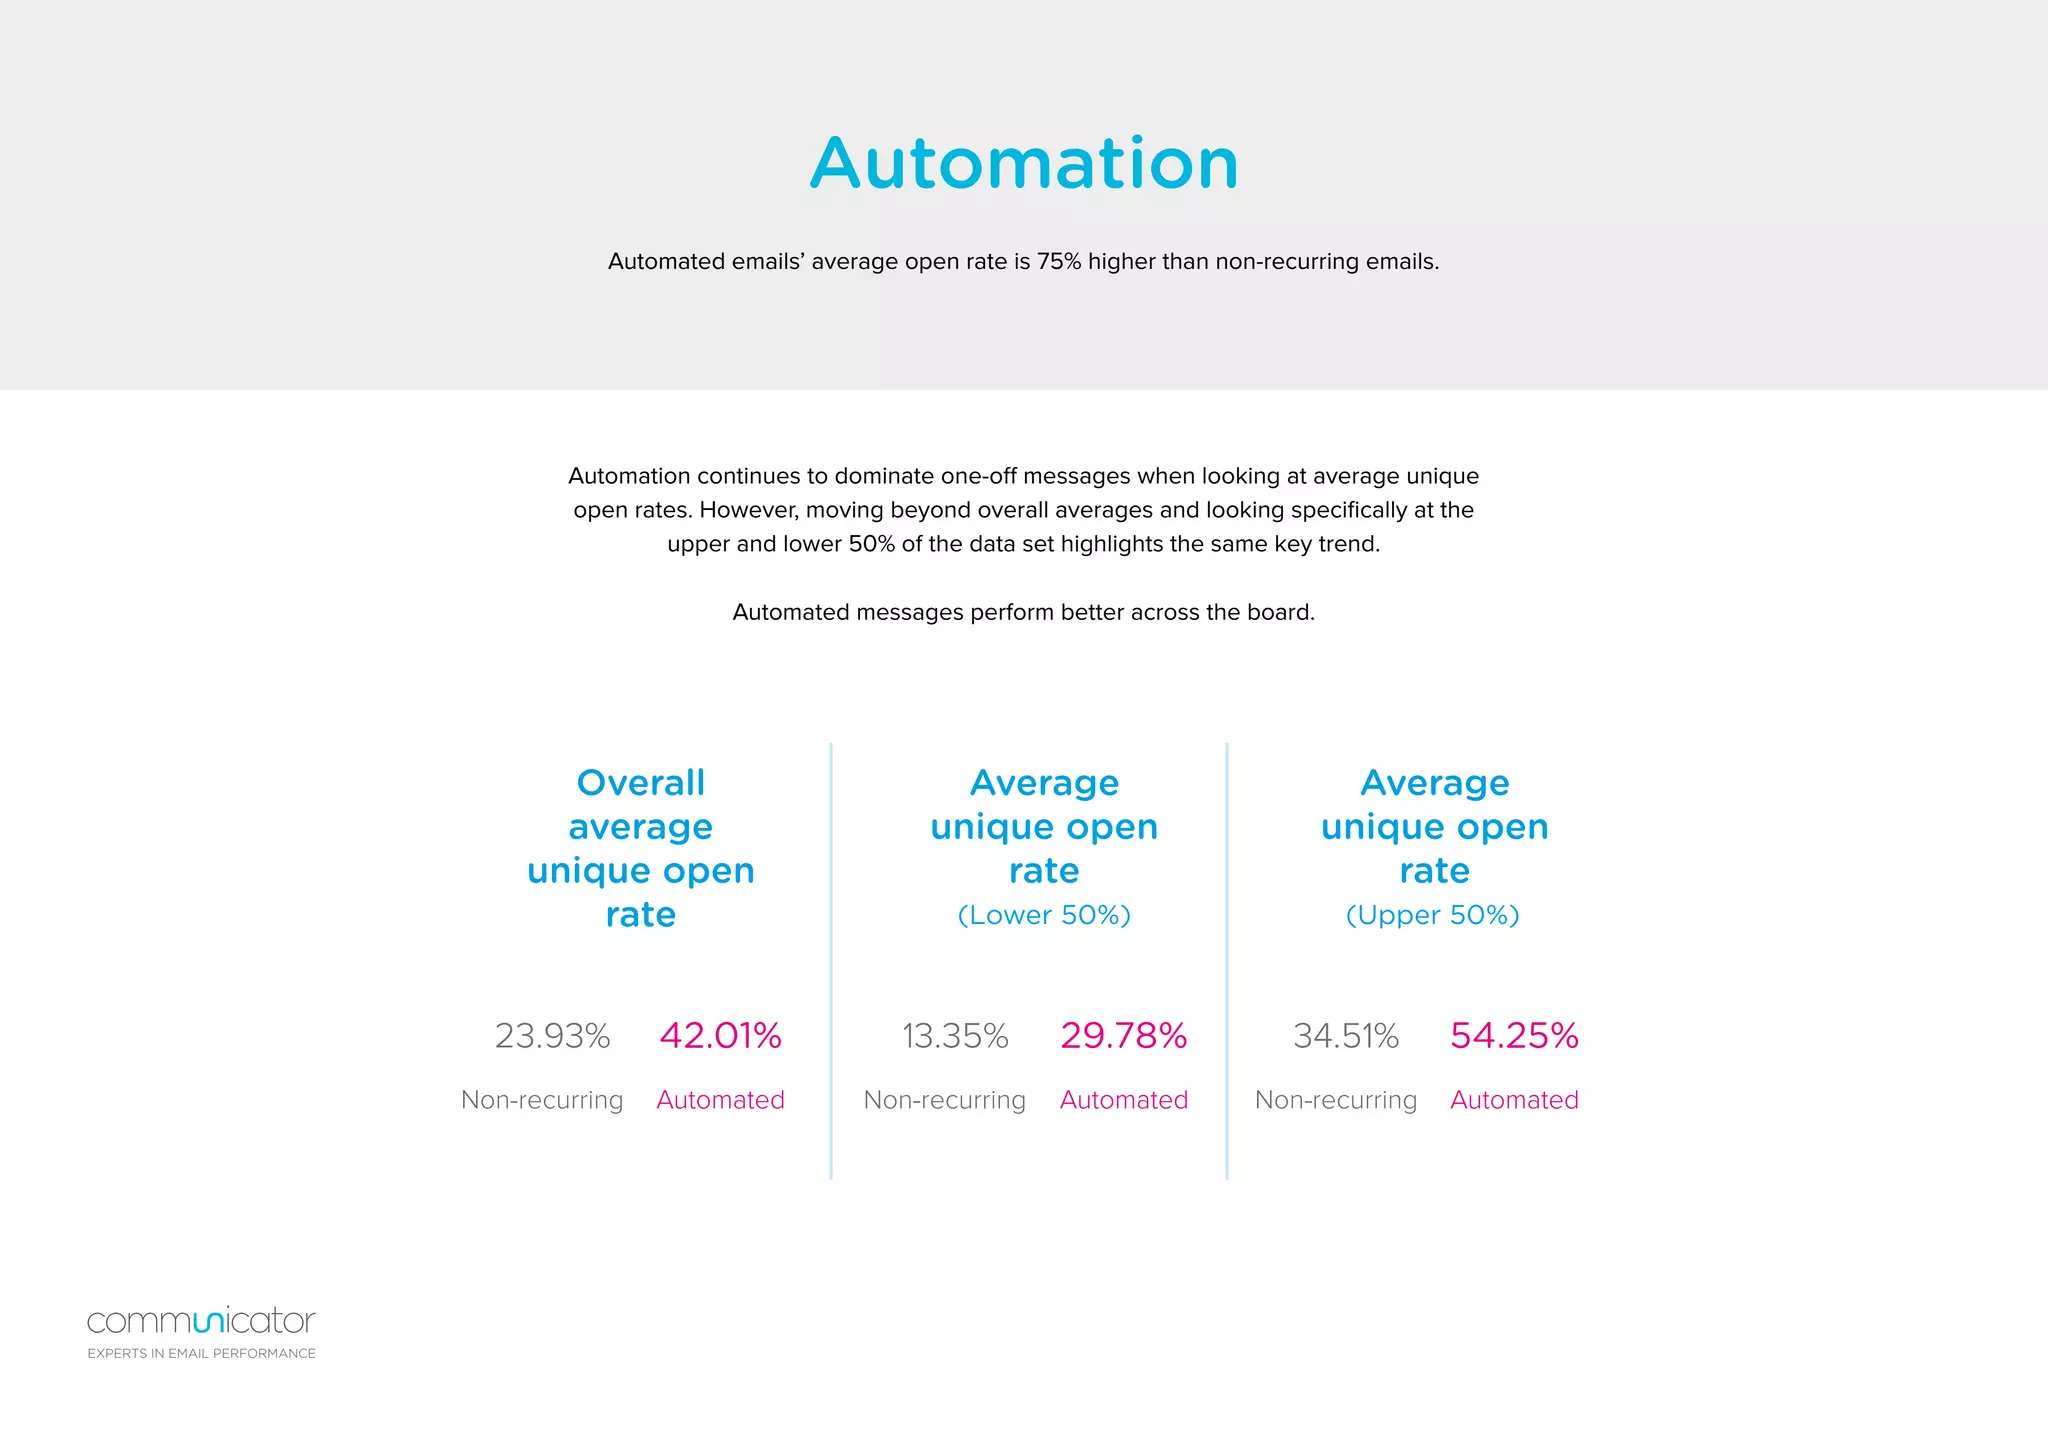
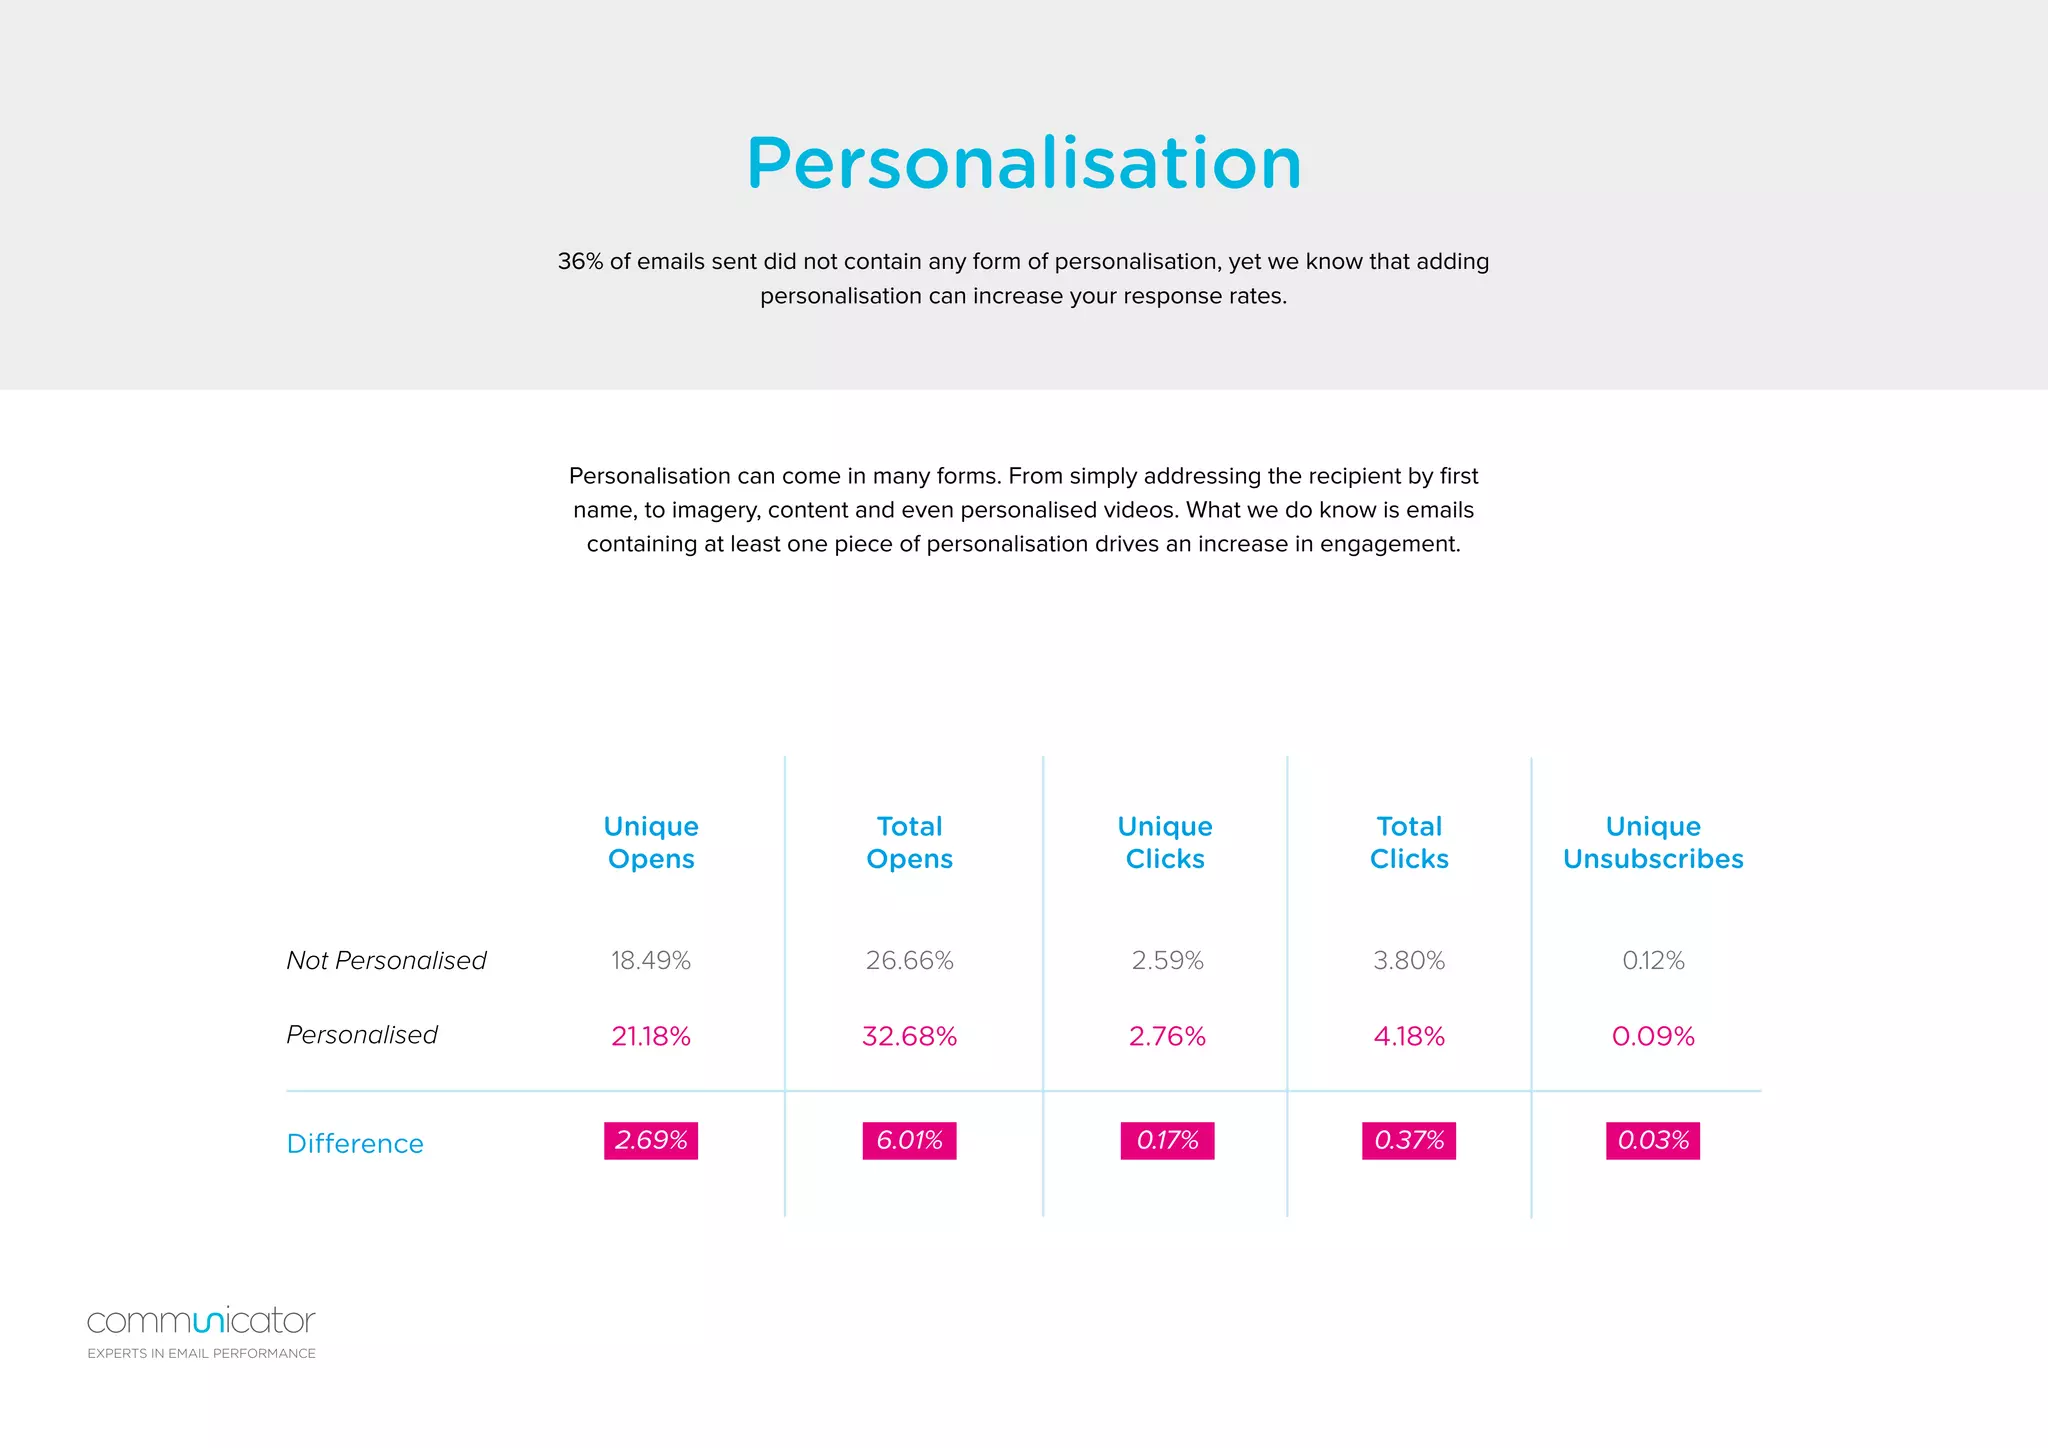
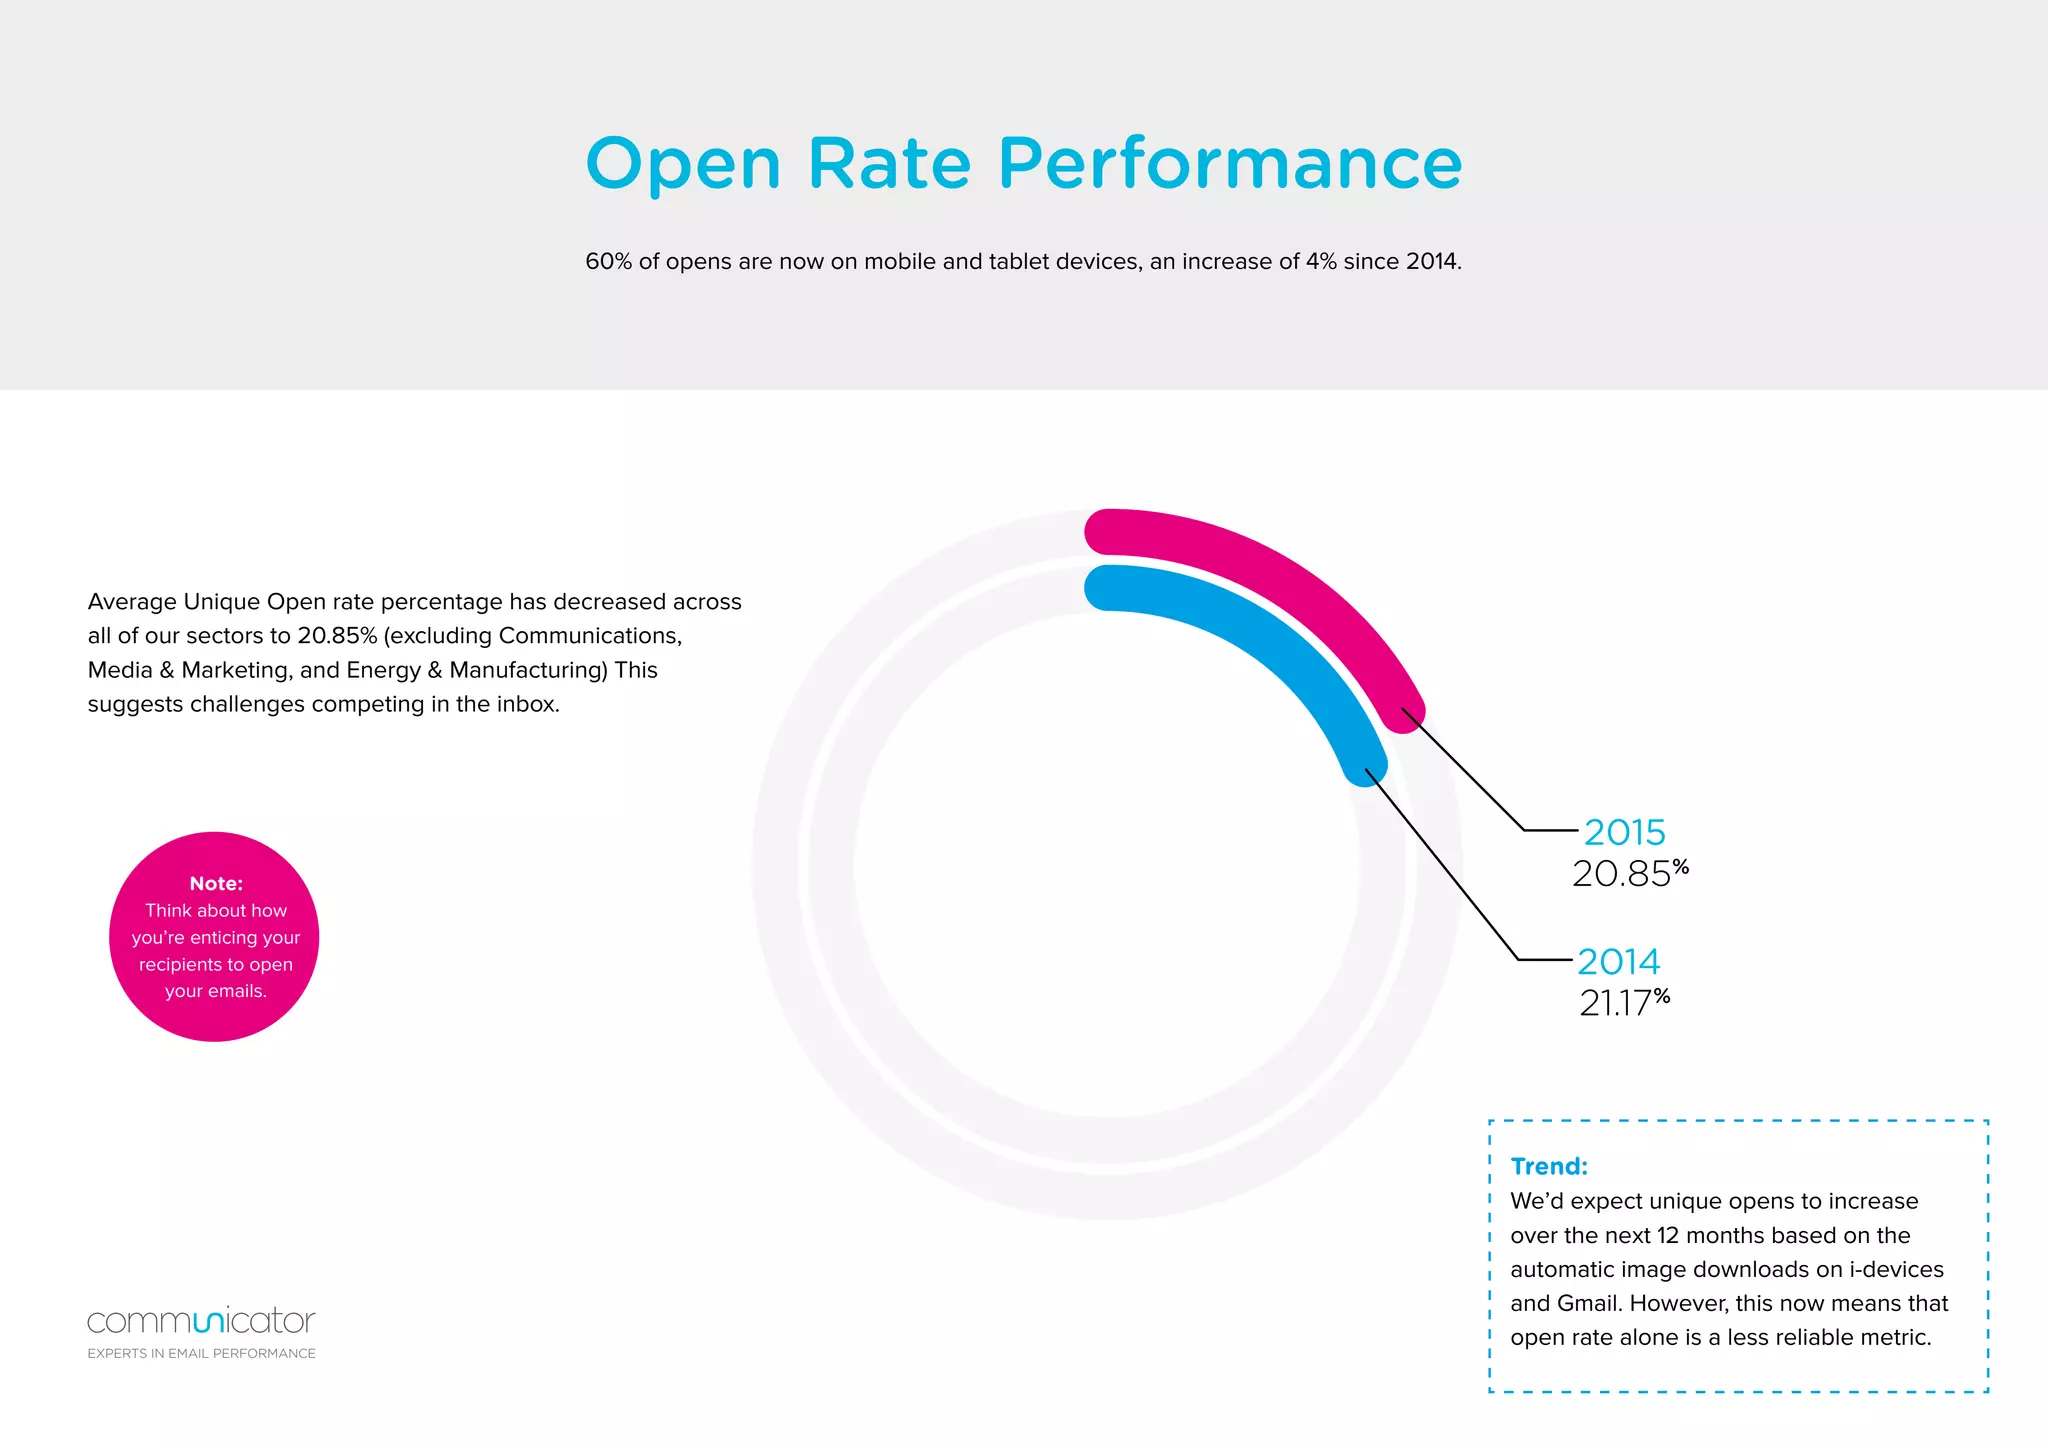
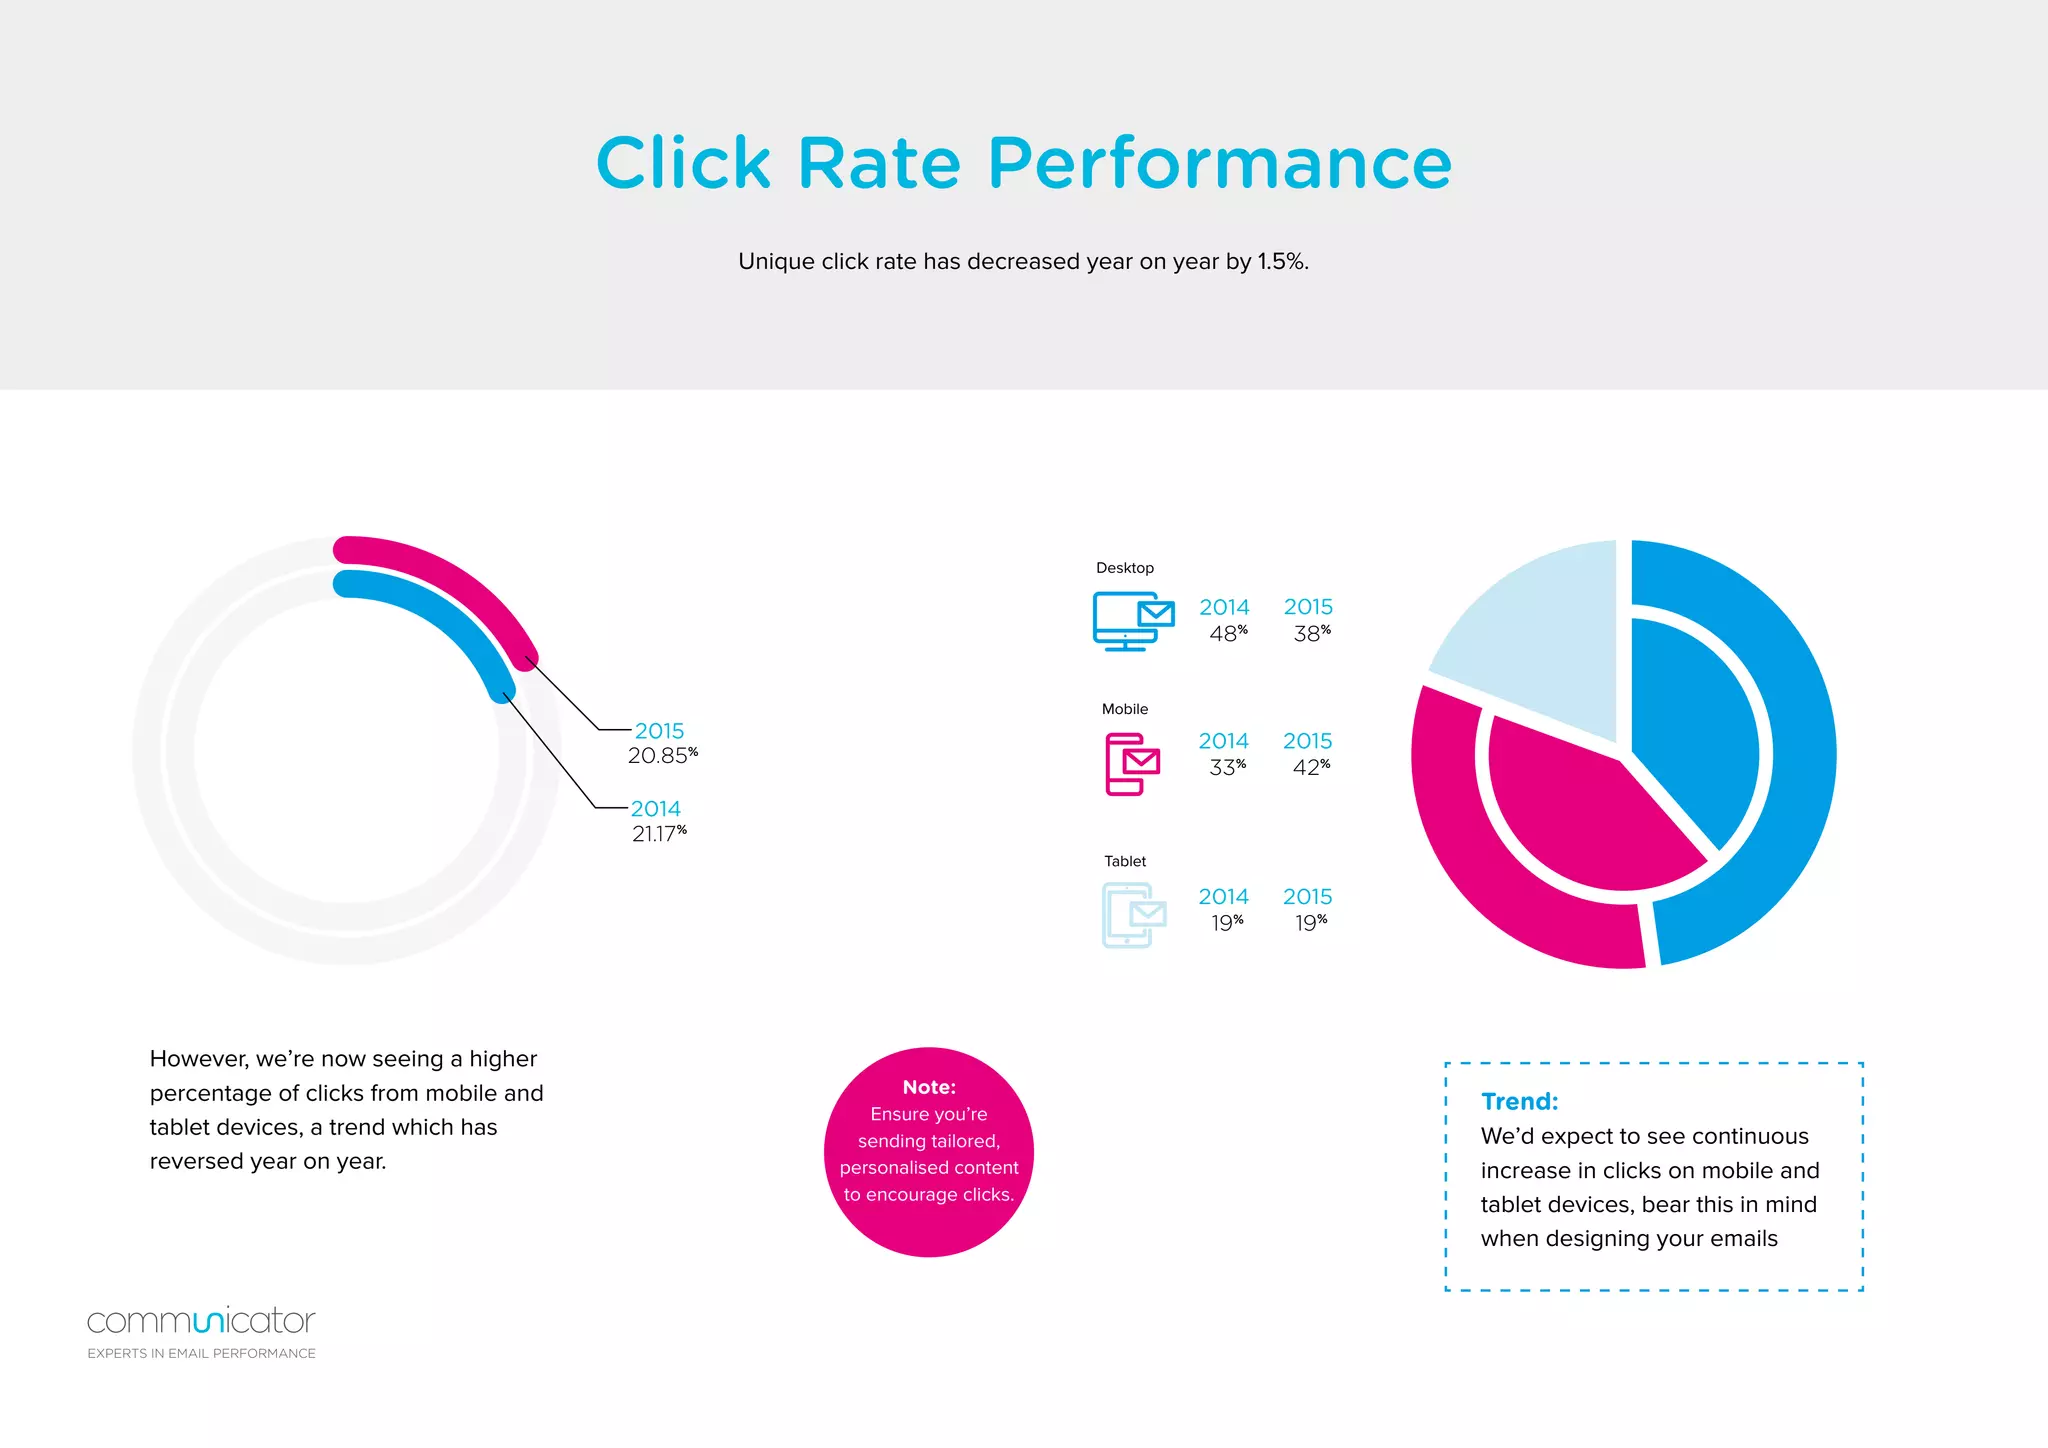
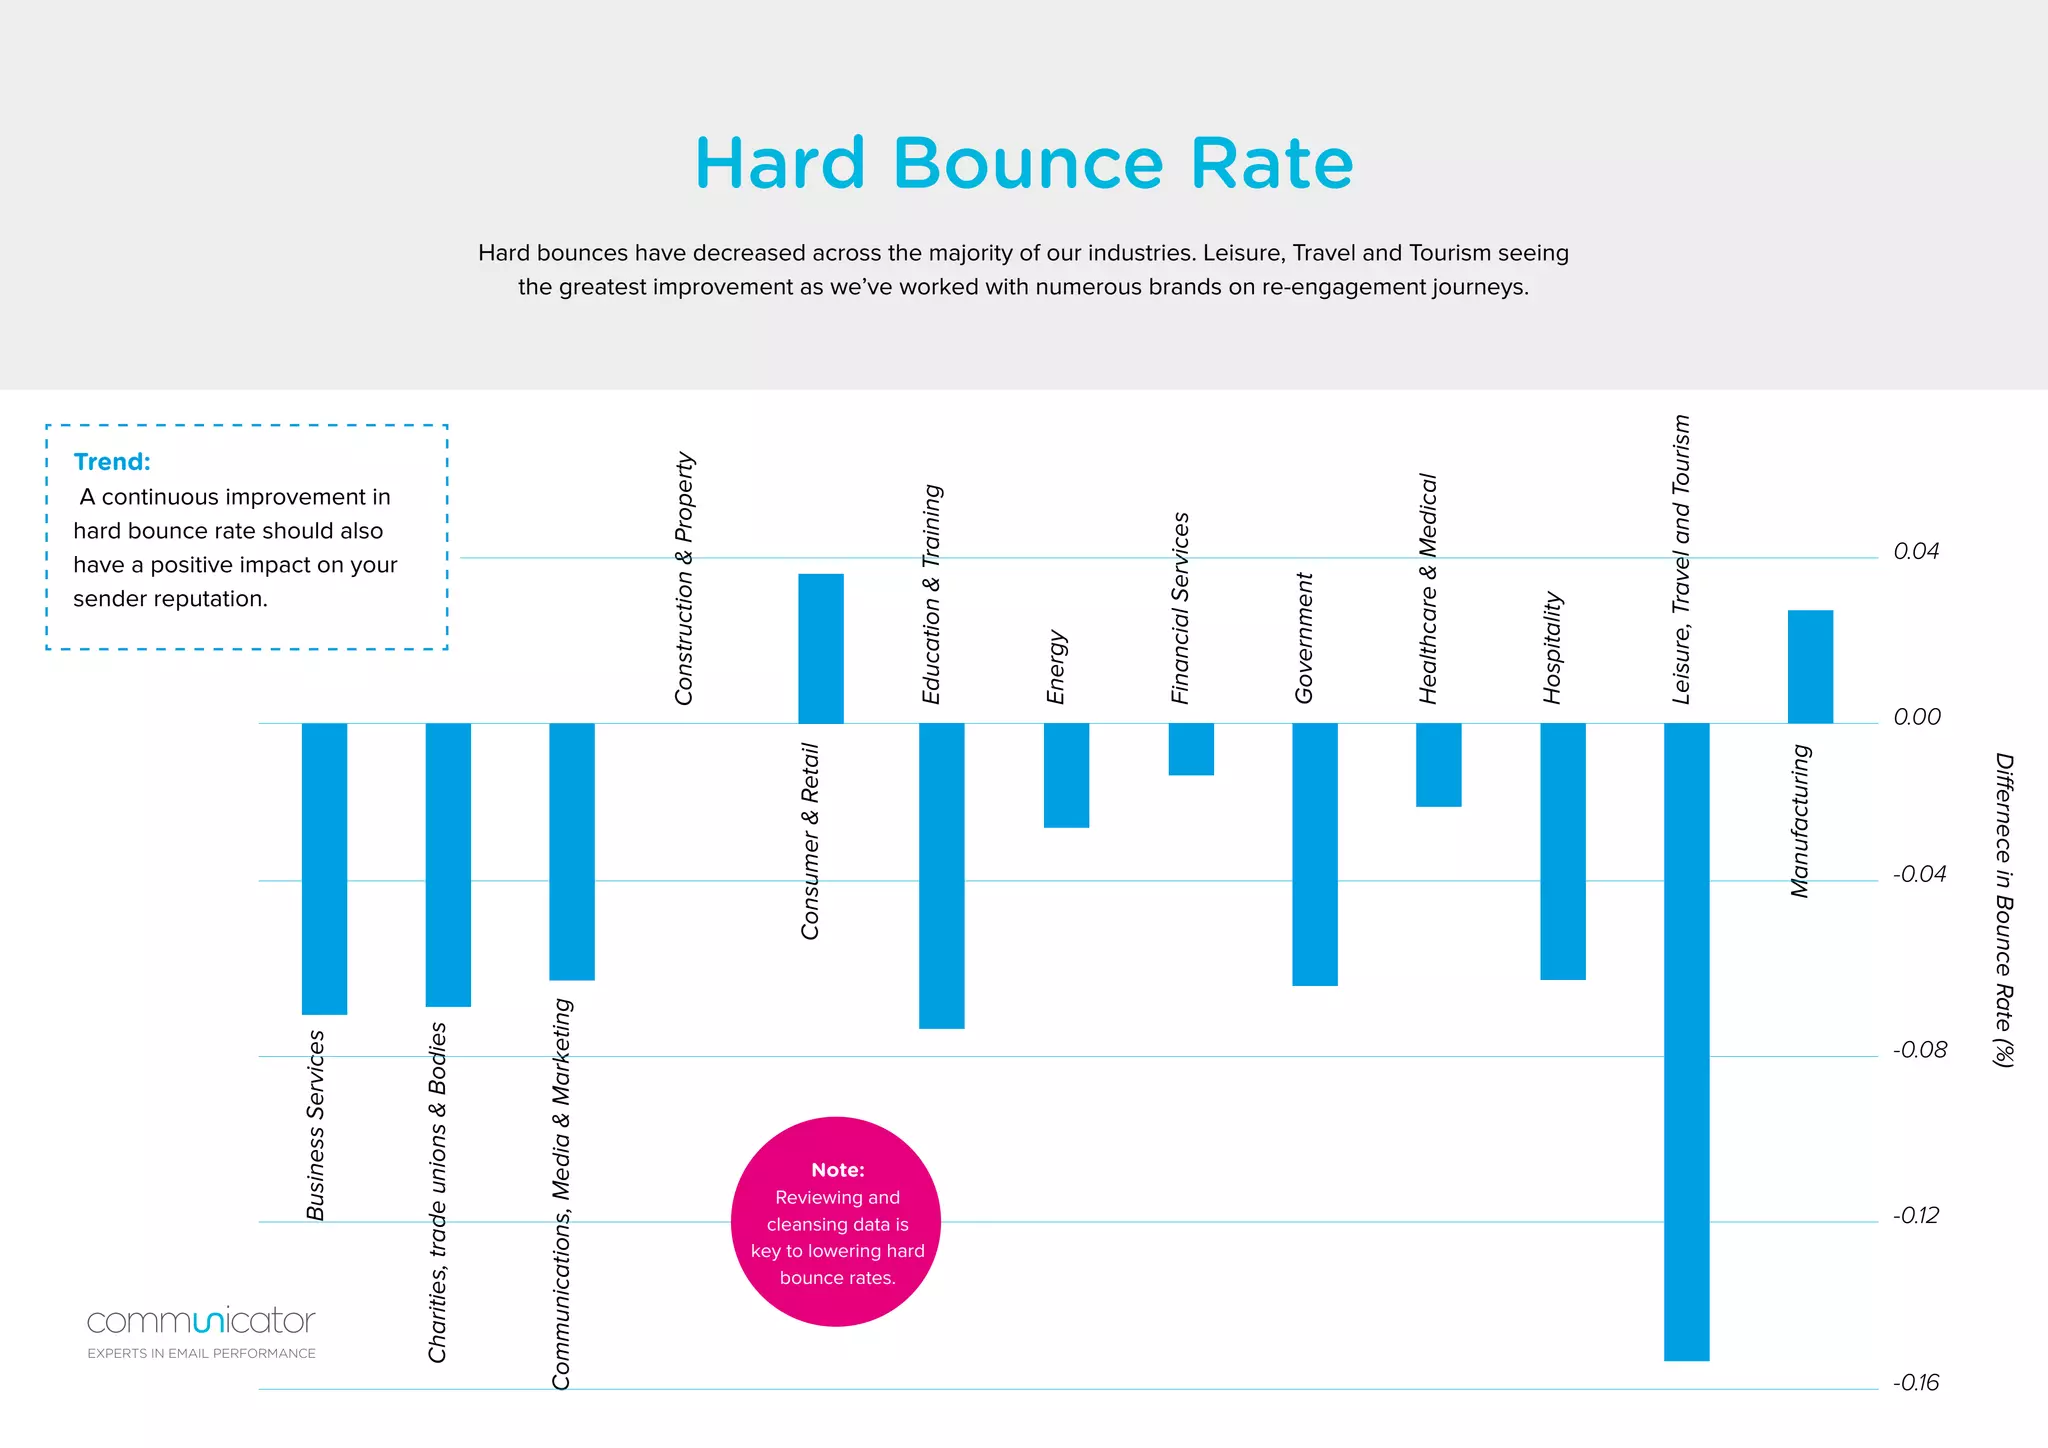
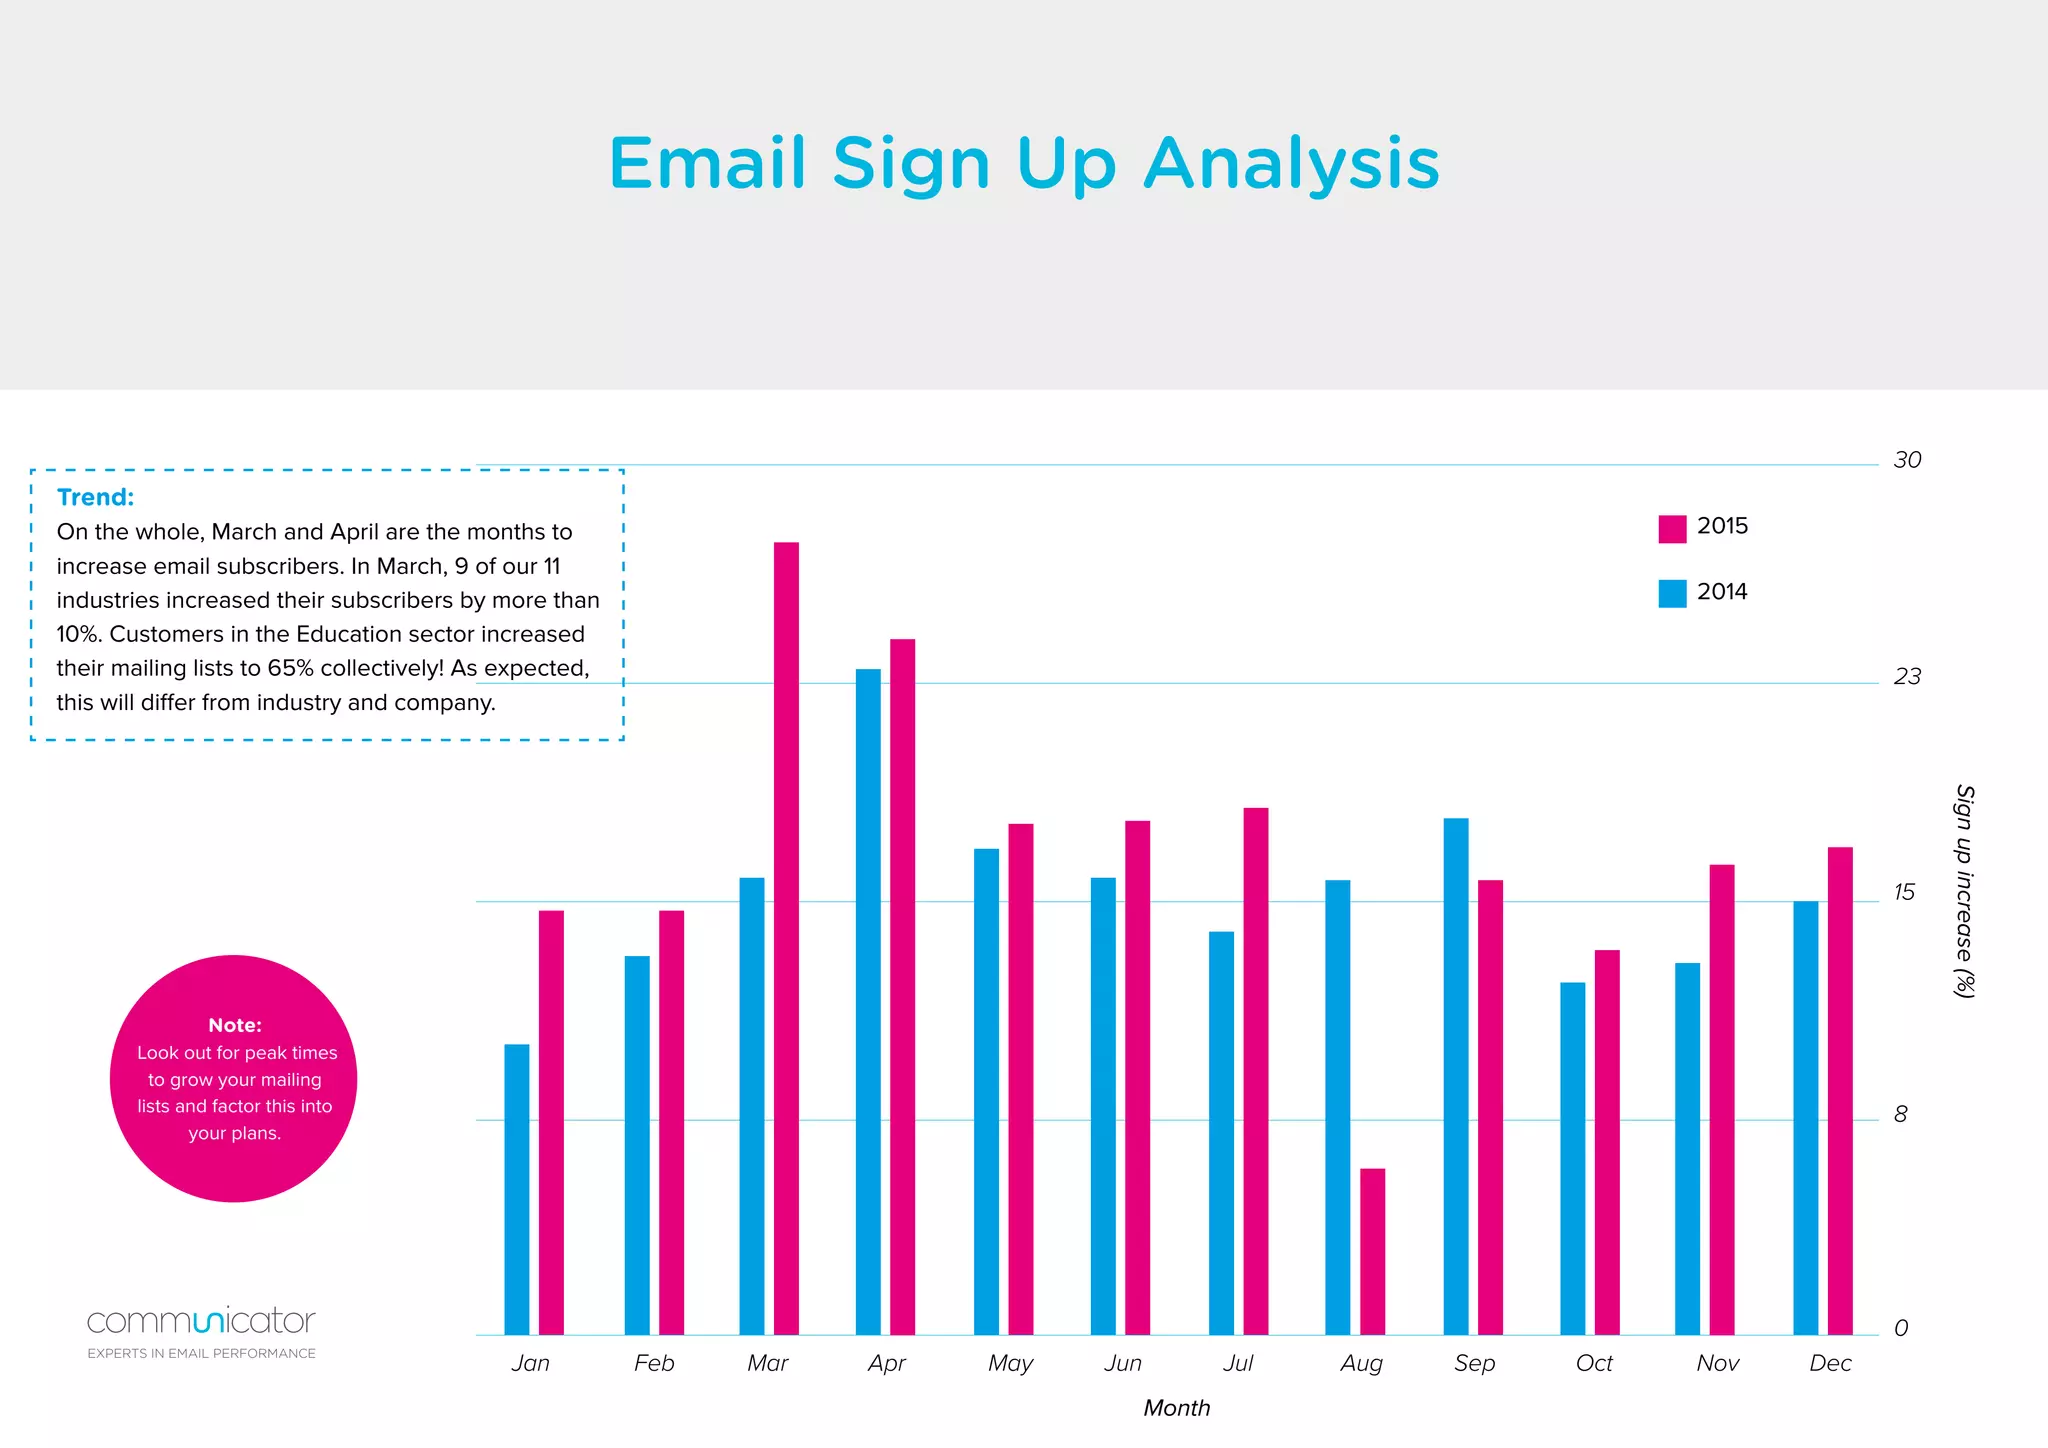


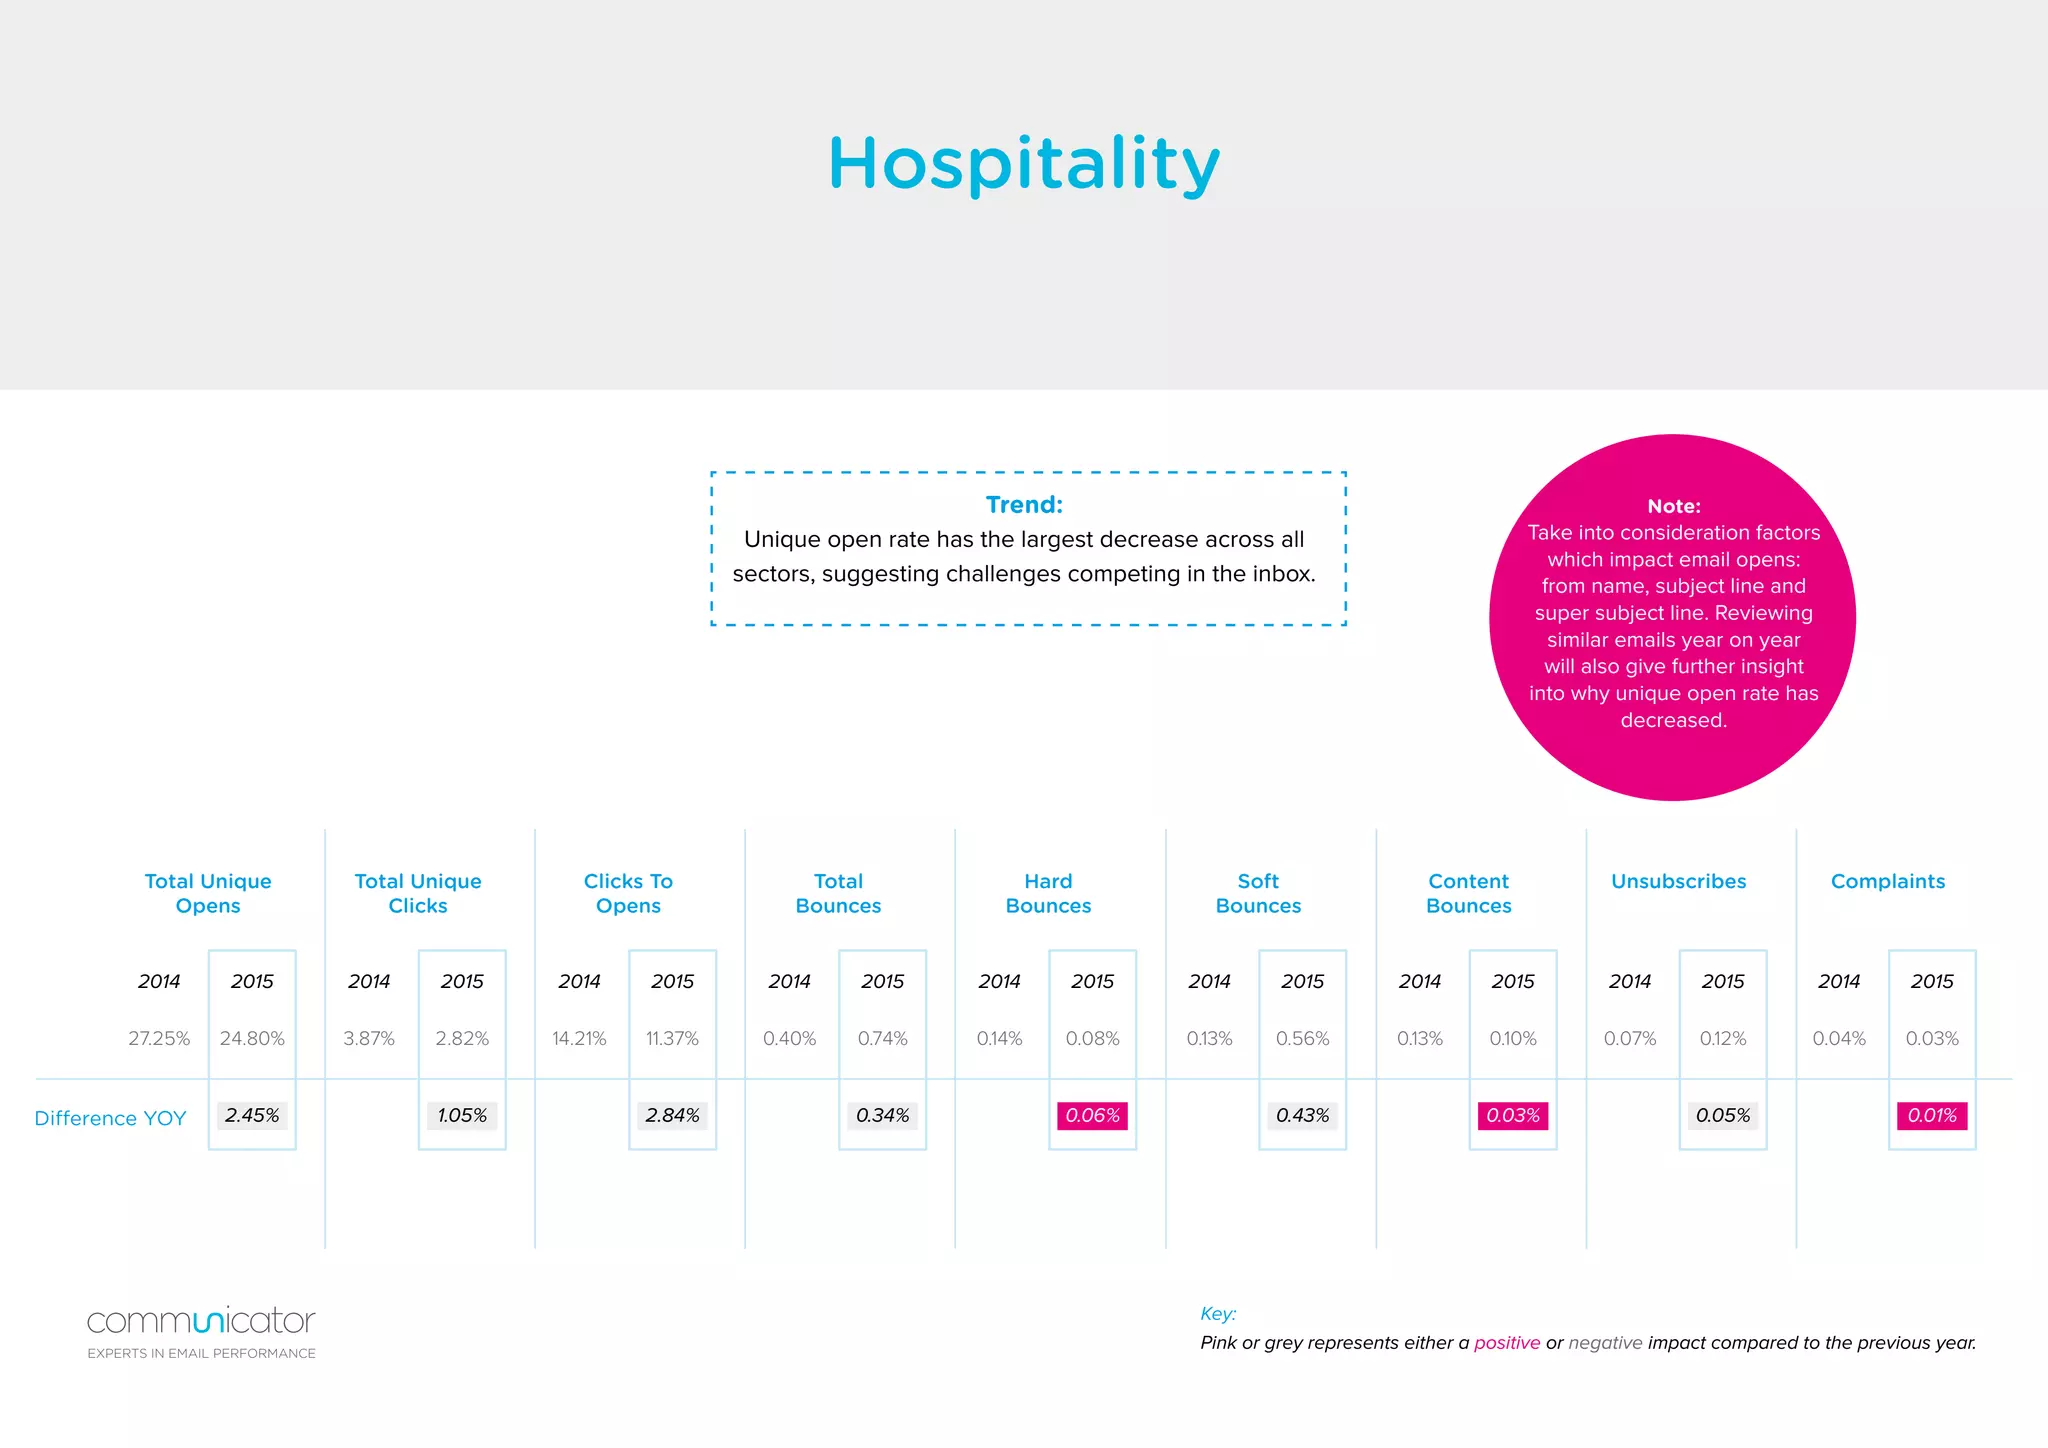
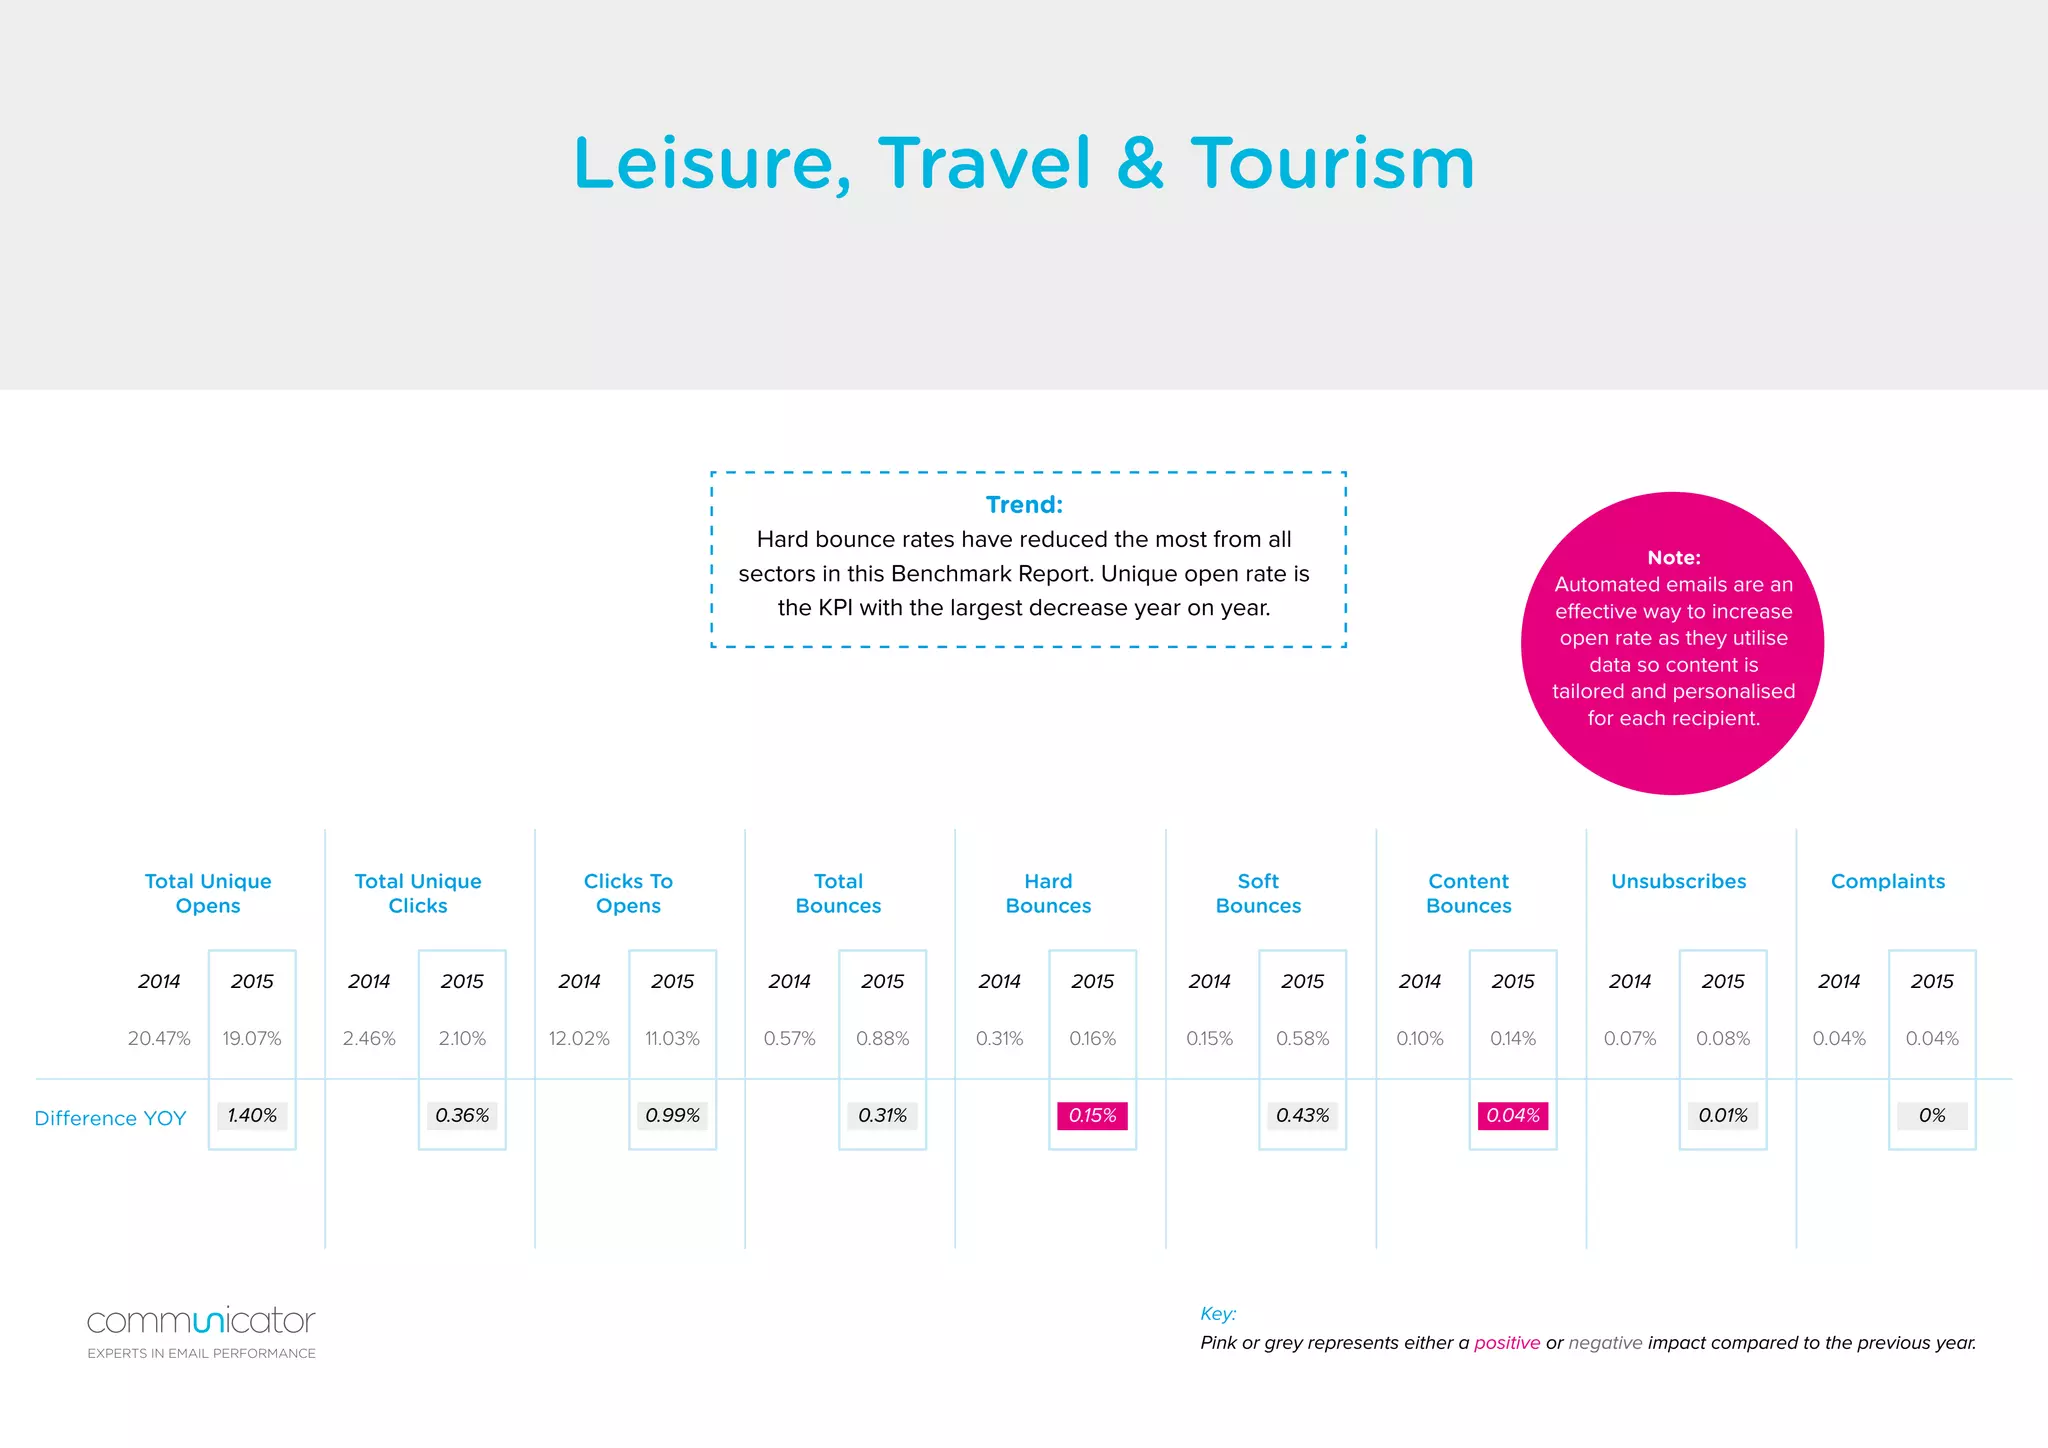
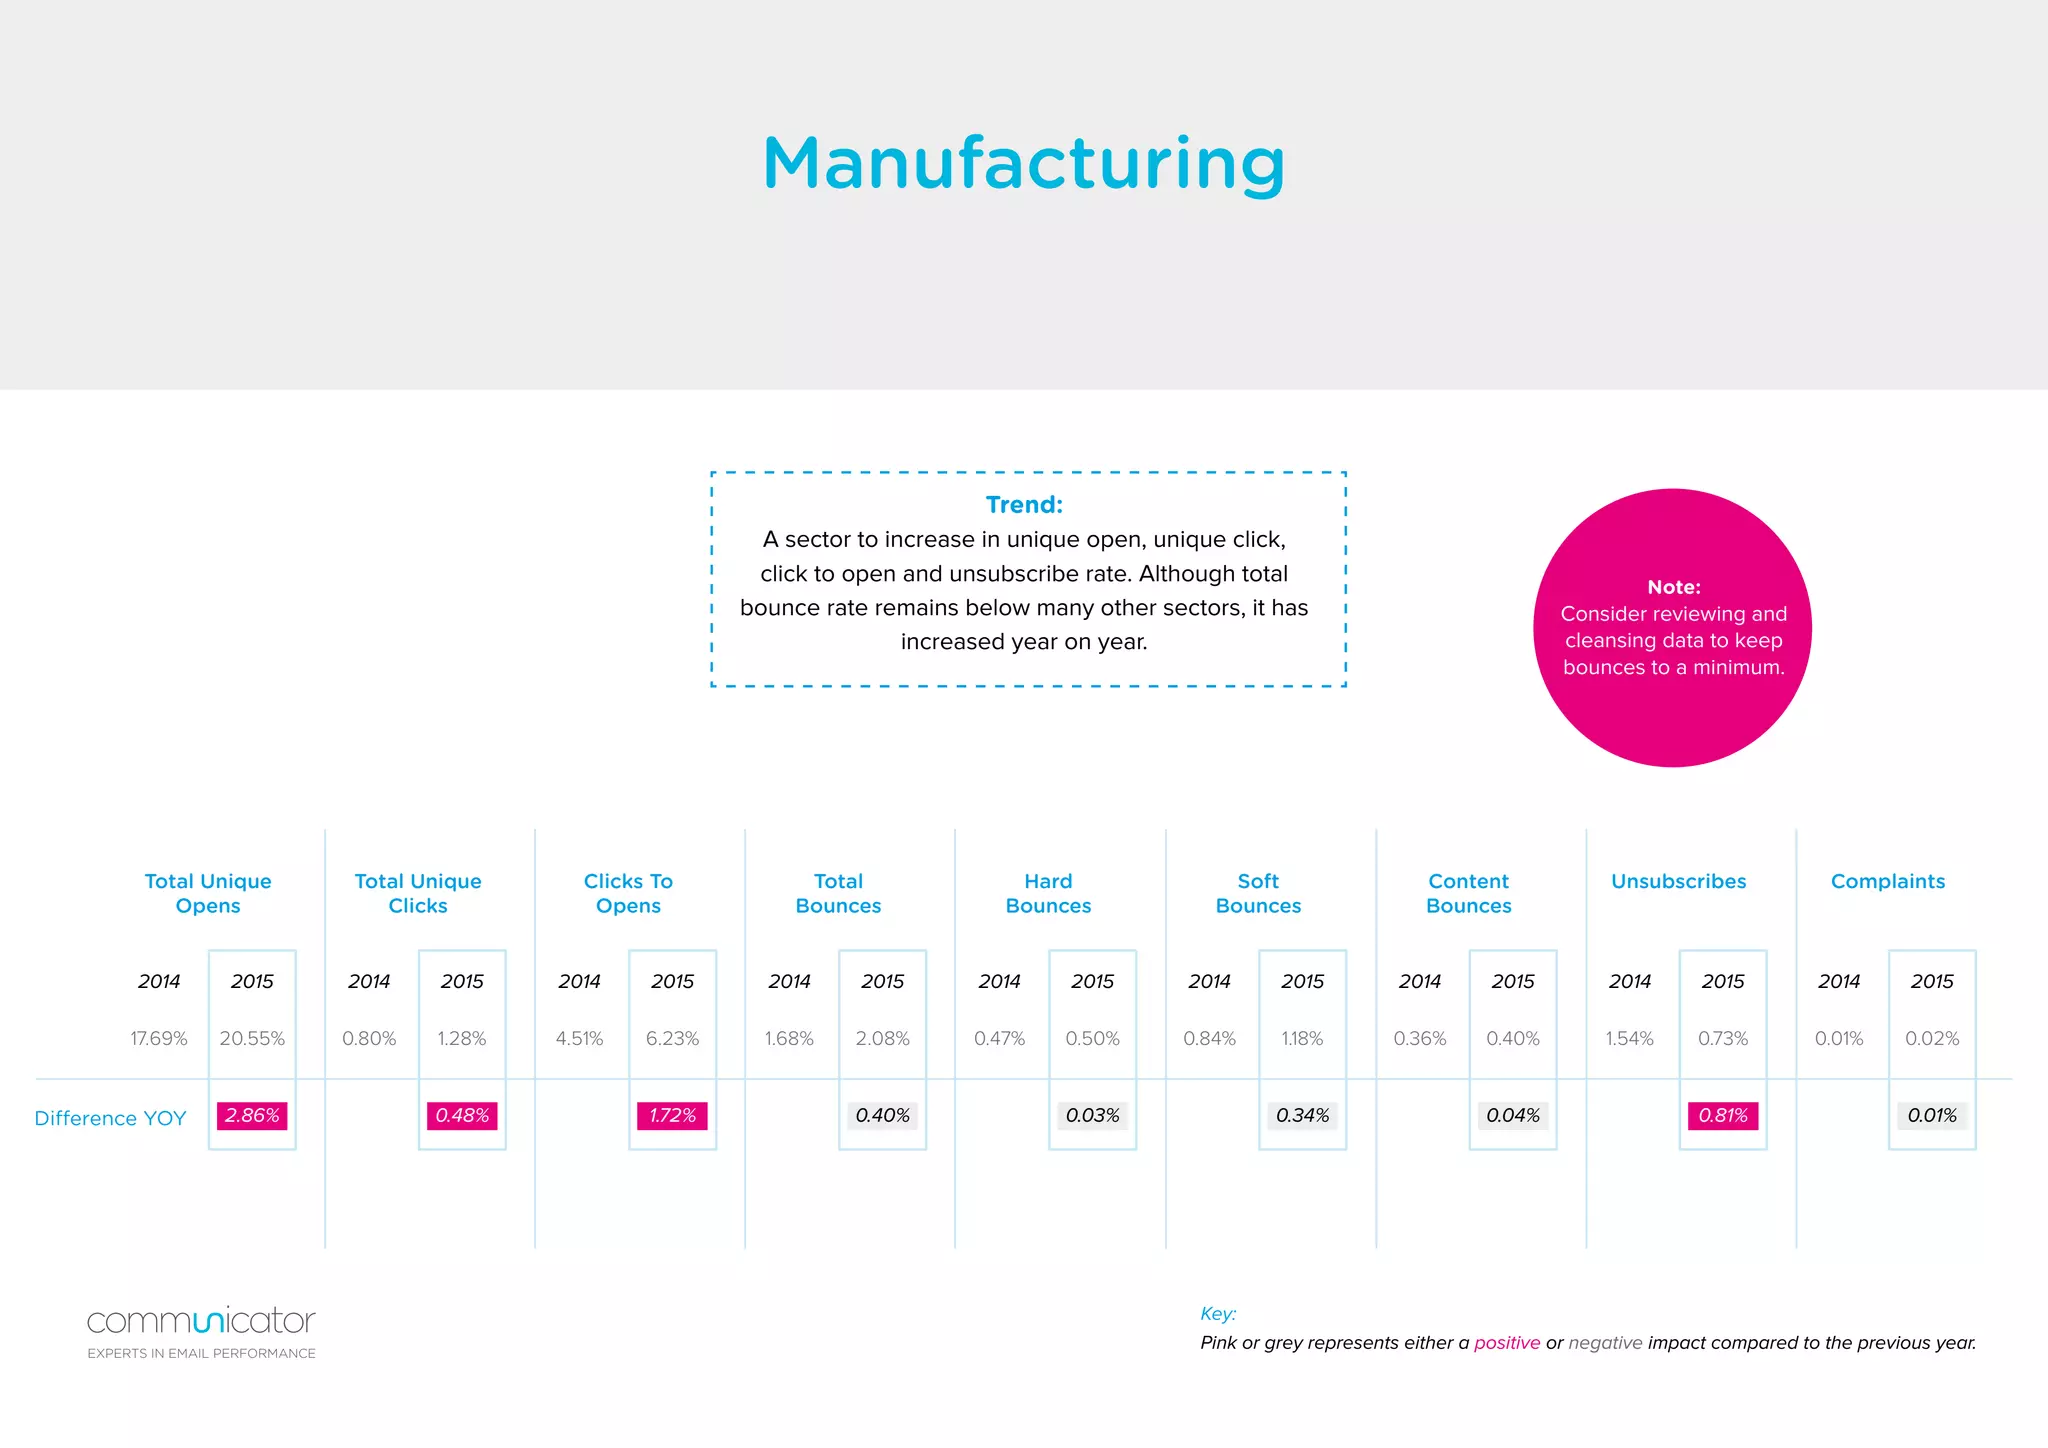


The 2016 Communicator Benchmark Report analyzes email performance data from 2015, highlighting key trends such as a 28% increase in email sends and the effectiveness of personalized and automated emails. The report emphasizes the importance of benchmarking to inform strategic planning and improve engagement, noting that personalization significantly boosts response rates. Various sector-specific insights reveal shifting engagement metrics, including challenges with inbox competition and the necessity for targeted content to enhance email effectiveness.


![[Webinar] Click, Open! The Era Of New Age Email Marketing](https://cdn.slidesharecdn.com/ss_thumbnails/wewebinarclickopentheeraofnew-ageemailmarketing-210423075651-thumbnail.jpg?width=640&height=640&fit=bounds)


