Download as PDF, PPTX


![0 6 7 - 8 9
DETRACTOR
Actively spreads negative word of mouth
PASSIVE
Neutral
PROMOTER
Actively refers friends
How likely are you to recommend [brand] to a friend or colleague?
10
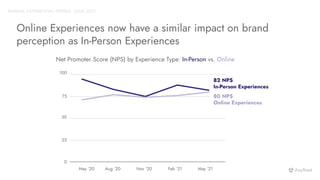
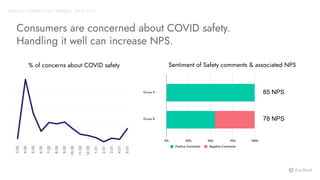
The Net Promoter Score is an index ranging from -100 to 100 that measures the willingness of
customers to recommend a company’s products or services to others. It is used for gauging the
consumers overall satisfaction with a company’s product or service and their loyalty to the brand.
What is Net Promoter Score (NPS)?](https://image.slidesharecdn.com/experientialtrends-july2021-210722181802/85/AnyRoad-Experiential-Trends-2021-10-320.jpg)


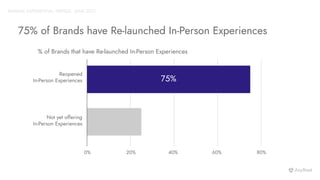
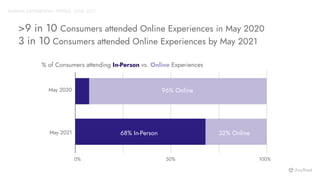


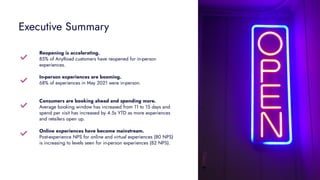
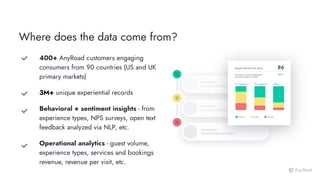
This document summarizes experiential trends in 2021 based on data from over 400 experience providers. It finds that 85% of experience providers have reopened for in-person experiences, with 68% of experiences in May being in-person. Consumers are booking experiences further in advance and spending more per visit. Online experiences have become mainstream, with similar customer satisfaction levels to in-person experiences. The document provides insights into operational metrics, consumer behaviors and sentiments, and concludes with key takeaways around reopening, upselling premium experiences, making online experiences impactful, and communicating COVID safety guidelines.


