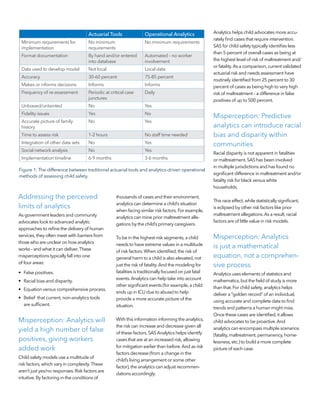
Analytics helps find better outcomes
Using SAS® for child safety to empower child advocates
As state and local government leaders and community advocates explore how they can use
predictive analytics to analyze data to improve child well-being outcomes,many questions
have surfaced.
For years,government youth services agencies across the United States have used actuarial
risk and need assessment tools.These technologies use predictive analytics to identify static
risk factors that indicate potential problems.Although these tools are a good starting point,
there are many problems associated with their implementation,such as required fidelity,
worker bias,amount of time to complete,etc.
A more operational analytics approach for risk assessment uses both static and dynamic risk
factors to calculate the risk of maltreatment.More timely,dynamic data increases accuracy,
improves scoring and limits worker bias.
The SAS approach for child safety allows government agencies to apply these operational
analytics.Figure 1 demonstrates the differences between the previous,actuarial approach
and an operational method for analytics.
Get a broader, more comprehensive
understandingofachild–andimprove
child well-being outcomes – by
accessing and integrating and ana­­
lyzingdata from all available sources.
Addressing the perceived
limits of analytics
As government leaders and community
advocates look to advanced analytic
approaches to refine the delivery of human
services,they often meet with barriers from
those who are unclear on how analytics
works – and what it can deliver.These
misperceptions typically fall into one
of four areas:
•	 False positives.
•	 Racial bias and disparity.
•	 Equation versus comprehensive process.
•	 Belief that current, non-analytics tools
are sufficient.
Misperception: Analytics will
yield a high number of false
positives, giving workers
added work
Child safety models use a multitude of
risk factors,which vary in complexity.These
aren’t just yes/no responses.Risk factors are
intuitive.By factoring in the conditions of
thousands of cases and their environment,
analytics can determine a child’s situation
when facing similar risk factors.For example,
analytics can mine prior maltreatment alle-
gations by the child’s primary caregivers.
To be in the highest-risk segments,a child
needs to have extreme values in a multitude
of risk factors.When identified,the risk of
general harm to a child is also elevated,not
just the risk of fatality.And the modeling for
fatalities is traditionally focused on just fatal
events.Analytics can help take into account
other significant events (for example,a child
ends up in ICU due to abuse) to help
provide a more accurate picture of the
situation.
With this information informing the analytics,
the risk can increase and decrease given all
of these factors.SAS Analytics helps identify
cases that are at an increased risk,allowing
for mitigation earlier than before.And as risk
factors decrease (from a change in the
child’s living arrangement or some other
factor),the analytics can adjust recommen-
dations accordingly.
Analytics helps child advocates more accu-
rately find cases that require intervention.
SAS for child safety typically identifies less
than 5 percent of overall cases as being at
the highest level of risk of maltreatment and/
or fatality.As a comparison,current validated
actuarial risk and needs assessment have
routinely identified from 25 percent to 30
percent of cases as being high to very high
risk of maltreatment – a difference in false
positives of up to 500 percent.
Misperception: Predictive
analytics can introduce racial
bias and disparity within
communities
Racial disparity is not apparent in fatalities
or maltreatment.SAS has been involved
in multiple jurisdictions and has found no
significant difference in maltreatment and/or
fatality risk for black versus white
households.
This race effect,while statistically significant,
is eclipsed by other risk factors like prior
maltreatment allegations.As a result,racial
factors are of little value in risk models.
Misperception: Analytics
is just a mathematical
equation, not a comprehen-
sive process
Analytics uses elements of statistics and
mathematics,but the field of study is more
than that.For child safety,analytics helps
deliver a “golden record” of an individual,
using accurate and complete data to find
trends and patterns a human might miss.
Once these cases are identified,it allows
child advocates to be proactive.And
analytics can encompass multiple scenarios
(fatality,maltreatment,permanency,home-
lessness,etc.) to build a more complete
picture of each case.
Actuarial Tools Operational Analytics
Minimum requirements for
implementation
No minimum
requirements
No minimum requirements
Format documentation By hand and/or entered
into database
Automated – no worker
involvement
Data used to develop model Not local Local data
Accuracy 30-60 percent 75-85 percent
Makes or informs decisions Informs Informs
Frequency of re-assessment Periodic at critical case
junctures
Daily
Unbiased/untainted No Yes
Fidelity issues Yes No
Accurate picture of family
history
No Yes
Time to assess risk 1-2 hours No staff time needed
Integration of other data sets No Yes
Social network analysis No Yes
Implementation timeline 6-9 months 3-6 months
Figure 1: The difference between traditional actuarial tools and analytics-driven operational
methods of assessing child safety.
Collections of risk factors determine the
level of risk,not individual facts or flags.
This eliminates the one-size-fits-all approach
to case response (e.g.,children under age
five are considered high-risk and require a
full investigation).Instead,a risk model can
apply a score based on a number of factors
to provide a more precise evaluation of each
case.A high risk score means there is multi-
tude of simultaneous risk factors present.
The score – simply put – brings this to the
attention of the case worker to help inform
decisions,coupled with professional
judgment.
Misperception: Current,
more static actuarial models
are sufficient
One of the key benefits of analytics is that it
can learn from the cases in the system and
use a host of factors to determine the
severity of each case.In fact,case workers
themselves are a form of analytic models
(biological,not mathematical).Unfortunately,
they can’t process more than a small set
of data about the cases they are working.
So using the judgment of case workers –
consensus decision making – will underper-
form more operational analytics due to:
•	 High case worker turnover rates.
•	 Limited information available to the
cases due to incorrect data (data quality
issues) or overwhelming amounts
of data.
•	 High variations in case worker experi-
ence and judgment.
•	 Case worker bias during the scoring
process when using actuarial methods.
•	 Case workers potentially manipulating
the scores to force certain actions like
removals.
Operational analytical models work across
the risk spectrum and can assist in screening
and triaging cases based on available data.
In addition,data can include information
from a multitude of agencies to better
inform the model and decisions,which
allows for more accurate risk assessments in
situations with limited report histories and
offers a consistent summary of the typical
risk observed for a child based on the data
available to the agency.
SAS and all other SAS Institute Inc. product or service names are registered trademarks or trademarks of SAS Institute Inc. in the USA and other countries.
® indicates USA registration. Other brand and product names are trademarks of their respective companies. Copyright © 2016, SAS Institute Inc.
All rights reserved. 108317_G28200.0516
To contact your local SAS office,please visit: sas.com/offices

Common Misperceptions

  • 1.
    Analytics helps findbetter outcomes Using SAS® for child safety to empower child advocates As state and local government leaders and community advocates explore how they can use predictive analytics to analyze data to improve child well-being outcomes,many questions have surfaced. For years,government youth services agencies across the United States have used actuarial risk and need assessment tools.These technologies use predictive analytics to identify static risk factors that indicate potential problems.Although these tools are a good starting point, there are many problems associated with their implementation,such as required fidelity, worker bias,amount of time to complete,etc. A more operational analytics approach for risk assessment uses both static and dynamic risk factors to calculate the risk of maltreatment.More timely,dynamic data increases accuracy, improves scoring and limits worker bias. The SAS approach for child safety allows government agencies to apply these operational analytics.Figure 1 demonstrates the differences between the previous,actuarial approach and an operational method for analytics. Get a broader, more comprehensive understandingofachild–andimprove child well-being outcomes – by accessing and integrating and ana­­ lyzingdata from all available sources.
  • 2.
    Addressing the perceived limitsof analytics As government leaders and community advocates look to advanced analytic approaches to refine the delivery of human services,they often meet with barriers from those who are unclear on how analytics works – and what it can deliver.These misperceptions typically fall into one of four areas: • False positives. • Racial bias and disparity. • Equation versus comprehensive process. • Belief that current, non-analytics tools are sufficient. Misperception: Analytics will yield a high number of false positives, giving workers added work Child safety models use a multitude of risk factors,which vary in complexity.These aren’t just yes/no responses.Risk factors are intuitive.By factoring in the conditions of thousands of cases and their environment, analytics can determine a child’s situation when facing similar risk factors.For example, analytics can mine prior maltreatment alle- gations by the child’s primary caregivers. To be in the highest-risk segments,a child needs to have extreme values in a multitude of risk factors.When identified,the risk of general harm to a child is also elevated,not just the risk of fatality.And the modeling for fatalities is traditionally focused on just fatal events.Analytics can help take into account other significant events (for example,a child ends up in ICU due to abuse) to help provide a more accurate picture of the situation. With this information informing the analytics, the risk can increase and decrease given all of these factors.SAS Analytics helps identify cases that are at an increased risk,allowing for mitigation earlier than before.And as risk factors decrease (from a change in the child’s living arrangement or some other factor),the analytics can adjust recommen- dations accordingly. Analytics helps child advocates more accu- rately find cases that require intervention. SAS for child safety typically identifies less than 5 percent of overall cases as being at the highest level of risk of maltreatment and/ or fatality.As a comparison,current validated actuarial risk and needs assessment have routinely identified from 25 percent to 30 percent of cases as being high to very high risk of maltreatment – a difference in false positives of up to 500 percent. Misperception: Predictive analytics can introduce racial bias and disparity within communities Racial disparity is not apparent in fatalities or maltreatment.SAS has been involved in multiple jurisdictions and has found no significant difference in maltreatment and/or fatality risk for black versus white households. This race effect,while statistically significant, is eclipsed by other risk factors like prior maltreatment allegations.As a result,racial factors are of little value in risk models. Misperception: Analytics is just a mathematical equation, not a comprehen- sive process Analytics uses elements of statistics and mathematics,but the field of study is more than that.For child safety,analytics helps deliver a “golden record” of an individual, using accurate and complete data to find trends and patterns a human might miss. Once these cases are identified,it allows child advocates to be proactive.And analytics can encompass multiple scenarios (fatality,maltreatment,permanency,home- lessness,etc.) to build a more complete picture of each case. Actuarial Tools Operational Analytics Minimum requirements for implementation No minimum requirements No minimum requirements Format documentation By hand and/or entered into database Automated – no worker involvement Data used to develop model Not local Local data Accuracy 30-60 percent 75-85 percent Makes or informs decisions Informs Informs Frequency of re-assessment Periodic at critical case junctures Daily Unbiased/untainted No Yes Fidelity issues Yes No Accurate picture of family history No Yes Time to assess risk 1-2 hours No staff time needed Integration of other data sets No Yes Social network analysis No Yes Implementation timeline 6-9 months 3-6 months Figure 1: The difference between traditional actuarial tools and analytics-driven operational methods of assessing child safety.
  • 3.
    Collections of riskfactors determine the level of risk,not individual facts or flags. This eliminates the one-size-fits-all approach to case response (e.g.,children under age five are considered high-risk and require a full investigation).Instead,a risk model can apply a score based on a number of factors to provide a more precise evaluation of each case.A high risk score means there is multi- tude of simultaneous risk factors present. The score – simply put – brings this to the attention of the case worker to help inform decisions,coupled with professional judgment. Misperception: Current, more static actuarial models are sufficient One of the key benefits of analytics is that it can learn from the cases in the system and use a host of factors to determine the severity of each case.In fact,case workers themselves are a form of analytic models (biological,not mathematical).Unfortunately, they can’t process more than a small set of data about the cases they are working. So using the judgment of case workers – consensus decision making – will underper- form more operational analytics due to: • High case worker turnover rates. • Limited information available to the cases due to incorrect data (data quality issues) or overwhelming amounts of data. • High variations in case worker experi- ence and judgment. • Case worker bias during the scoring process when using actuarial methods. • Case workers potentially manipulating the scores to force certain actions like removals. Operational analytical models work across the risk spectrum and can assist in screening and triaging cases based on available data. In addition,data can include information from a multitude of agencies to better inform the model and decisions,which allows for more accurate risk assessments in situations with limited report histories and offers a consistent summary of the typical risk observed for a child based on the data available to the agency.
  • 4.
    SAS and allother SAS Institute Inc. product or service names are registered trademarks or trademarks of SAS Institute Inc. in the USA and other countries. ® indicates USA registration. Other brand and product names are trademarks of their respective companies. Copyright © 2016, SAS Institute Inc. All rights reserved. 108317_G28200.0516 To contact your local SAS office,please visit: sas.com/offices