Medicaid Analytics eBook
•
1 like•76 views

Developed content and graphics internally to share with key prospects.

Recommended
Recommended
More Related Content
What's hot
What's hot (20)
Similar to Medicaid Analytics eBook
Similar to Medicaid Analytics eBook (20)
Recently uploaded
Recently uploaded (20)
Medicaid Analytics eBook
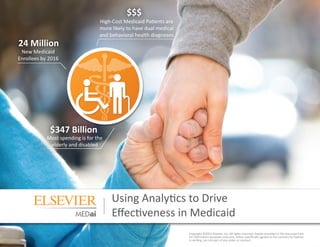
- 1. Using Analytics to Drive Effectiveness in Medicaid Copyright ©2012 Elsevier, Inc. All rights reserved. Details provided in this document are for information purposes only and, unless specifically agreed to the contrary by Elsevier in writing, are not part of any order or contract. New Medicaid Enrollees by 2016 Most spending is for the elderly and disabled High-Cost Medicaid Patients are more likely to have dual medical and behavioral health diagnoses 24 Million $$$ $347 Billion
- 2. Without advanced analytics, both state Medicaid agencies and Medicaid health plans will operate blind. 2 In the past two decades, Medicaid spending has grown by 450%. By 2020, Medicaid will cover nearly 100 million Americans, or more than 30% of the U.S. population. Medicaid expansion in the states will seriously exacerbate the influx of large numbers of new patients with existing, undertreated, undiagnosed and poorly managed conditions, as well as limited provider capacity, making efficient identification and stratification even more important. Without advanced analytics, both state Medicaid agencies and Medicaid health plans will operate blind. So, too, will physicians and other caregivers. As the U.S. health care system transitions from a pay-for-service model to pay-for-value through new arrangements including bundled payments and the Accountable Care Organization (ACO), health care organizations require advanced analytics solutions to track, analyze and report on quality and cost across every care setting. Introduction This eBook is designed to help Medicaid health care professionals be more effective in managing Medicaid beneficiaries and the providers who treat them. To do that, a practical perspective is explored on how analytics are being used to drive change in health care (generally) and, in turn, are driving organizational effectiveness in Medicaid Plans and Agencies, in light of the rapidly evolving health care landscape. It begins by providing a common understanding of health care analytics and ends with direction on how to evaluate your own organization and discover which opportunities will further its effectiveness in treating the Medicaid population. If you have not built the power of these high-value analytic assets into your clinical and financial programs, it is likely that your organization is not maximizing the insight that is available to drive effectiveness for your Medicaid population. How Organizations Are Using Analytics to Drive Effectiveness in Medicaid Quality of Care
- 3. With the increased interdependence and focus on sharing of risk fostered by health care reform, organizations that have strong data assets and make use of them effectively to drive change will have a very distinct competitive advantage. 3 Health care services are becoming more patient-centered and are rallying around themes of accountability, value and collaboration. Providers and Medicaid Health Plans are actively committing themselves to one another in an environment of cooperation and shared success. Together, they are changing their clinical and business processes to achieve results from positive patient outcomes and efficiency. It is important going forward that these organizations have a command of their analytic assets. But more importantly, what is not readily seen by outsiders is that they are embedding their analytic assets into these partnership programs rather than using them in an isolated manner. These activities demonstrate that shared analytic assets are increasing shared organizational success. See Figure 1 below: Analytics have been an active part of the health care industry since the 1990s when they were largely financially driven. Providers, health plans and government agencies have always accessed their analytic data assets to promote sound organizational processes and goals. How the analytics have been applied, and the amount of value that has been derived from their use has been up to each organization. Success or failure in driving value from analytic investments has also been up to the individual organization but varies widely across the nation. However, with the increased inter- dependence and focus on sharing of risk fostered by health care reform, organizations that have strong data assets and make use of them effectively to drive change will have a very distinct competitive advantage. A health care organization that drives success through predictive analytics is a much more desirable health care partner to the government that underwrites Medicaid programs. Medicaid Managed Care Plans, Programs & Analytics Provider Programs & Analytics Government Agencies & Analytics Program C Program C Program C Program C Program D Program D Program D Program D Program B Program B Program B Program B Program A Program A Program A Program A Providers Patient Payers Government Agencies
- 4. A key factor to remember is that the term “analytics” does not just refer to data but what you do with the data and how you change business processes to leverage it. 4 Defining the Term “Analytics” The term “analytics” is commonly used in health care, but there does not appear to be a single definition of what it truly means within health care organizations. And while we health care analytics experts use the term and are passionate about the topic as we do business, it is necessary to take pause and create clarity. At one end of the spectrum, some use the term generically when referring to reporting on data sets. At the other end of the spectrum, some use the term to refer to complex statistical predictions and data mining activities. Both can be correct. For the purpose of this text, and at the 50,000-foot level, health care analytics is a science (methodology) as well as a process. The analytics process/methodology involves accessing sets of raw data (often created from business and clinical transactions related to patient/provider encounters), and studying them to draw conclusions and gain insights that were unknown. These conclusions and insights are not inherently a part of the raw data. In other words, the transactional process that created the raw data was not specifically designed to support garnering conclusions or insights. A key factor to remember is that the term “analytics” does not just refer to data but what you do with the data and how you change business processes to leverage it. In health care, analytics frequently involve placing sets of financial and clinical rules into algorithms that are then built into analytic technologies. These technologies are able to process an organization’s raw business data to create new, value-added or enhanced data elements which are then made available for business or clinical use. Consider the following example of how an organization transforms large sets of raw, transactional data into high- value Predictive Analytics: A Technical Perspective 1 Highly detailed health care data (such as pharmacy, lab, clinical and claims information) are fed into a predictive modeling processing “engine.” The engine conducts a line-by-line review of the large volume of detailed data. The statistical, clinical and financial models of the engine work to study the data, aggregate and organize it. The engine then creates new “analytic” elements (e.g., Patient Risk Score, Underlying Risk Drivers, Clinical Measures, Forecasted Patient Cost, etc.) that are more useful to clinicians and business professionals than the highly detailed data could be in their raw state. These new, value-added data elements are then able to be placed adjacent to the raw data in the database and are made available for clinical and business use. 2 3 4 5 Organizations that make effective use of analytics are at an advantage because they have enhanced insights. However, an organization that has these high-value analytic assets does not achieve effectiveness just by having the analytic data. Organizations that enhance their raw data assets are more likely to be sophisticated in how they use analytics to guide human decisions or to drive fully-automated decisions. An organization that is highly competitive is one that transforms the analytics assets into business strategy and operational processes. This leads to a Practical Application perspective of analytics.
- 5. The key to gaining more effectiveness is having these advanced analytics populated in a way where they can be accessed and reported by clinicians and business professionals in the form of aggregate, query/drill-down, and ad-hoc and standard reports. 5 In health care, the individuals that create analytics are rarely the actual end users of the analytics. If a health care organization creates the analytics internally, it is frequently done by a technology department. It is much more common, however, for health care providers and payers to purchase vendor solutions that will provide pre-packaged analytics. In both instances, business users of analytic information tend to be removed from the technical nature that was discussed earlier in the Technical Perspective. Vendor analytic solutions are typically business intelligence systems that allow end users to analyze and report on the organization’s data as well as the value-added analytic data outputs. The user is less concerned about the technical nature of the analytics and algorithms and is more concerned with how to apply the information to business strategy or operations. For these individuals, the practical perspective of analytics is that they are value-added data elements that are made available within analysis and reporting systems, as shown below in Figure 2: Figure 2 illustrates a practical perspective on how predictive modeling is experienced by end users of analytic solutions. Note again that Predictive Modeling is shown as having a high degree of competitive advantage. Access and reporting are where analytics become linked to business process. A Practical Application Perspective Source: Image Adapted from Book “Competing on Analytics: The New Science of Winning” by Thomas H. Davenport and Jeanne G. Harris, page 7.
- 6. Predictive analytics provide a critical advantage by enabling organizations to have insights that help them to make the most informed decisions possible, given what can be “known” through today’s data. 6 How To Use Predictive Analytics To Gain More Effectiveness Predictive analytics are playing a critical role in helping both providers and health plans to ramp up their effectiveness, and become fortified to survive while the U.S. health care system transforms. This is particularly true for provider organizations that are treating Medicaid patients, taking on additional risk or participating in shared savings/incentive programs with the government, in addition to producing higher quality patient outcomes. Predictive analytics provide an edge to organizations by offering critical insights that help them to make the most informed decisions possible, given what can be “known” through today’s data. These organizations are very interested to know the: 1 Data assets must be made ready for use. Value must be able to be extracted from the data (Predictive Analytics). Medicaid organizations must be able to use analytic data to discover opportunities unique to their population. Medicaid organizations must then go further to define, deliver and measure programs that deliver results based upon use of the analytic data. 2 3 4 Types of services that will be required in the upcoming year Individuals who are not in compliance with recommended treatment protocols Individuals who have increased in risk over time Individuals who will have higher levels of engagement Individuals who are most likely to respond well to medical management outreach Projected financial risk for individuals as well as sub-populations (i.e., chronic care patients) Impact of risk on organizational performance against value-based contract expectations Recall from earlier discussions that the key to gaining effectiveness through Predictive Analytics is having these advanced analytics populated into analysis and reporting systems that the organization can use to support strategic, operational and clinical decisions. The most effective Medicaid organizations are highly successful in making use of analytic assets to gain a competitive edge in today’s health care market. While each of these organizations may have subtle differences in what they want to accomplish, they share commonalities in the data they use and how they apply it to drive success. They are using it strategically to define their vision, to define their place in the market and to drive revenue growth by increasing their performance against clinical and administrative targets. More specifically, the most effective health care organizations use analytics to manage risk while improving clinical quality, reducing the cost of care and increasing efficiency. Medicaid organizations that are positioning themselves to lead during this time of change are not only making use of their own administrative data assets, but they are also making use of data assets that can be obtained through new business relationships that focus on working together to provide quality, value-based care (e.g., Accountable Care) to patients. However, this is not a simple task. Organizations must be able to take the data and make a specific plan on how it will be applied to clinical and business activities in order to achieve results. What Makes the Most Effective Health Care Organizations Different?
- 7. Having an advanced ability to measure helps an organization to understand its current state of performance and set future goals. 7 Measure, Manage and Repeat In health care, analytic data elements are particularly good at measuring something in a way that your organization’s raw data would not be able to accomplish. And they allow these measures to be applied to a wide array of health care topics. For example, Predictive Analytics enable a health care provider organization to measure the clinical and financial risk of their overall patient population and also further measure the risk for sub-populations such as the Medicaid patients for a specific clinic, a specific provider or a specific disease like Diabetes. Having an advanced ability to measure clinical and financial risk helps an organization to understand its current state of performance and set future goals. More importantly, an organization that has an advanced ability to measure also has the ability to discover specific areas where Is there a standard method or road map for how top Medicaid organizations use analytics? How will analytic assets impact our business, both from a process and financial perspective? What clinical or administrative strategies use analytics? What do analytics have to do with the detailed steps of my operational activities? How will analytics strengthen my relationships with clinical and business partners? The Most Effective Organizations Use Analytics to Lever Change Many industry articles discuss the power of health care analytics and work to describe the basics (e.g., Health care Analytics 101). They accomplish a heightened awareness that having a strong analytics platform is no longer a nice-to-have asset, but that analytics are now an operational necessity. However, the challenge with many Analytics 101 articles is that they are not tactical – they stop short of educating executives and analysts on how to directly apply the analytics to improve business operations and achieve positive results. All too often these articles do not provide executives with the information necessary to conduct an assessment of their organization’s use of analytics, nor do they provide the information necessary to understand where competitive edge opportunities may exist. In order to leverage analytics in a competitive way in health care, some common questions may be asked to start moving in that direction. performance is lower than what is expected or what may be acceptable. For example, a Medicaid organization that uses Predictive Analytics has the ability to focus on the Asthmatic population and determine which patients have higher clinical and financial risk. The most effective Predictive Analytics will be able to break this risk down and show the underlying risk drivers (which may not be asthma) as well as forecast future issues for the population such as inpatient admissions, emergency room events, etc. Analytics are valuable because they measure and bring information to those who are caring for Medicaid patients – information that was not otherwise readily apparent. Once this intelligence is exposed, it can be discussed, and the organization can determine what actions, if any, need to be taken to manage performance and to re-measure and monitor over time.
- 8. Effective Medicaid organizations have learned how to use analytics to influence outcomes of beneficiaries, while also realizing savings and reducing risk. 8 The Illusion of Control in Health Management After the transition to using analytics in measuring performance is achieved, analytics go on to provide a more significant value in helping organizations conduct the “manage” portion of “measure, manage and repeat.” What does the provider organization that has a diabetic patient population with high financial and clinical risk do about managing that risk? What does the Medicaid organization that has a large asthmatic population with a high financial and clinical risk do about managing that risk? A significant challenge is that Medicaid organizations cannot control health outcomes – they can only influence them. Health issues can be treated once they have occurred, avoided through prevention or managed through lifestyle, etc. But at the end of the day, an organization cannot literally control an individual’s or population’s health outcome. Yet organizations must deal with repercussions (often financial) of health outcomes. In light of this challenge, effective Medicaid organizations have learned how to use analytics to influence outcomes of beneficiaries, while also realizing savings and reducing risk. These Medicaid organizations understand the art of influence and use the advanced insights that analytics provide to drive the “levers” that are available to them – the activities that they can do to incent, steer or guide change to occur. Examples of Levers that Medicaid Managed Care Plans Use to Influence Health Care Quality and Cost HEALTH AND WELLNESS Medicaid Managed Care Plans can offer health/wellness programs, disease management and health risk assessment programs to populations that may most benefit from participation or may be at higher levels of financial or clinical risk, and who are motivated to change. NETWORK DESIGNS AND NETWORK-FOCUSED PRODUCTS Medicaid Managed Care Plans can offer pre-defined provider networks and can work to actively improve the depth, breadth and quality of provider networks. Medicaid Managed Care Plans can also increase levels of clinical and financial accountability with providers related to the care they deliver. Additionally: • Predict, address, and track needs and costs of massive new eligible population. • Build capacity to manage costs of large number of dual diagnosis patients. • Anticipate, plan for pent-up demand. • Focus limited resources on highest cost, highest risk patients with greatest opportunities for quality improvement and cost savings. • Optimize value-based payments and appropriate risk adjustment. • Optimize performance on quality measures. • Operate effective complex case management programs. • Implement and manage provider payment reform in network. • Better compete for contracts for dual eligible population and Exchange population.
- 9. How do you curb high utilization of Emergency Room visits for non- emergent care? Clinical and business activity “levers” are more powerful when they are based upon analytic insights. 9 These clinical and business activity “levers” are more powerful when they are based upon analytic insights. Advanced insight guides strategy work by highlighting unseen opportunities while also illuminating underlying patterns that may need to be addressed. Advanced insight guides operational work by helping to hit the target more accurately, address challenges associated with underlying drivers and help to sophisticate an organization’s ability to prioritize. Examples of Levers that PROVIDER ORGANIZATIONS Use to Influence Health Care Quality and Cost RISK ARRANGEMENTS WITH MEDICAID MANAGED CARE PLANS AND STATES Providers can collaborate with both Medicaid Managed Care Plans and States through new risk-and-reward reimbursement arrangements that center on themes of Accountable Care and Value-based Care, as well as collaborate in partnership programs that work to increase clinical integration, quality and efficiency. PATIENT OUTCOMES Providers can improve the measurement and management of patient outcomes according to standards of care defined by the medical industry. Moreover, provider organizations can evaluate practice pattern variances in light of outcomes and work to bring consistency to system-wide care delivery. HEALTH AND WELLNESS Providers can collaborate with health/wellness programs, disease management and health risk assessment programs for patients. Using these programs to identify opportunities for intervention or stronger population management is key to influencing outcomes. CARE DELIVERY PROCESS Providers can improve the processes used to deliver care to gain efficiency, The level of quality and patient satisfaction and engagement. Since the Medicaid population has unique challenges in engagement, analytics provide steps toward a “road map” for caring for Medicaid beneficiaries and understanding their risk drivers as well as their level of motivation. COST MANAGEMENT Provider Practices can gain internal efficiencies by analyzing cost and utilization patterns and understanding established benchmarks, including how they measure against them. Using these insights to change care delivery is key to becoming more competitive. Examples of Levers that State Medicaid Agencies Use to Influence Health Care Quality and Cost MANAGING POPULATIONS – HEALTH AND WELLNESS Predicting, addressing and tracking needs and costs of massive new eligible Medicaid populations, while focusing limited resources on highest cost, highest risk patients with greatest opportunities for quality improvement and cost savings, and who are motivated to change. Patient- centered medical home programs, case management programs round out the use of analytics to be a more effective State Medicaid agency. NETWORK DESIGNS AND NETWORK-FOCUSED PRODUCTS Integrated health plans for dual eligibles – implemen- tation, risk adjustment, performance management are all ways that designs for network management is addressed. Additionally, managing and maximizing shared shavings with Medicare is another way that network management is more effective with analytics.
- 10. 10 There is a traditional advantage in making strong use of analytics to drive your organization’s internal performance. But in the rapidly evolving health care market, it has become clear that a Medicaid organization’s success is increasingly dependent on the ability to become a more desirable clinical and business partner by sharing the power of analytic assets and using them in key areas to drive improvements and lower costs. Health care reform is fostering new levels of cooperation and is increasing the shared financial risk between health care providers, Medicaid plans and States. Organizations that own analytic data assets and go the distance to actively share these assets through cooperative programs will achieve higher levels of effectiveness than those that do not use information as strategically. As your organization creates a strategy for success in this environment, keep in mind that analytic assets are escalating in value. Market leading health care organizations have analytics represented on their strategic road maps – directly (and most importantly) as key drivers of operational programs. They have them, and are building them into how they do business. Key Considerations We invite you to actively investigate your own health care organization by considering the following method: 1 2 3 4 Look to see if the data that guides your organization’s strategies is maximized – meaning that it relies heavily on the power of advanced health care analytics (including predictive analytics) rather than relying solely on aggregations of raw operational data. See if your operational programs (Patient Health Improvement, Cost/Risk Management, Efficiency, Quality, Performance Management, etc.) are built using advanced analytics that are available to opti- mize each program for success. Spend some time scratching beneath the surface of your operational business programs and find out exactly which analytic data elements are being utilized. If analytics are not driving your programs, it is a red flag that your organization is not using the insight that is available to drive your competitive edge. Compare the analytic assets used in your opera- tional programs to industry best practices as well as what market leaders use to drive their programs (examples noted earlier). If your programs are not built with the depth and breadth of market-leading analytics, it is an indicator that your organization has opportunities to further its competitive edge. The appendix that follows is designed to support your investigation by sharing our industry expertise. In these pages, we highlight the types of programs that you may wish to evaluate – programs that are likely operating across various departments within your organization. More importantly, this appendix will point out the types of analytics that market- leading Medicaid organizations are using within their programs along with a description of what each analytic provides. From our unique vantage point, we can see best practices and market-changing activities, and our goal is to share our knowl- edge so that your organization can benefit from what we see. Leading Medicaid organizations have a command of the levers that are available to them, and they have a command of their analytic assets. They achieve success by building advanced analytics into their clinical and business programs, which operate to lever the desired outcome. Analytics help define a program’s strategy and are also used within operational steps of programs. While the industry uses a wide array of programs, they generally fall into five categories. Within each of these five categories, there are a number of key analytic assets that are being used to drive their success. Analytics help define a program’s strategy and are used to achieve success in Medicaid clinical and business (financial) programs.
- 11. 11 Primary Focus The primary focus of these programs is to improve the health of patients/beneficiaries. With these programs the organization is saying, “I want to improve the health of my patient/beneficiary population because healthy people have a higher quality of life and cost Medicaid plans (and States) less.” #1 PATIENT HEALTH IMPROVEMENT PROGRAMS EPISODES OF CARE Provides as complete a picture as possible of a disease or medical condition for a single patient/beneficiary or a population and includes inpatient, outpatient, professional and pharmacy services. Episodes of Care are frequently used to analyze the cost patterns, service patterns or provider practice patterns underneath specific diseases or medical conditions, and are excellent at supporting the analysis needed for patient health improvement programs. RISK DRIVERS Describes the underlying risk factor(s) that drove the patient/ beneficiary’s risk forecast. Health improvement programs can use Risk Driver information to provide additional insights to consider when planning resources to include in health improvement programs. The risk drivers also provide insights to what is driving the risk, which may be different than “primary” diagnosis. FORECASTED RISK INDEX Provides an index number for a patient/beneficiary that describes the relative risk the patient/beneficiary has (for utilizing services and incurring cost) when compared to the rest of the Medicaid population. Risk indices are frequently used to stratify patients/beneficiaries in patient health improvement programs. This takes into account risks associated with dual diagnoses – medical diagnoses combined with mental health diagnoses (e.g., depression, schizophrenia, substance abuse, etc.) DISEASE MANAGEMENT Targets specific diseases or medical conditions, typically chronic diseases such as Diabetes, Asthma, Hypertension, COPD, Heart Failure, etc. PREVENTIVE CARE Focuses on making sure people are getting the routine medical care necessary to proactively manage/monitor health, which leads to the avoidance of degrading health and resulting costs. WELLNESS Ensures maintenance of healthy lifestyles, exercise and eating habits Examples of Patient Health Improvement Programs Examples of Analytics Used in Patient Health Improvement Programs APPENDIX: How to Apply Predictive Analytics to Clinical and Business Processes
- 12. 12 FORECASTED EMERGENCY ROOM (ER) VISITS Forecasts the number of ER visits a patient/beneficiary will have in the next 12 months. This forecast information provides insight into which patients/ beneficiaries may have need for program resources that work to eliminate or reduce the need for ER services. In a Medicaid population, this is an especially useful insight since some Medicaid beneficiaries tend to use the ER for primary care services. Targeting not only ER “high flyers” but also those predicted to use the ER more frequently will result in a more effectively managed Medicaid population. FORECASTED INPATIENT DAYS Forecasts the number of days that a patient/beneficiary will have in an inpatient facility in the next 12 months. This forecast information provides insight into which patients/beneficiaries may have need for program resources that work to eliminate an inpatient admission, reduce the length of stay or reduce the intensity of inpatient services. APPENDIX: How to Apply Predictive Analytics to Clinical and Business Processes #1 cont’d. PATIENT HEALTH IMPROVEMENT PROGRAMS RISK CATEGORY Provides an easy-to-use categorization of the level of risk for patients/beneficiaries (e.g., 1 = Well, 2 = Low, 3 = Medium, 4 = High Risk and 5 = Catastrophic). Risk categories help to prioritize lists of patients/beneficiaries within a patient health improvement program and can also be used to highlight sub-populations that may have differing needs for program resources.
- 13. 13 GAPS IN CARE Flags patients/beneficiaries who are non-compliant with evidence-based guidelines of care – guidelines that have been created by the medical community that describe quality of care requirements for specific diseases, medical conditions or preventive age/gender demographics. Gaps in Care are excellent for use in patient health improvement programs because they provide specific information about the treatment protocols the individual has not received. By closing these gaps, the beneficiaries have a better chance to maintain optimal health and avoid health decline, and their resulting costs. ACUTE IMPACT SCORE Provides a score (0-100) that forecasts the patient/ beneficiary’s propensity for acute utilization to be impactable. Patient health improvement programs can use this analytic to channel resources to individuals that have a higher potential for being medically managed to reduce their utilization of inpatient and ER services and the related cost. MOVER MEMBERS Indicates the patient/beneficiary has increased or decreased in risk since the last time that risk was measured. Patient health improvement programs can use this to channel program resources to individuals increasing in risk, and see where program resources may intercede and provide support. Patient health programs can identify individuals who are decreasing in risk, which may assist in modifying the type or intensity of resources for those individuals. CHRONIC IMPACT SCORE Provides a score (0-100) that forecasts the patient/beneficiary’s propensity for chronic Gaps in Care to be impactable. Patient health improvement programs can use this analytic to channel resources to individuals that have a higher potential for increasing their compliance with recommended treatment protocols. MOTIVATION RANK Provides a score (0-100) that forecasts the patient/ beneficiary’s level of motivation to engage with physicians and self-manage. Patient health improvement programs can use this analytic to channel resources to individuals that have a higher likelihood to engage with the care delivery system and comply with treatment programs. APPENDIX: How to Apply Predictive Analytics to Clinical and Business Processes #1 cont’d. PATIENT HEALTH IMPROVEMENT PROGRAMS
- 14. 14 Primary Focus The primary focus of these programs is to manage the overall cost and the financial risk associated with providing health care servicestopatients/beneficiaries.Withtheseprograms,theorganizationissaying“Iwanttomanagefinancialimpactthatproviding these services has on my organization’s budget as well as manage the financial risk associated with my organization’s survival.” #2 COST/RISK MANAGEMENT PROGRAMS NETWORK UTILIZATION/LEAKAGE Channels patients to specific health care providers within a desired network ER UTILIZATION Ensures that the ER is used only for emergency conditions, delivering care efficiently within the ER; motivating the beneficiaries to use PCPs, internal medicine and primary clinics instead of ERs for primary care. THE IMPACT OF CODING Focuses on the impact of coding on reimbursement and organization performance CASE MANAGEMENT Programs that focus on managing complex and/or costly medical cases through nurse Case/Care Managers, Nurse Practitioners and affiliated care providers. These programs focus on co-morbid beneficiaries, including dual diagnosis beneficiaries and their unique needs for medical and mental health care. UTILIZATION MANAGEMENT Programs that focus on specific utilization patterns of concern, such as high-cost diagnostic imaging services, knee replacement services, gastric bypass services, etc Examples of Cost/Risk Management Programs Examples of Analytics Used in Cost/Risk Management Programs EPISODES OF CARE Provides as complete a picture as possible of a disease or medical condition for a single patient/beneficiary or a population and includes inpatient, outpatient, professional and pharmacy services. Can be used to illustrate cost, service and provider practice patterns and are an excellent tool for analyzing potential savings opportunities. RISK DRIVERS Describes the underlying factor(s) that drove the patient/ beneficiary’s risk forecast. This may or may not be the same as primary diagnosis. Cost/risk management programs study underlying risk drivers to understand a specific population and compare risk drivers for sub- populations of interest. FORECASTED RISK INDEX An index number for a patient/beneficiary that describes relative risk (for utilizing services and incurring cost) compared to the population. Indices for groups can be shown at an aggregate level. FORECASTED DRUG (RX) COST Forecasts a patient/beneficiary’s cost for pharmacy services for the next 12 months based on previous 12 months’ data. Cost/risk management programs can use this to inform program activities that target pharmacy costs or utilization of pharmacy services for specific populations. MOVERS Indicates the patient/beneficiary has increased or decreased in risk since the last time that risk was measured. Cost/risk management programs can use this analytic to quickly identify shifts in risk for the Medicaid plan (or State). FORECASTED MEDICAL COST Forecasts a patient/beneficiary’s cost for medical services for the next 12 months, based on the previous 12 months’ data. Cost/risk management programs can use this to inform program activities that target medical cost or utilization of medical services for specific populations. APPENDIX: How to Apply Predictive Analytics to Clinical and Business Processes
- 15. 15 Primary Focus The primary focus of these programs is to identify and fix inefficiencies associated with delivering care. With these programs the organization is saying “I want to drive more efficiency into the care that is provided so that my patients/beneficiaries receive the right services, at the right time, in the optimal environment and with the most efficient use of financial resources.” #3 EFFICIENT HEALTH CARE RESOURCE CONSUMPTION PROGRAMS PROVIDER PERFORMANCE Analyzes provider practice patterns to discover opportunities to increase quality, to become more cost effective or to manage performance compared to value-based contract targets. PATIENT-CENTERED CARE/MEDICAL HOME Focuses on medical management and rewarding quality patient-centered care, ensuring that dual diagnoses and disabled populations get the specific care that they need, while also controlling costs effectively. ACCESS TO CARE Ensures that patients/beneficiaries have adequate access to care based upon geography, service type, diseases/medical conditions, etc. For the disabled Med- icaid population, this may mean designing services that are tailored to assist this population in receiving appropriate and timely care, and preventative services. NETWORK COVERAGE Ensures that provider networks contain a mix of provider types and service offerings that fulfill the needs of the patient/beneficiary population. Examples of Efficient Health Care Resource Consumption Programs EPISODES OF CARE Provides as complete a picture as possible of a medical condition for a single patient/beneficiary or a population and includes inpatient, outpatient, professional or pharmacy services. Frequently, episodes are used to analyze service or provider practice patterns for specific medical conditions. They are often used to identify variation from expected norms and support further drilling to discover potential opportunities to gain efficiency. FORECASTED RISK INDEX An index number for a patient/beneficiary that describes relative risk (for utilizing services and incurring cost) compared to the population. A higher risk index suggests that the patient/beneficiary is forecasted to have a higher utilization of future services, and may benefit from program intervention. ACUTE IMPACT SCORE A score (0-100) that forecasts the patient/beneficiary’s propensity for acute utilization to be impactable. Efficiency programs can use this analytic to identify patients/beneficiaries with a higher potential for being medically managed to reduce their utilization of inpatient and ER services. MOTIVATION RANK A score (0-100) that forecasts the patient/ beneficiary’s level of motivation to engage with physicians and self-manage. Efficiency programs can use this analytic to identify patients/ beneficiaries that have a higher likelihood to engage with the care delivery system and comply with efficiencies that are built into treatment programs for their disease or medical condition. Examples of Analytics Used in Efficient Health Care Resource Consumption Programs APPENDIX: How to Apply Predictive Analytics to Clinical and Business Processes
- 16. 16 Primary Focus To identify and improve known quality issues that are high profile targets within the health care system. With these programs the organization is saying “I want to ensure that I’m doing all that I can to address these important topics for my beneficiaries.” Examples include reducing re-admissions, increasing patient-centeredness, medication management programs, etc. #4 QUALITY MANAGEMENT PROGRAMS RE-ADMISSIONS In the Medicaid population, readmissions are often 50-150% higher in the dual diagnoses population. Focuses on patients/beneficiaries who are readmitted to an inpatient facility after having a previous discharge (for the same or any condition). By intervening with these beneficiaries, there is documented proof that compliance to medications and avoidance of readmission is improved. DISEASE MANAGEMENT Focuses on specific diseases or medical conditions, typically chronic diseases such as Diabetes, Asthma, Hypertension, COPD, Heart Failure, etc. Additionally, these programs can also target Mental Health intervention programs, particularly for co-morbid Medical/Mental Health dual diagnoses beneficiaries. PATIENT-CENTERED CARE/MEDICAL HOME Focuses on programs that focus on medical management and rewarding quality patient-centered care, increasing collaboration among the providers who care for Medicaid beneficiaries. MEDICATION MANAGEMENT Ensuresthatpatients/beneficiariesarecomplyingwiththeirmedicationregimenand manages the complications of drug interactions if they are on more than one drug. Additionally targets those beneficiaries who are identified through the analytics to have abusive patterns of drug use (e.g., obtaining multiple prescriptions of narcotics from more than one physician, obtaining narcotics from multiple pharmacies, obtaining narcotic prescriptions that conflict with one another, etc.) Examples of Quality Management Programs GAPS IN CARE Flags patients/beneficiaries who are non-compliant with evidence-based guidelines of care – guidelines created by the medical community that describe the quality of care requirements for specific diseases, medical conditions or preventive age/gender demographics. Gaps in Care are excellent for use in quality improvement programs because they provide specific information about the treatment protocols the individual has not received. Closing these gaps improves quality. Looking at providers who have high populations with gaps in care (performance quality), as well as specific beneficiaries who have gaps in care (quality of health), are ways to close the quality gap and improve care as well as cost. Examples of Analytics Used in Quality Management Programs APPENDIX: How to Apply Predictive Analytics to Clinical and Business Processes FORECASTED RISK Ensures that PCMHs and/or Care Managers can be very effective in managing beneficiaries and enabling appropriate stratification for interventions, referrals to Disease Management programs, etc.
- 17. 17 #4 cont’d. QUALITY MANAGEMENT PROGRAMS CHRONIC IMPACT SCORE Analytics that provide a score (0-100) which forecasts the patient/beneficiary’s propensity for chronic Gaps in Care to be impactable. Quality management programs can use this to channel resources to individuals who have higher potential for increasing compliance with recommended treatment protocols, resulting in healthier Medicaid populations. EPISODES OF CARE Provides as complete a picture as possible of a disease or medical condition for a single patient/beneficiary or a population and includes inpatient, outpatient, professional and pharmacy services. Episodes of Care are frequently used to analyze service patterns or provider practice patterns underneath specific diseases or medical conditions and are excellent at supporting the analysis needed for quality improvement programs. MOTIVATION RANK A score (0-100) that forecasts the patient/beneficiary’s level of motivation to engage with physicians and self-manage. Quality management programs can use this analytic to channel resources to individuals with a higher likelihood to engage with the care delivery system and comply with treatment programs. Conversely, it enables stratification of those beneficia- ries who need the maximum amount of “high touch” to achieve effectiveness. ACUTE IMPACT SCORE A score (0-100) that forecasts the patient/beneficiary’s propensity for acute utilization to be impactable. Quality management programs can use this to channel resources to individuals with higher potential to proactively manage beneficiaries, resulting in fewer hospitalizations and ER visits, thus reducing costs. APPENDIX: How to Apply Predictive Analytics to Clinical and Business Processes
- 18. Primary Focus The primary focus of these programs is to demonstrate an organization’s performance and improvement. With these programs, the organization is saying “I want to measure performance, identify opportunities for improvement, implement operational programs to address the opportunities and then demonstrate improvement.” #5 PERFORMANCE MANAGEMENT PROGRAMS ORGANIZATIONAL PERFORMANCE Focuses on improving an organization’s performance measures of quality, cost, patient/beneficiary satisfaction, engagement, etc. PROVIDER PERFORMANCE Analyzes the practice patterns of individual physicians or facilities to discover opportunities to increase quality, to become more cost effective or to manage performance compared to value-based targets Examples of Performance Management Programs Examples of Analytics Used in Performance Management Programs GAPS IN CARE Flagspatients/beneficiariesthatarenon-compliantwithevidence-basedguidelines of care – guidelines created by the medical community that describe the quality of care requirements for specific diseases, medical conditions or preventive age/ gender demographics. Gaps in Care are an artifact of the quality measurement process, which is specifically designed to measure performance against care standards. FORECASTED RISK INDEX An index number for a patient/beneficiary that describes the relative risk the patient/beneficiary has (for utilizing services and incurring cost) when compared to the population. The risk burden of a Medicaid population is an important consideration in performance improvement programs, and it is a standard component built into the equations that calculate performance. EPISODES OF CARE Provides as complete a picture as possible of a disease or medical condition for a single patient/beneficiary or a population and includes inpatient, outpatient, professional and pharmacy services. Episodes of Care are frequently used to discover performance improvement opportunities related to cost of services, efficiency in service utilization or potential quality concerns. APPENDIX: How to Apply Predictive Analytics to Clinical and Business Processes 18
- 19. 4901 Vineland Road Suite 450 Orlando, FL 32811 866.422.5156 www.medai.com Copyright ©2012 Elsevier, Inc. All rights reserved. Details provided in this document are for information purposes only and, unless specifically agreed to the contrary by Elsevier in writing, are not part of any order or contract.