More Related Content
Similar to Comic-Con 2011 Fan Breakdown Infographic
Similar to Comic-Con 2011 Fan Breakdown Infographic (16)
Comic-Con 2011 Fan Breakdown Infographic
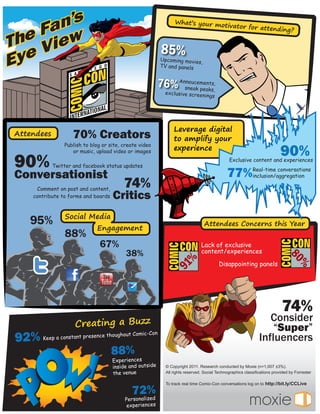
- 1. What’s your m
otivator for at
tending?
85%
Upcoming movies,
TV and panels
76% Ansneakements,
nouc
peaks,
exclusive screen
ings
Leverage digital
Attendees 70% Creators to amplify your
90%
Publish to blog or site, create video
or music, upload video or images
experience
90% Twitter and facebook status updates
Exclusive content and experiences
Conversationist 77% Real-time conversations
inclusion/aggregation
Comment on post and content,
74%
contribute to forms and boards Critics
Social Media
95% Attendees Concerns this Year
Engagement
88%
67% Lack of exclusive
38% content/experiences
80
%
Disappointing panels
91
%
74%
Consider
Creating a Buzz “Super”
92% Keep a constant presen
ce thoughout Comic-Con
Influencers
88%
Experiences
inside and outside © Copyright 2011. Research conducted by Moxie (n=1,007 ±3%).
the venue All rights reserved. Social Technographics classifications provided by Forrester
To track real time Comic-Con conversations log on to http://bit.ly/CCLive
72%
Personalized
experiences