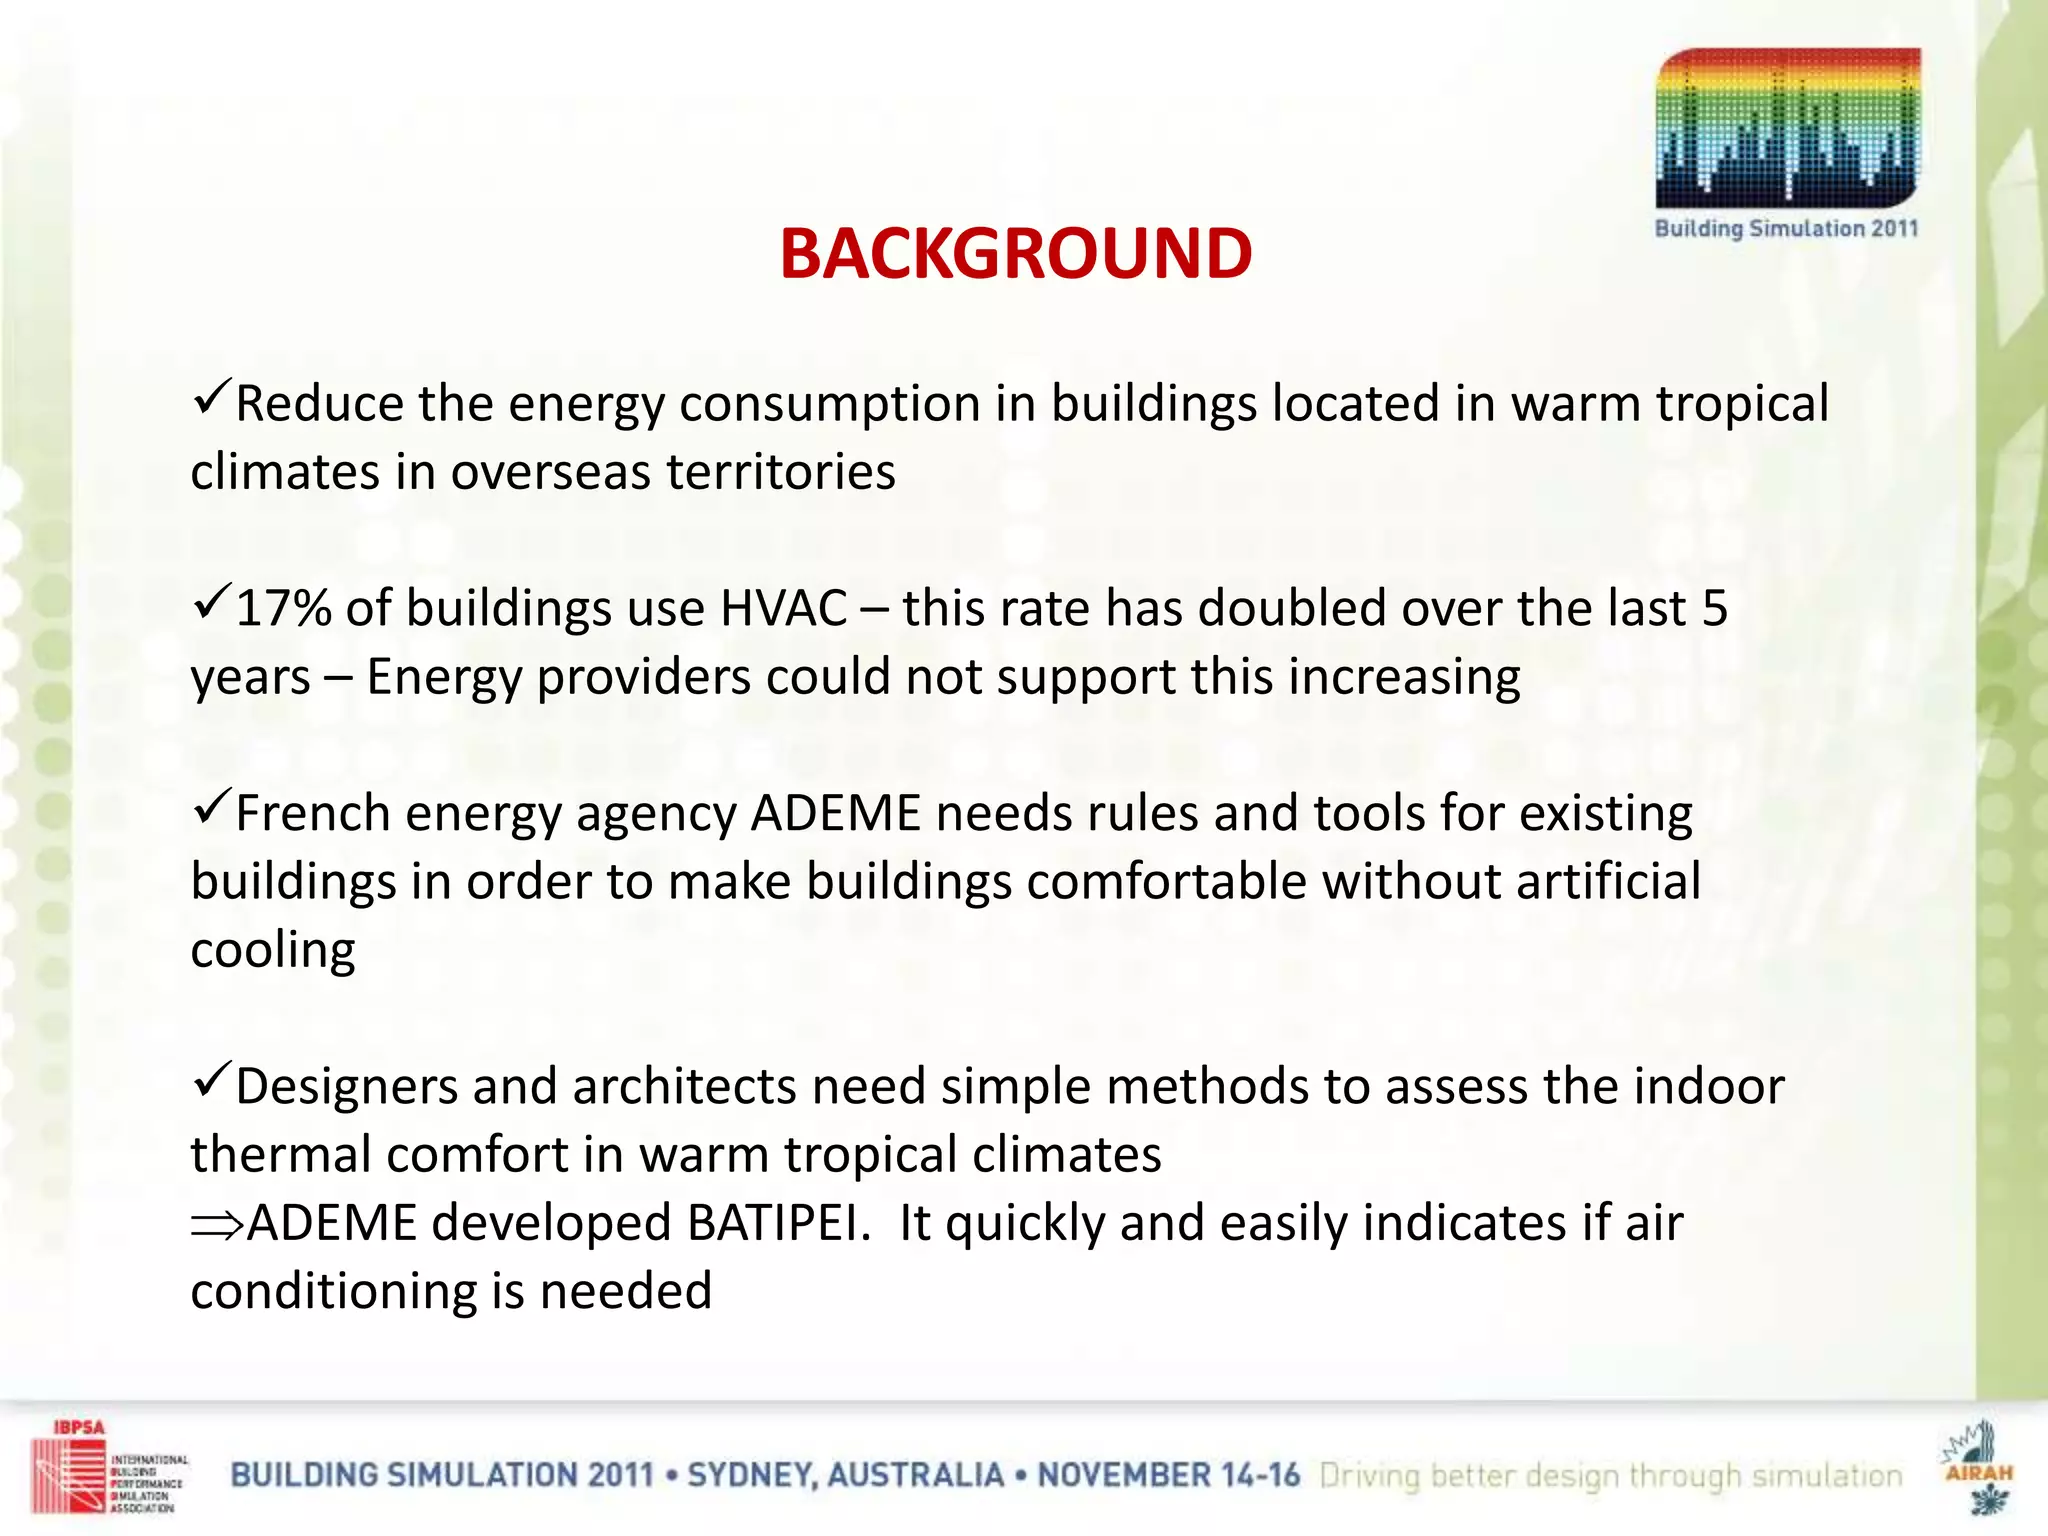
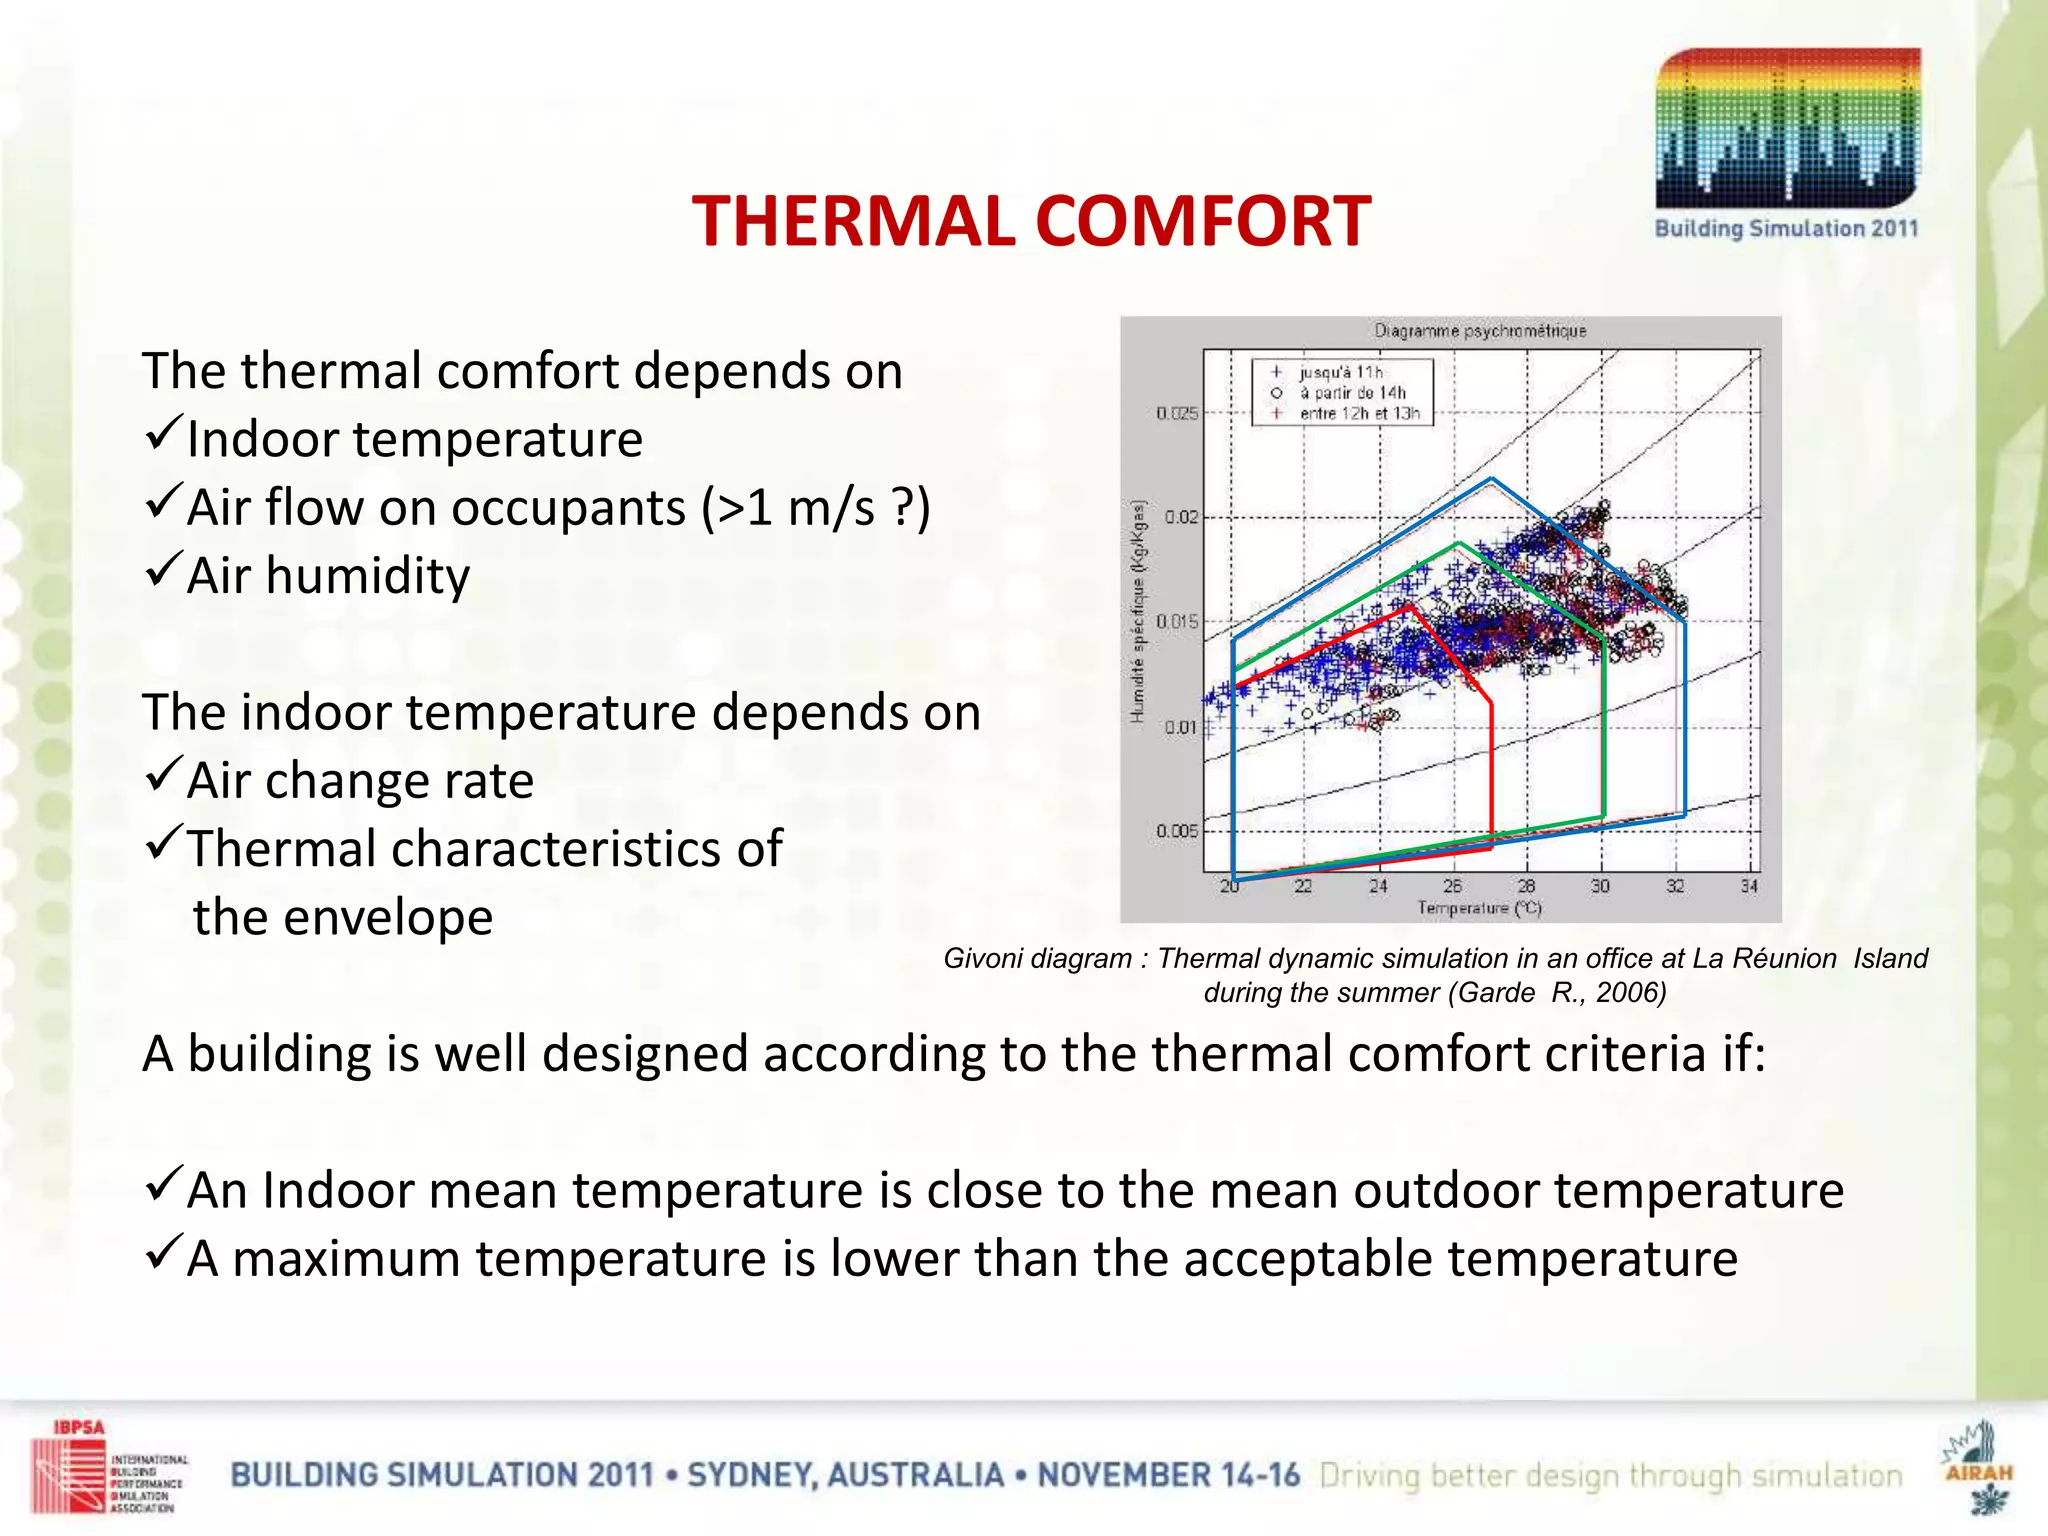
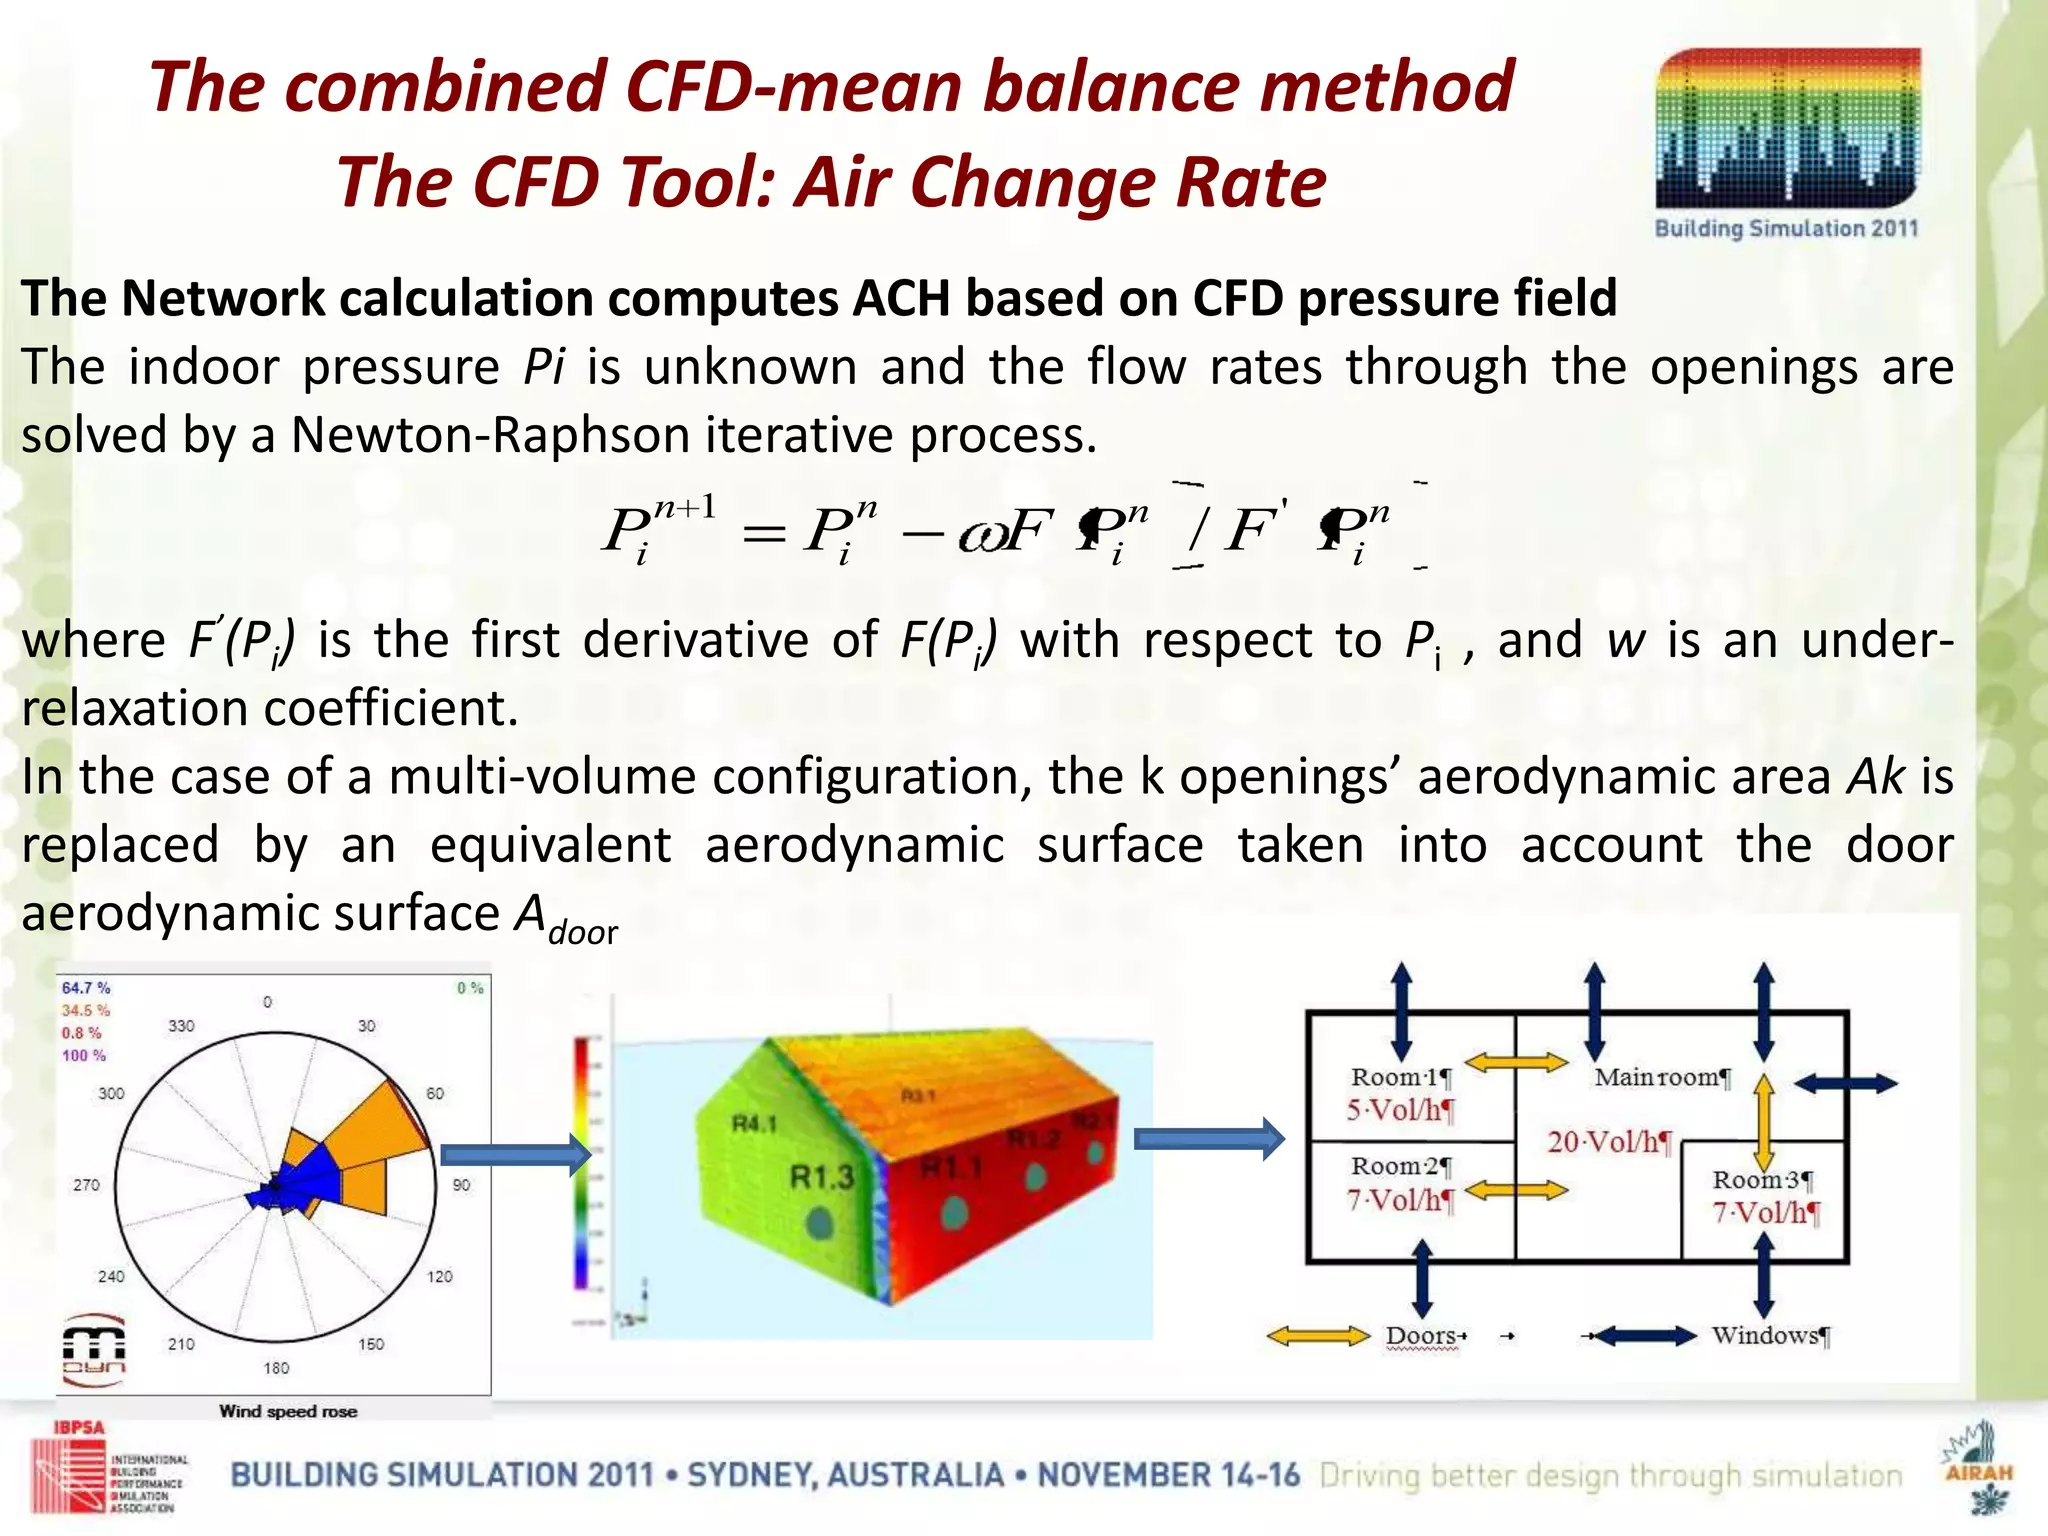
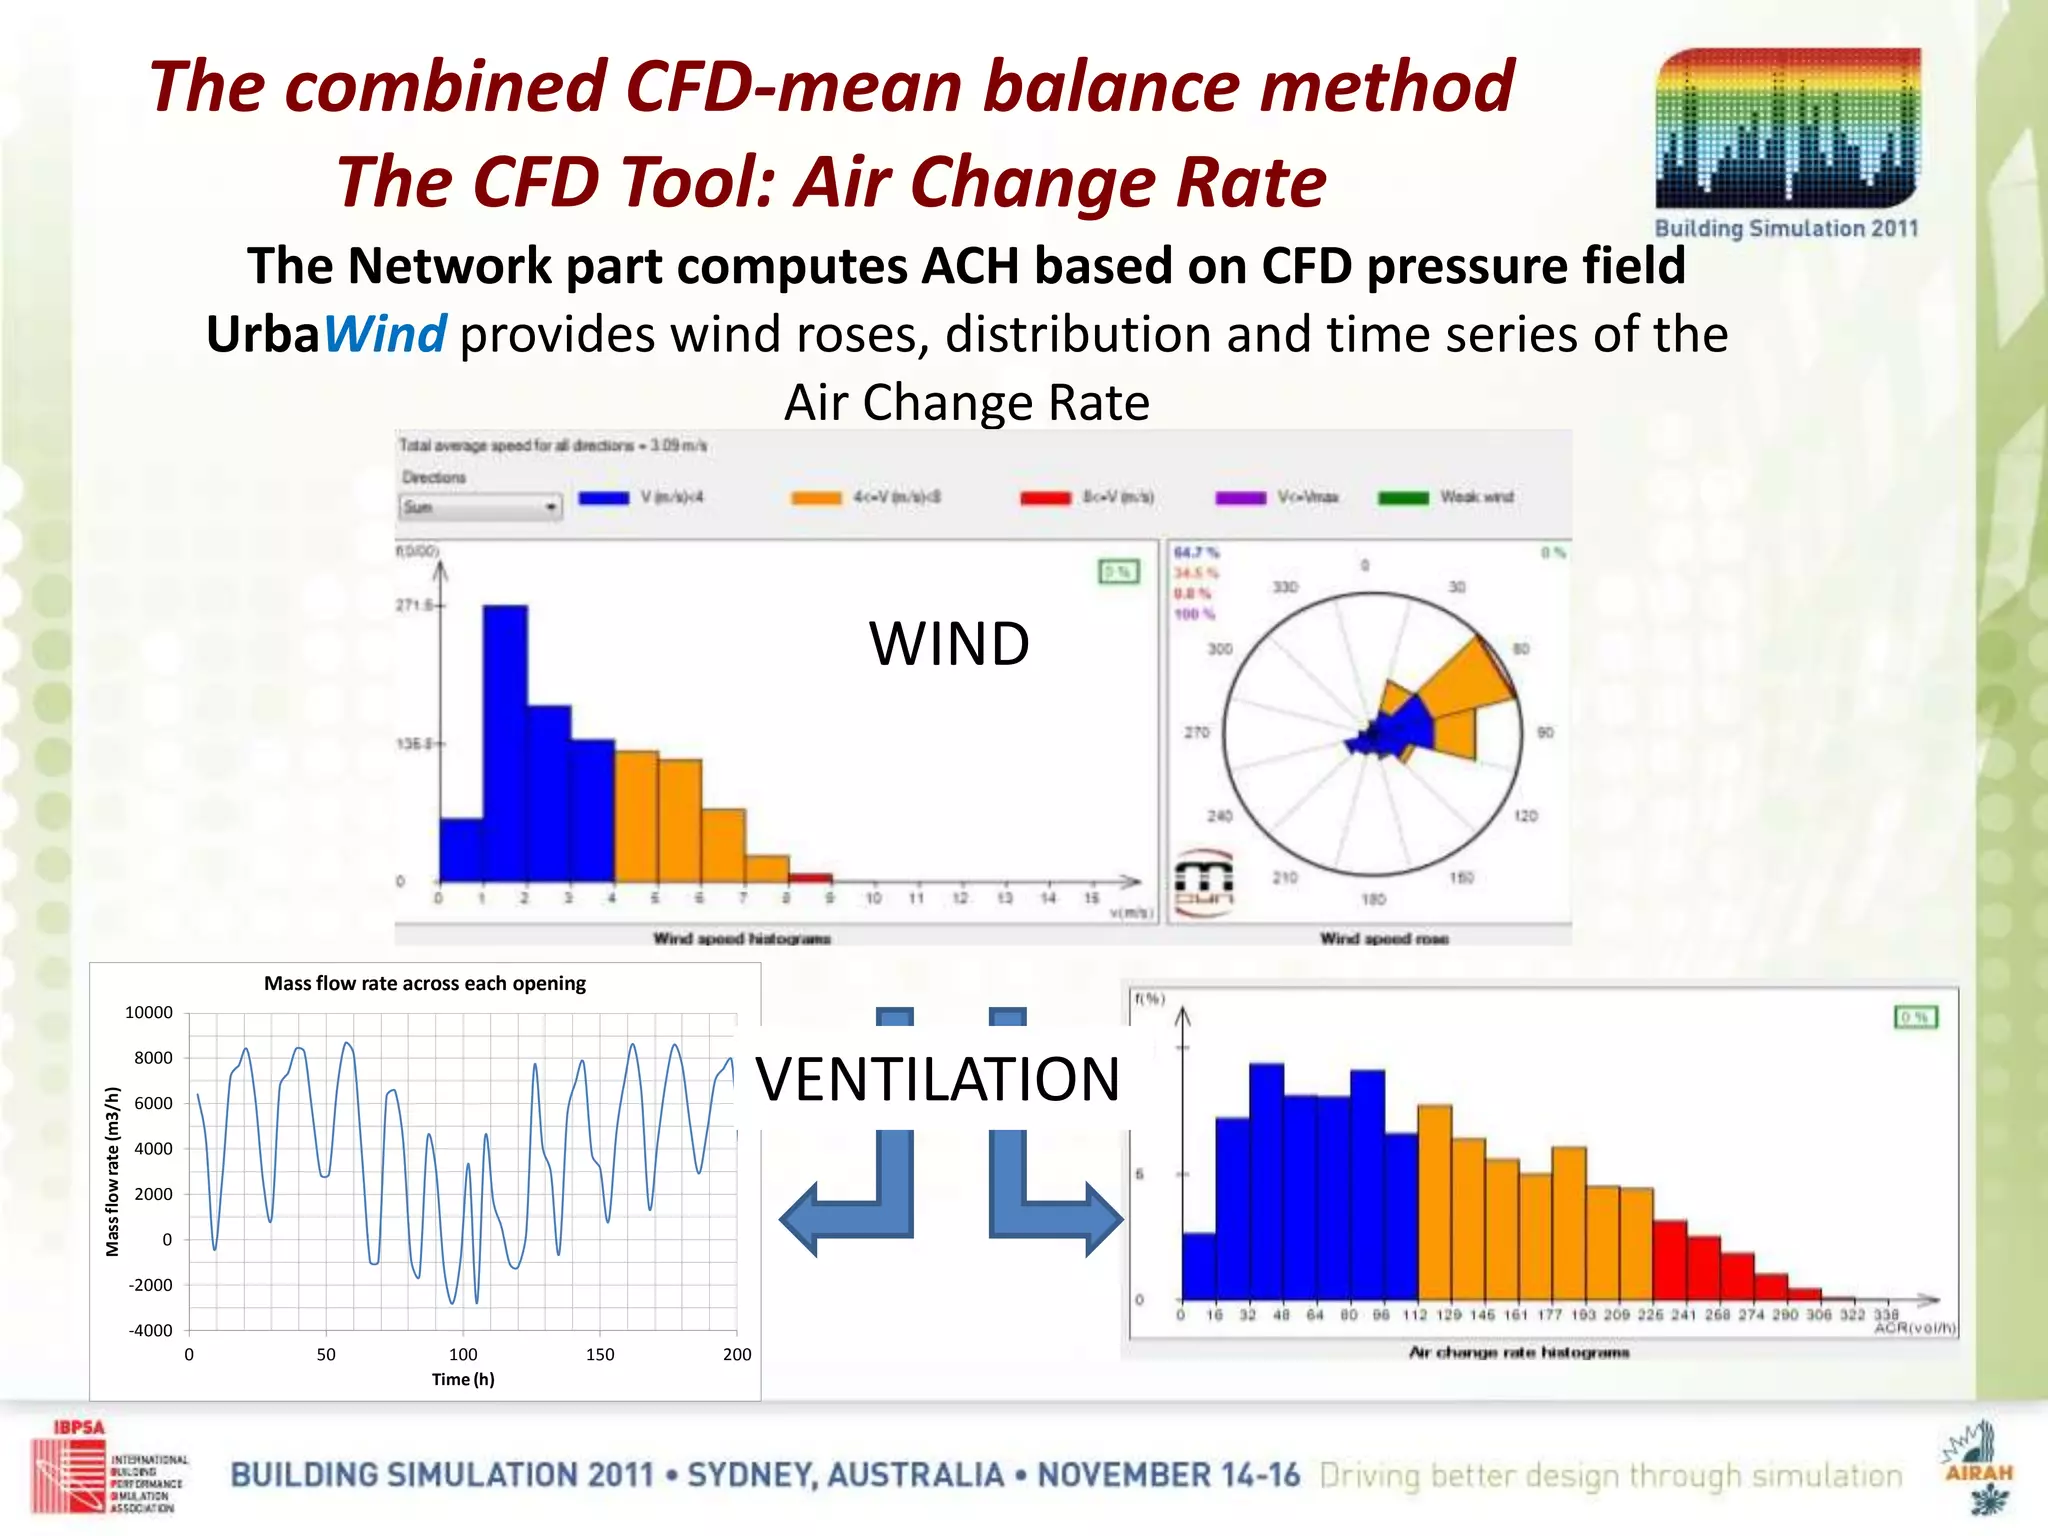
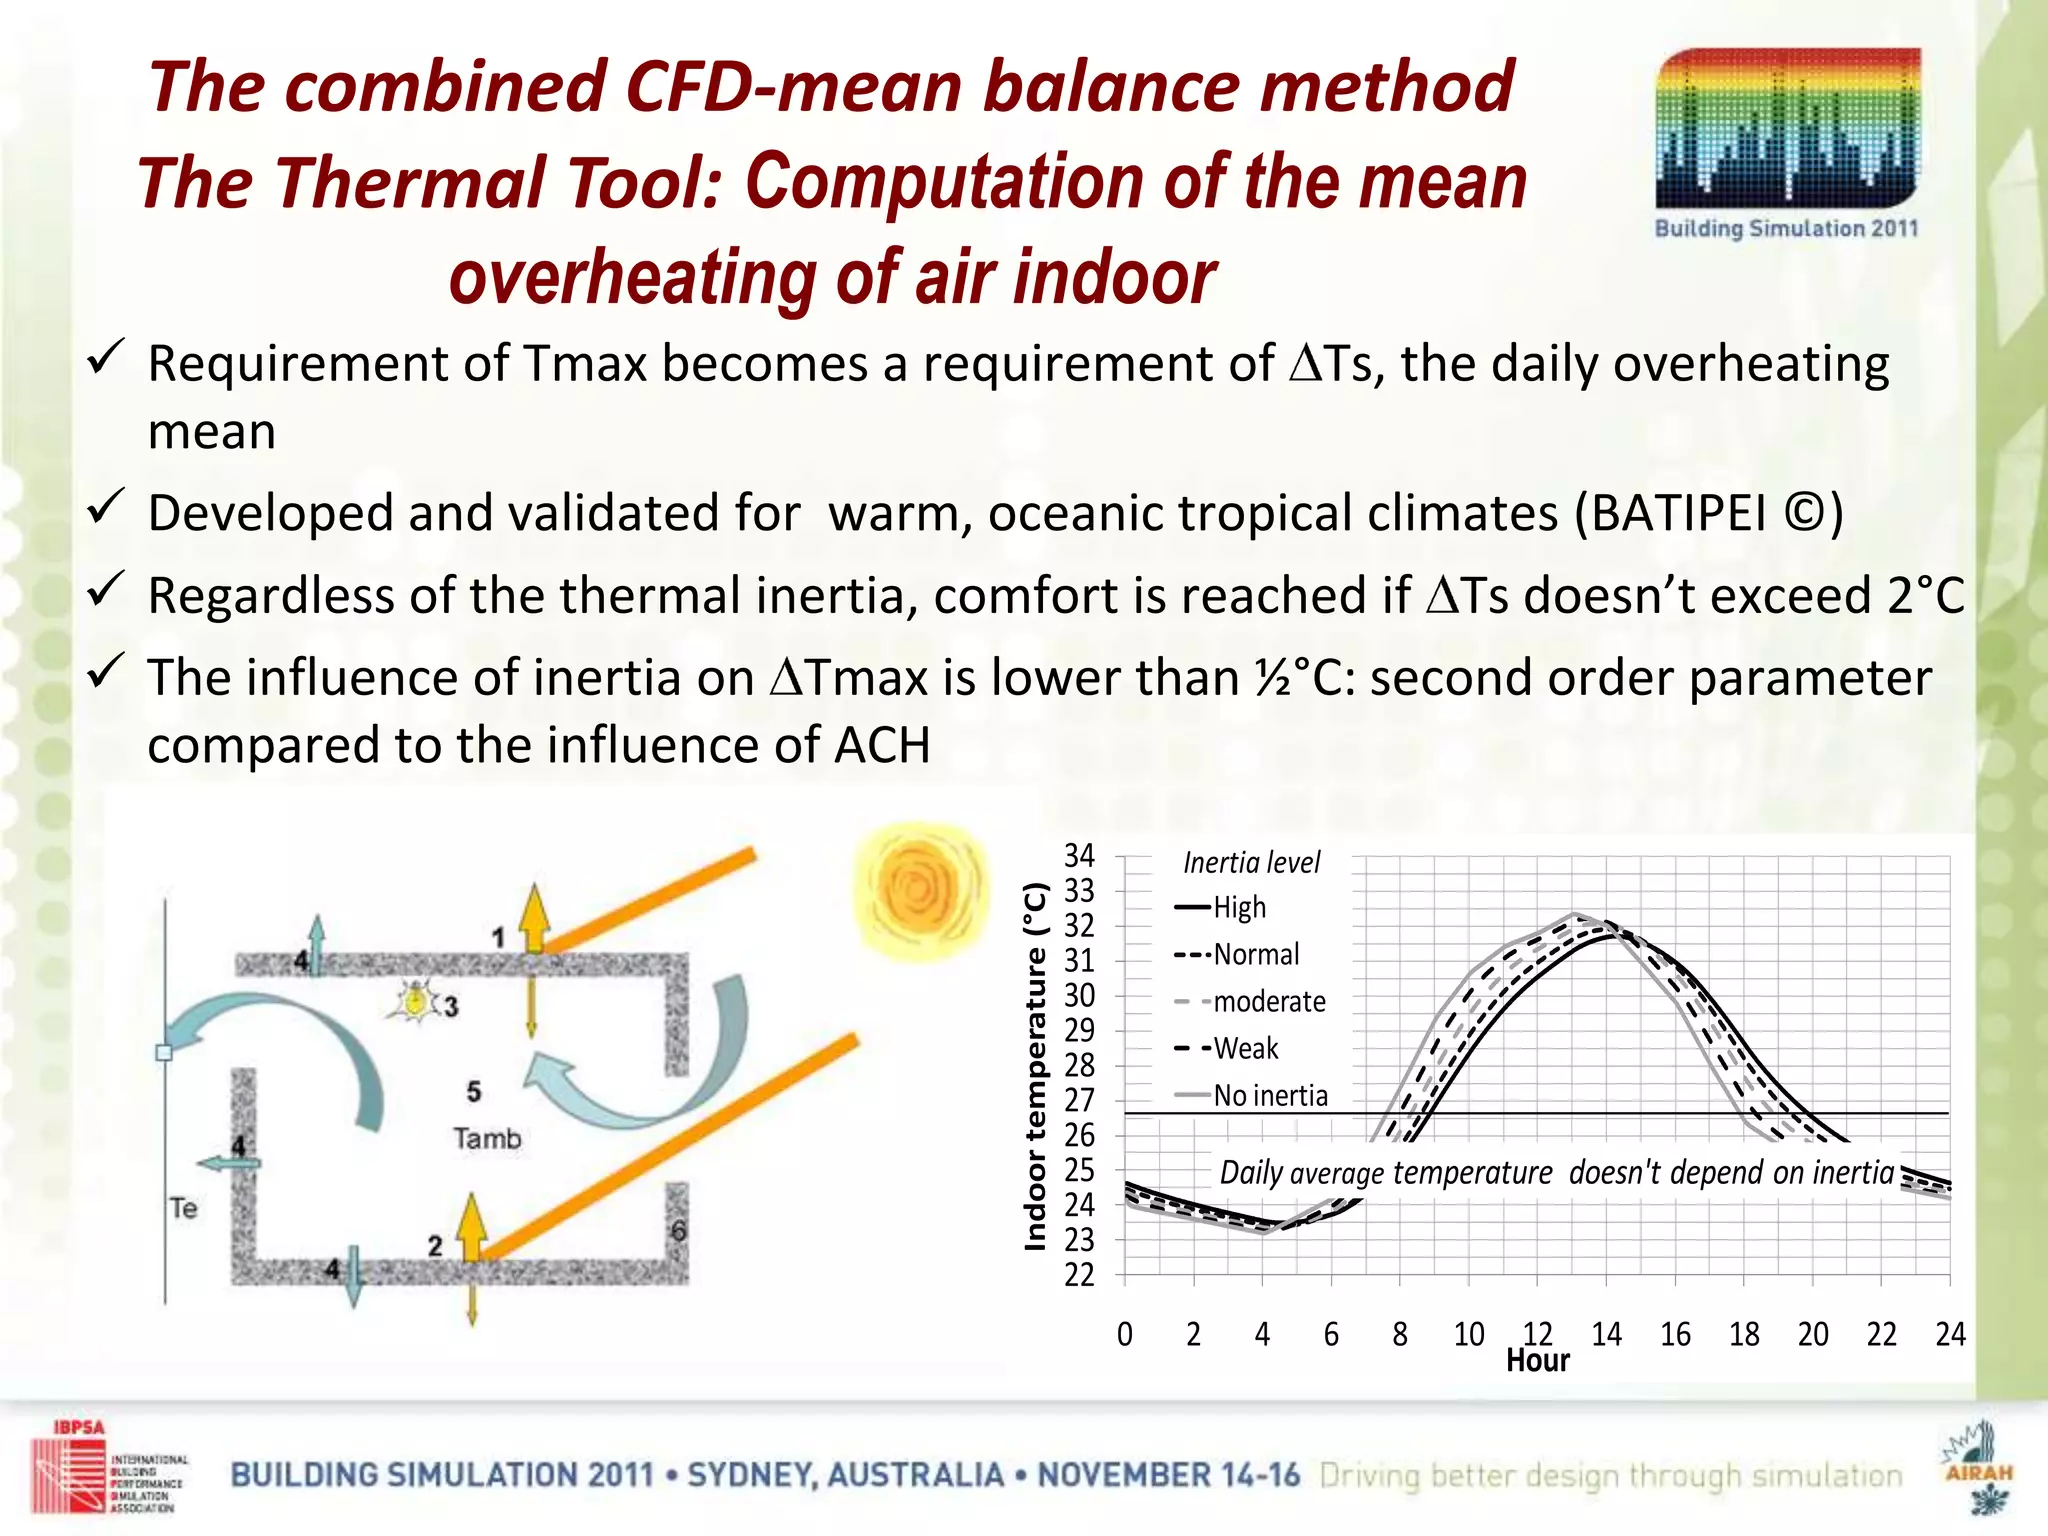
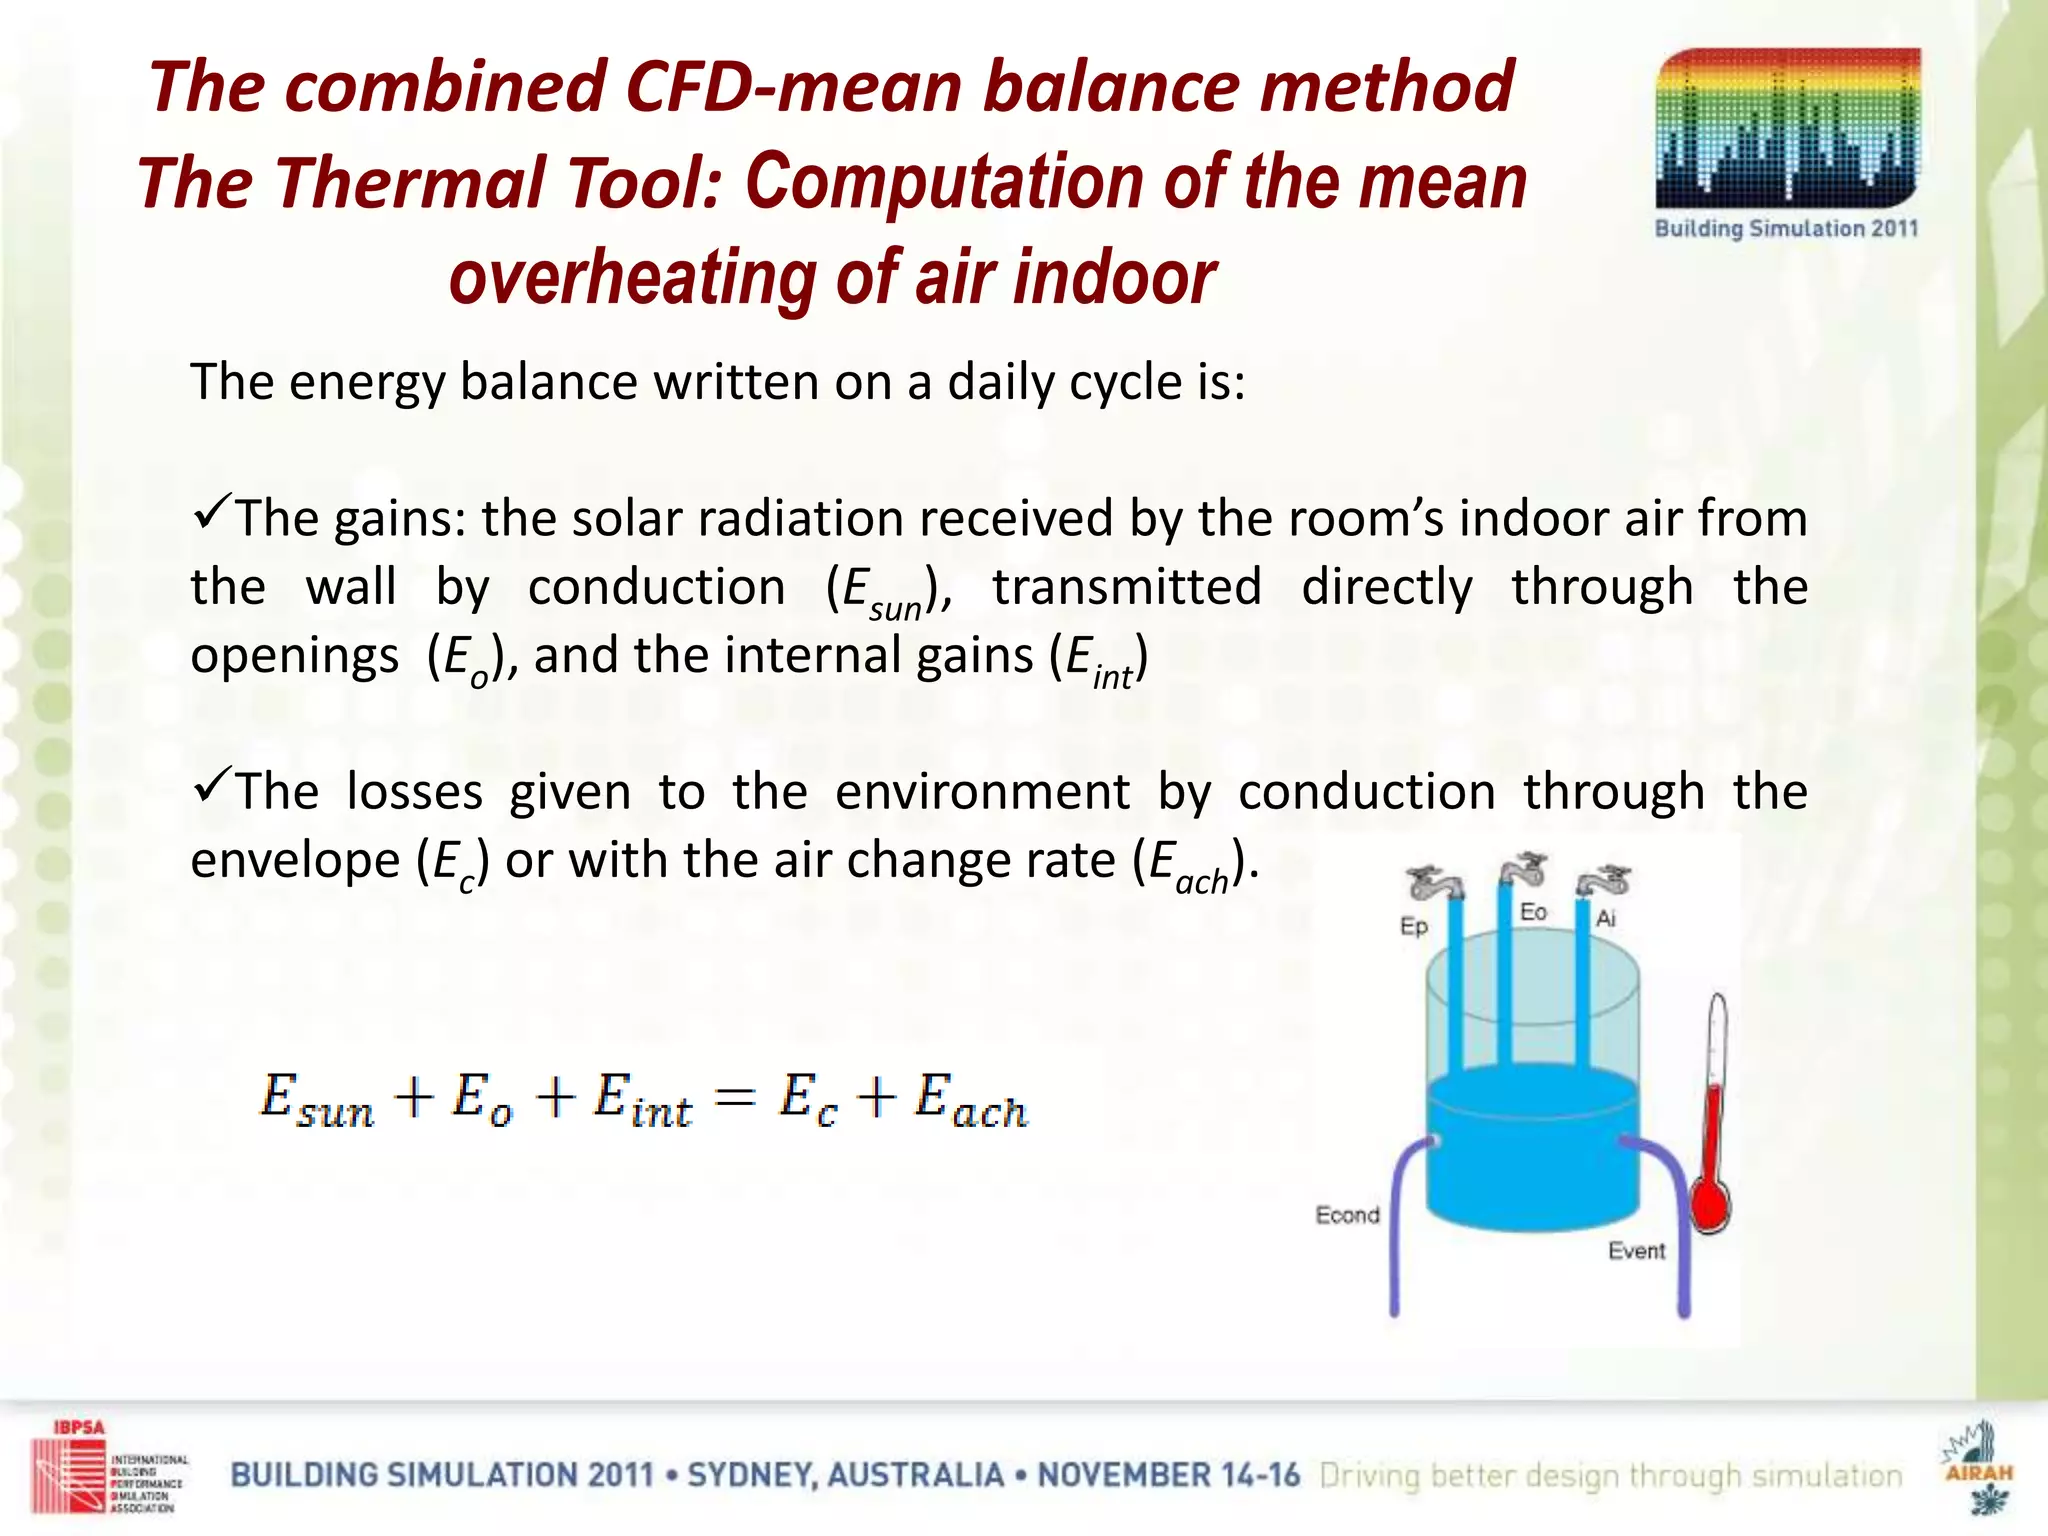
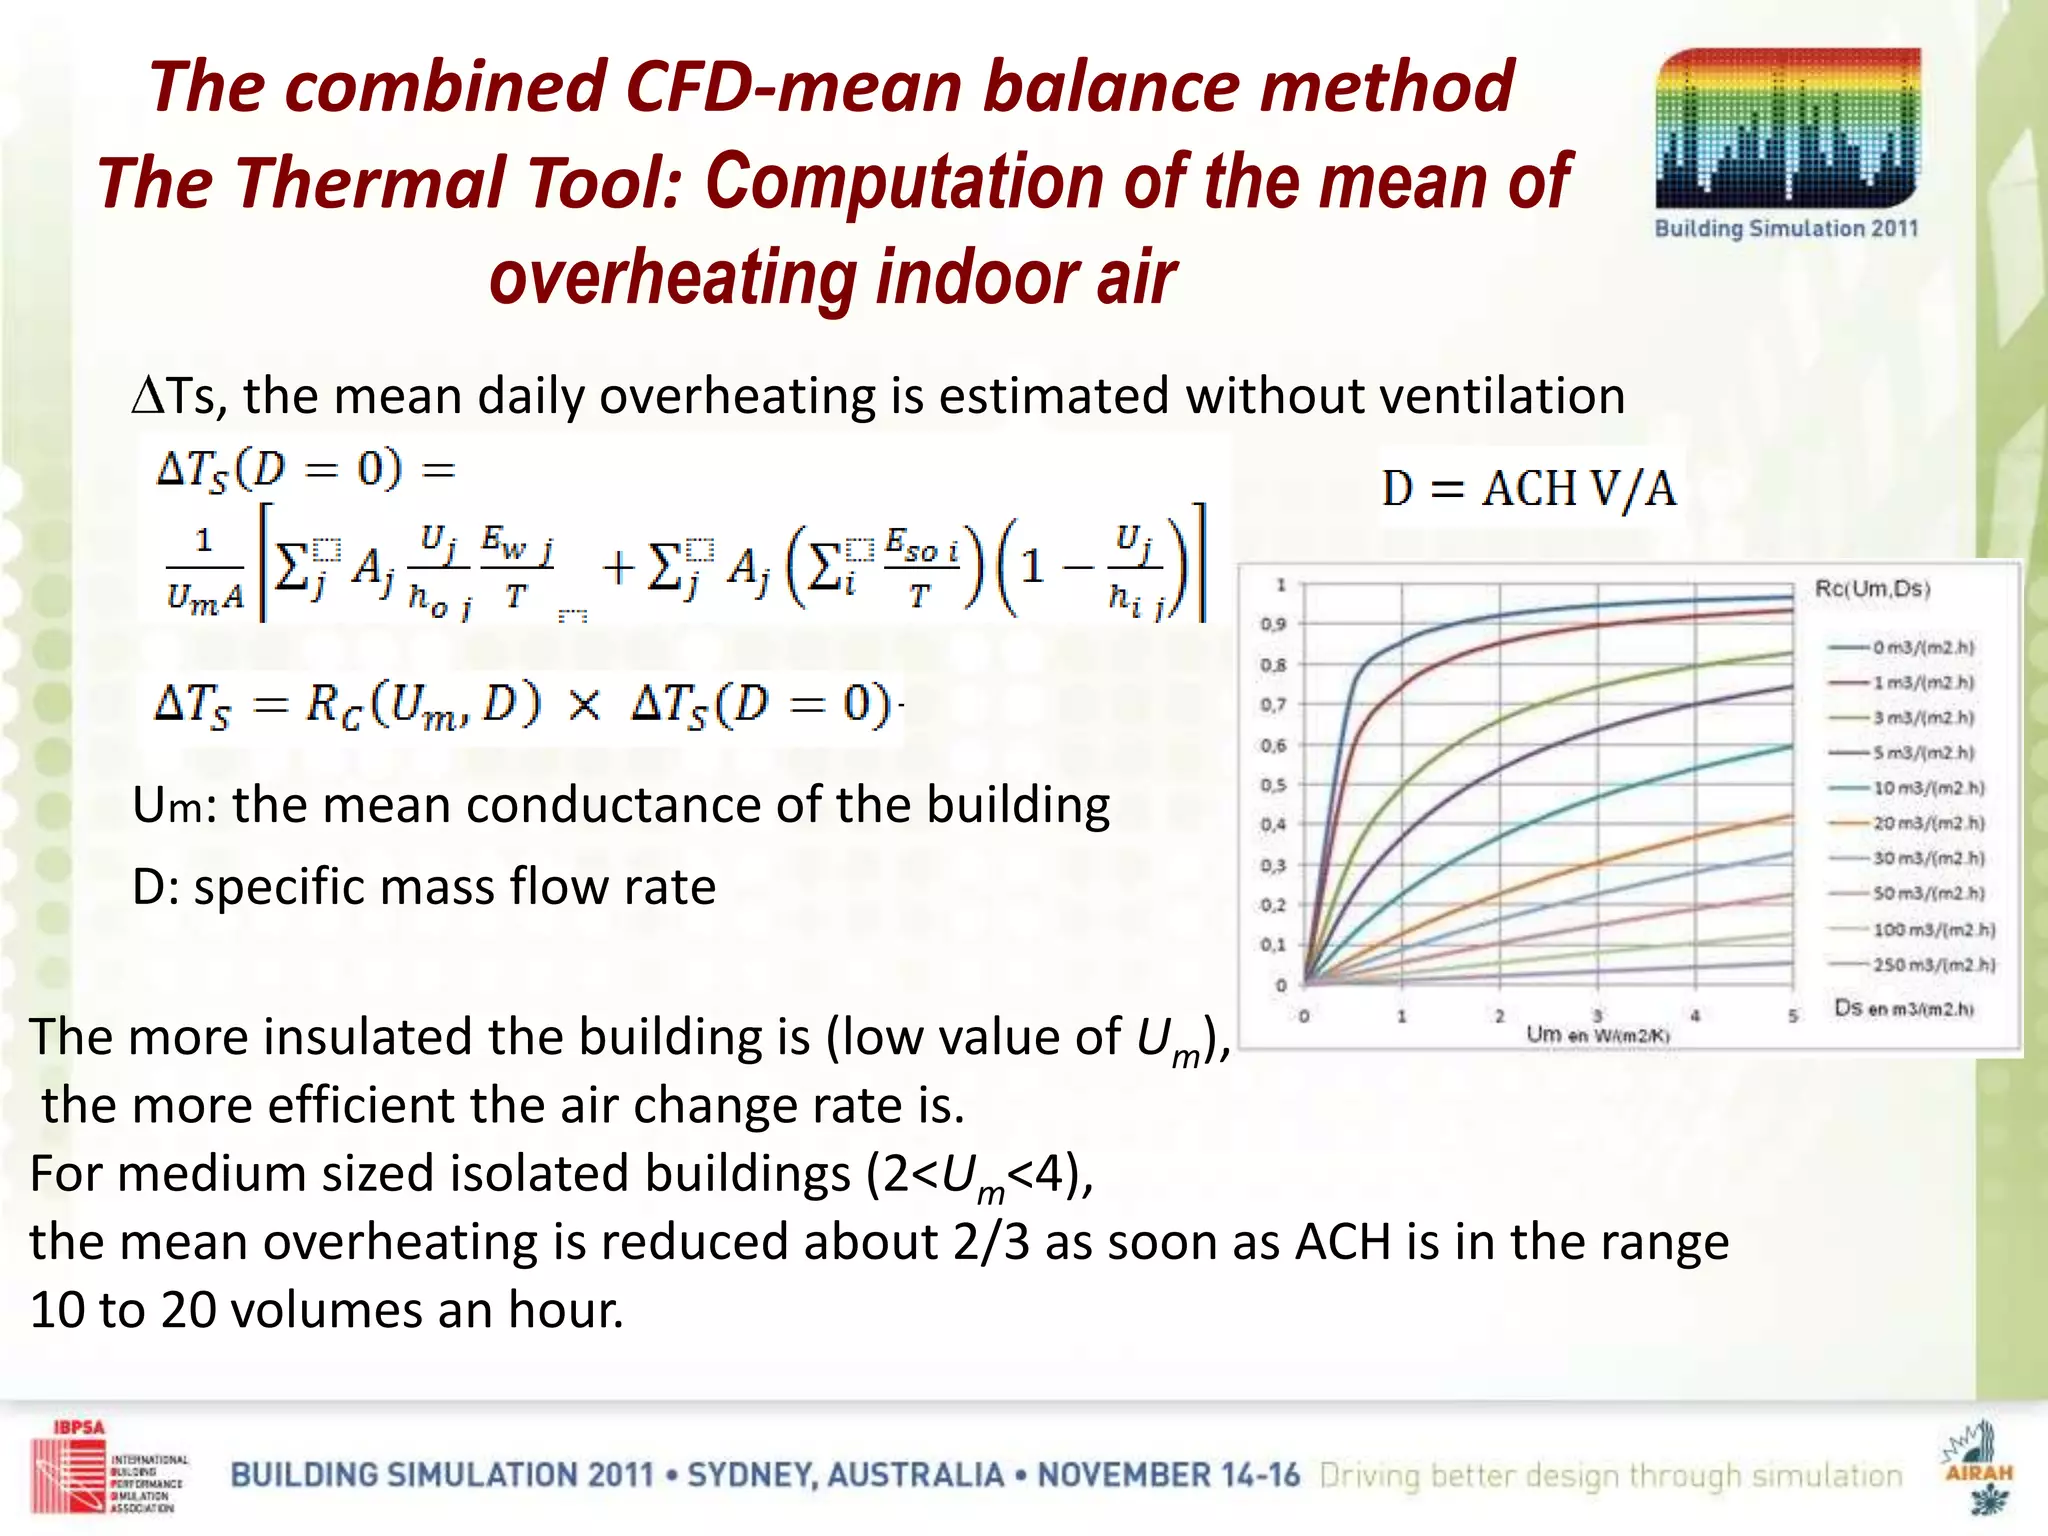
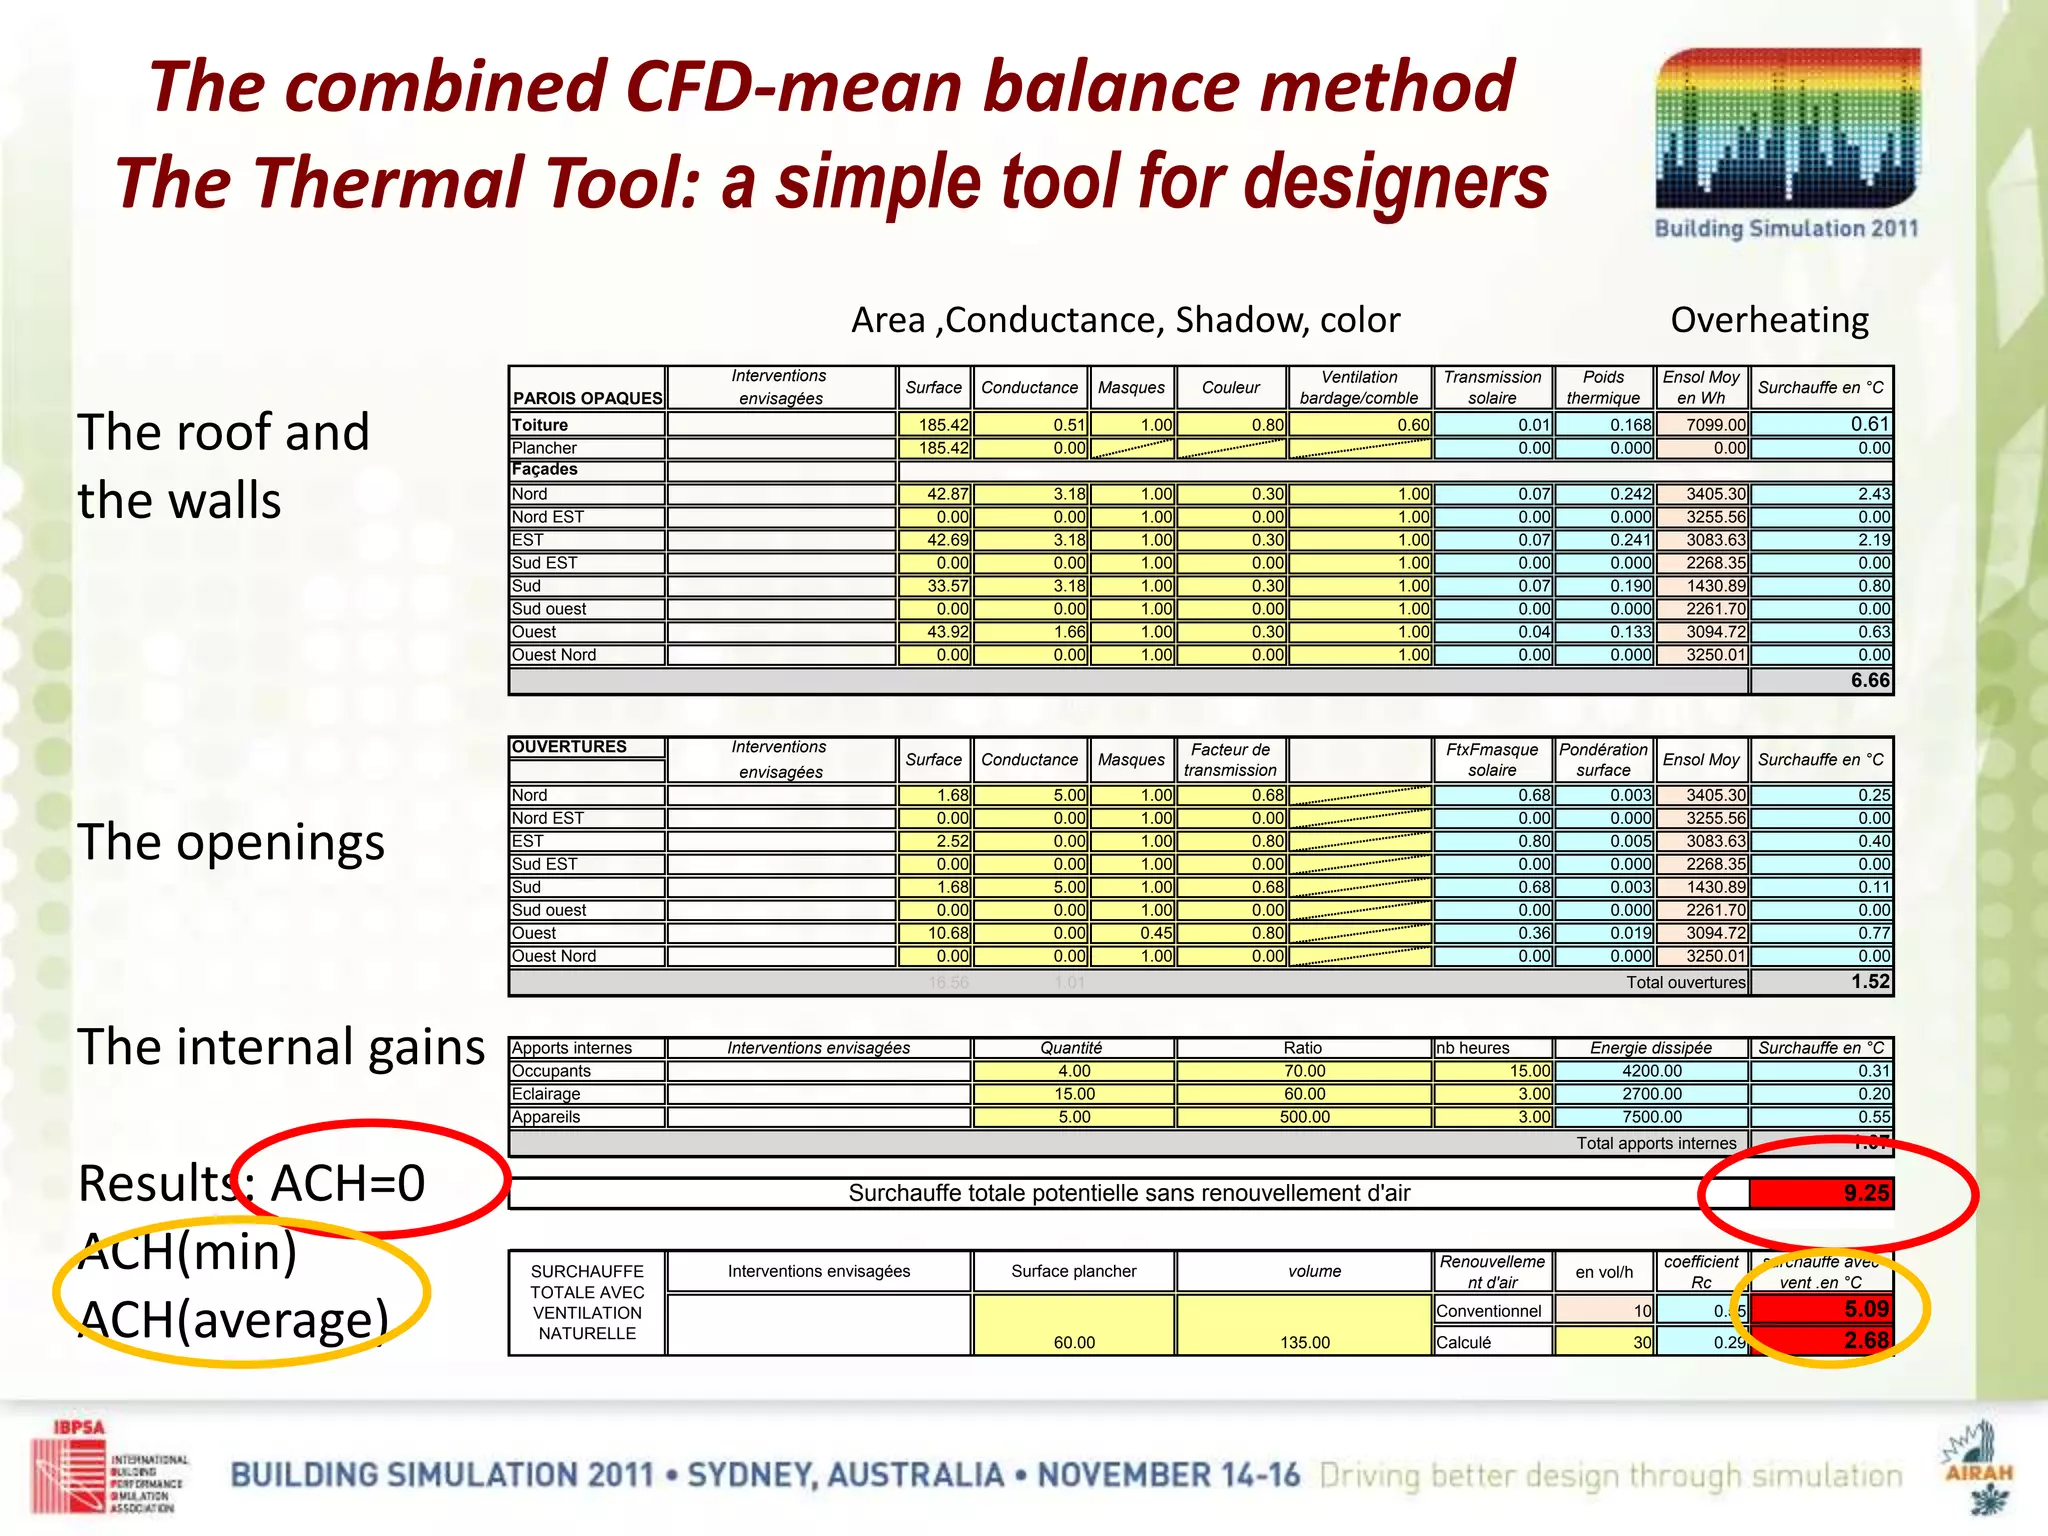
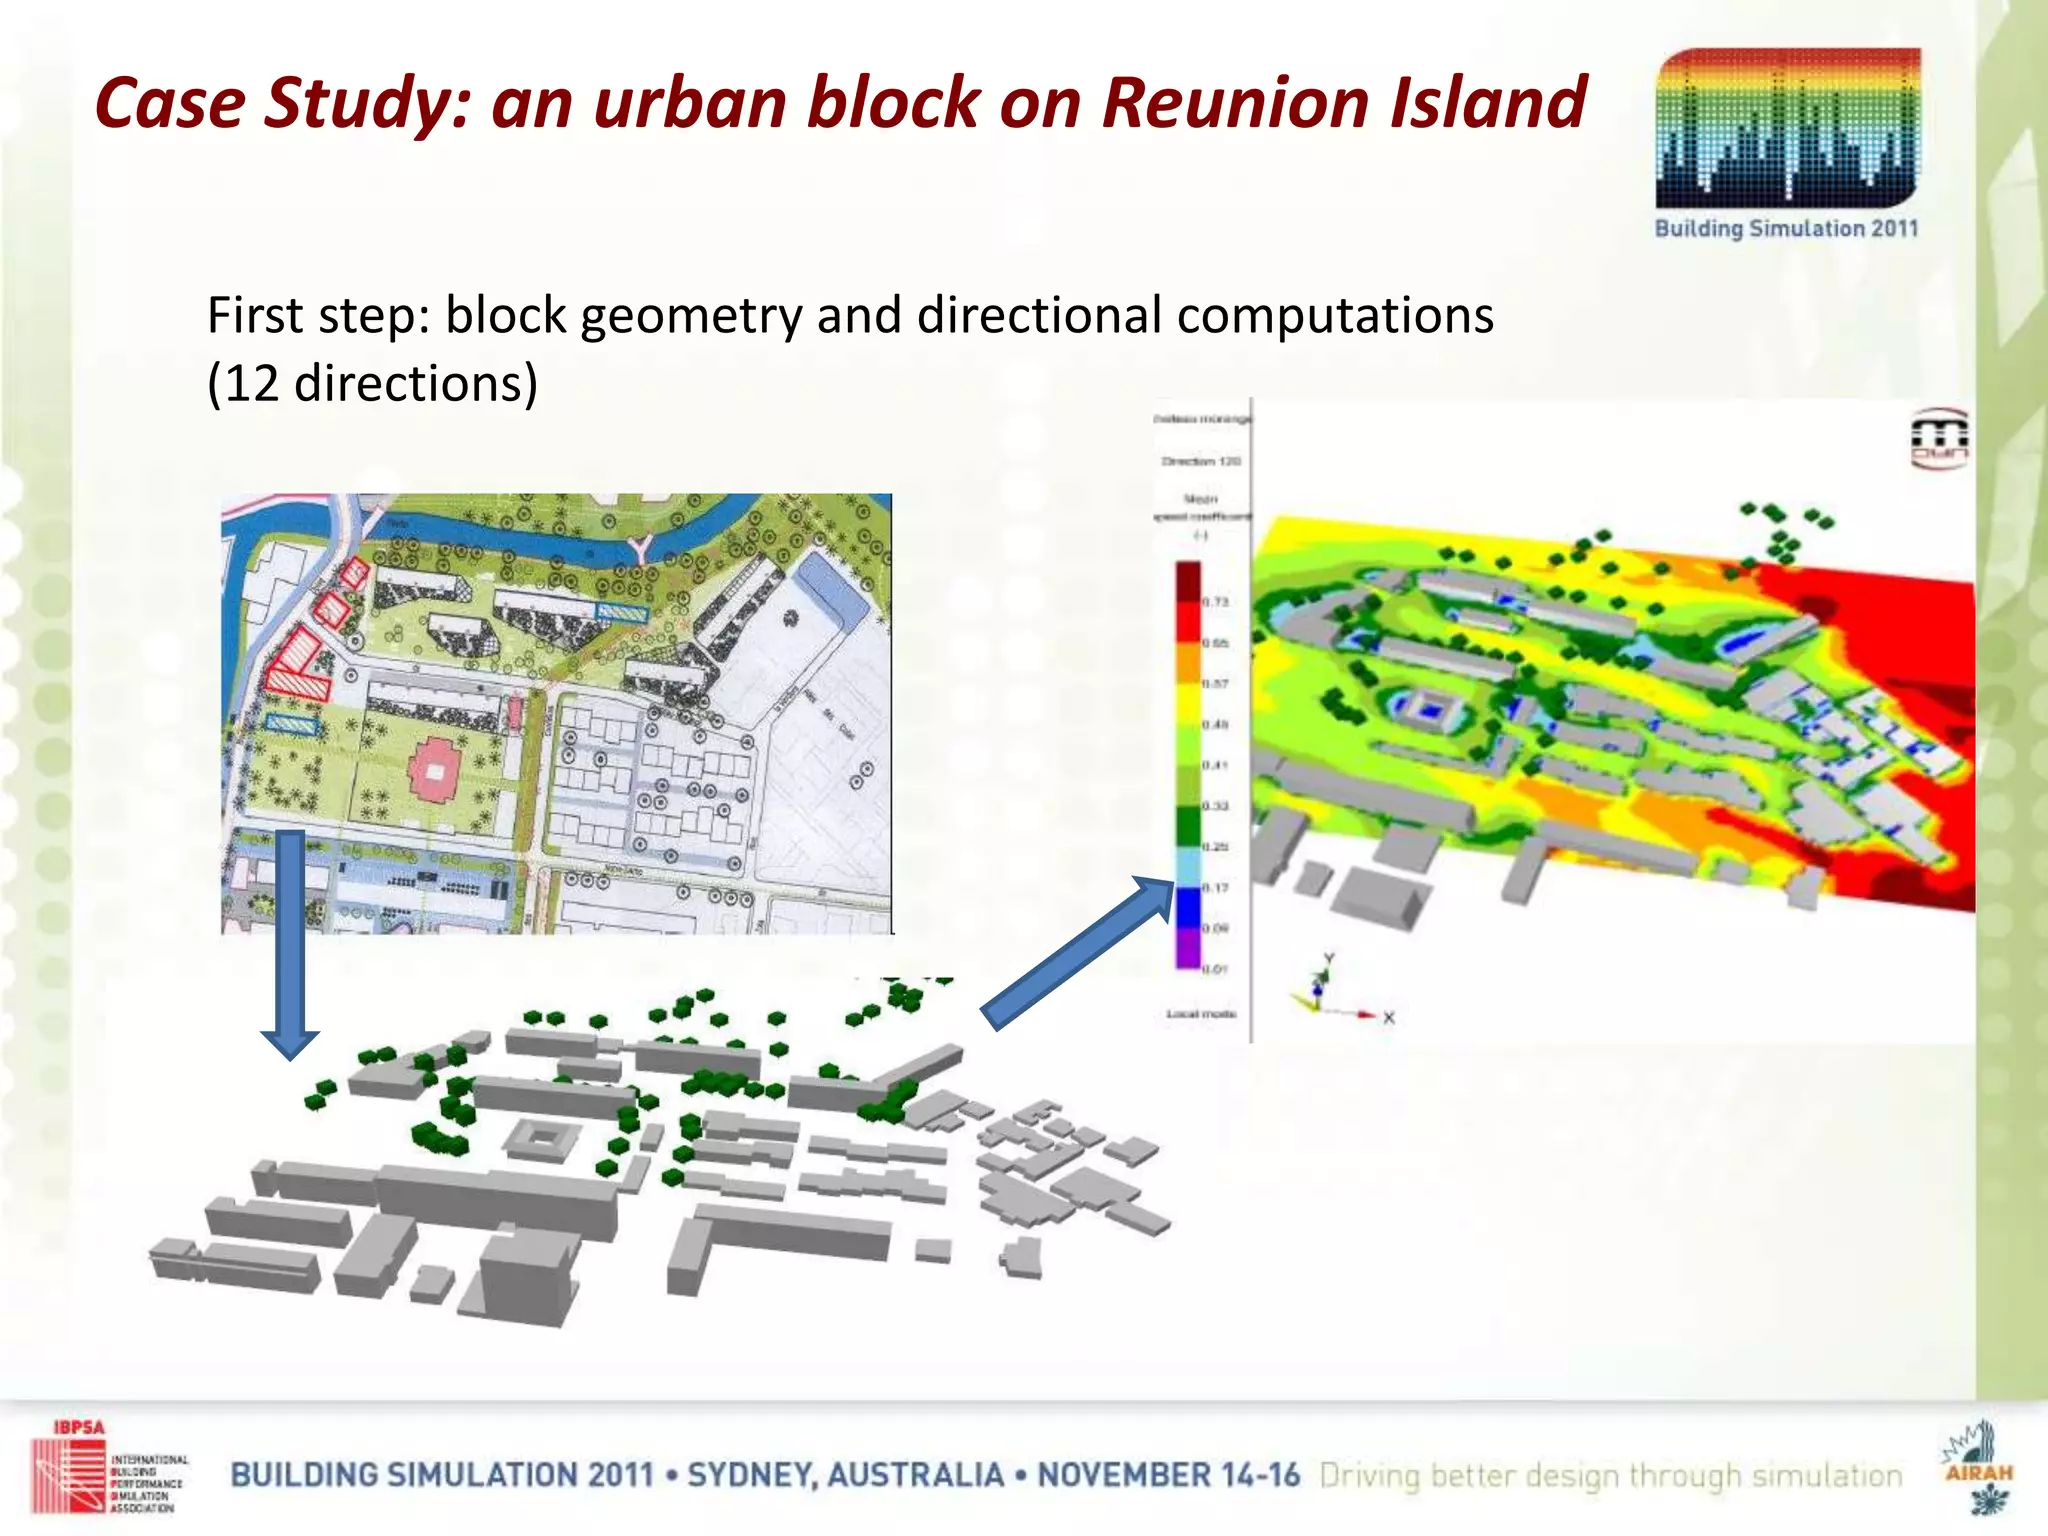
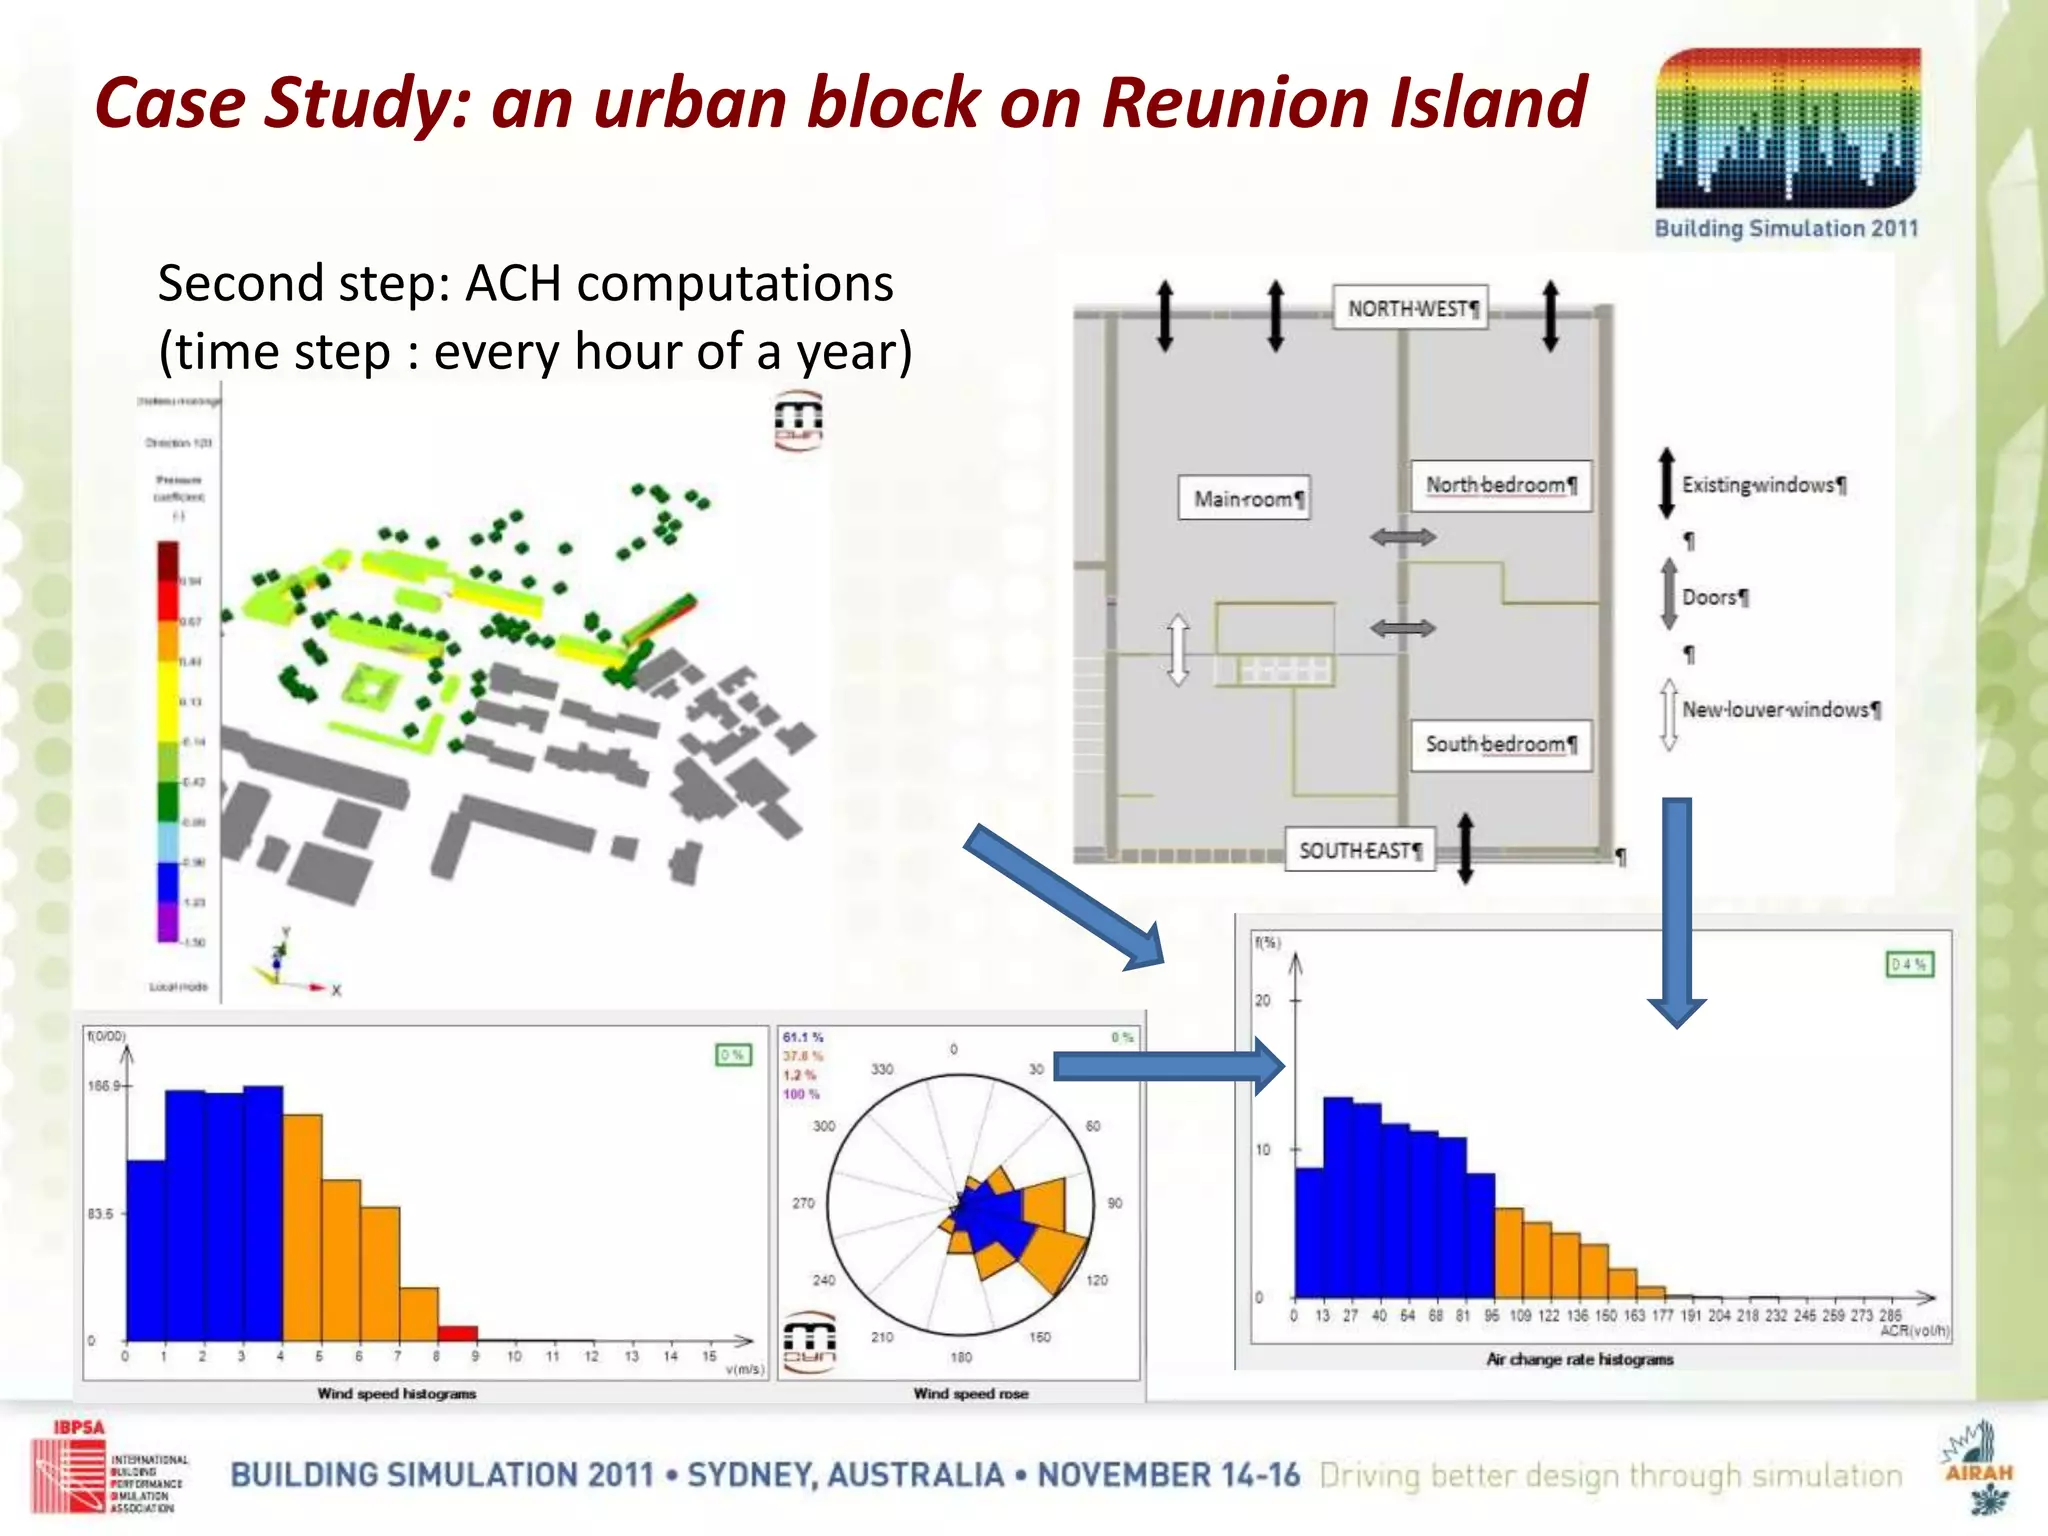
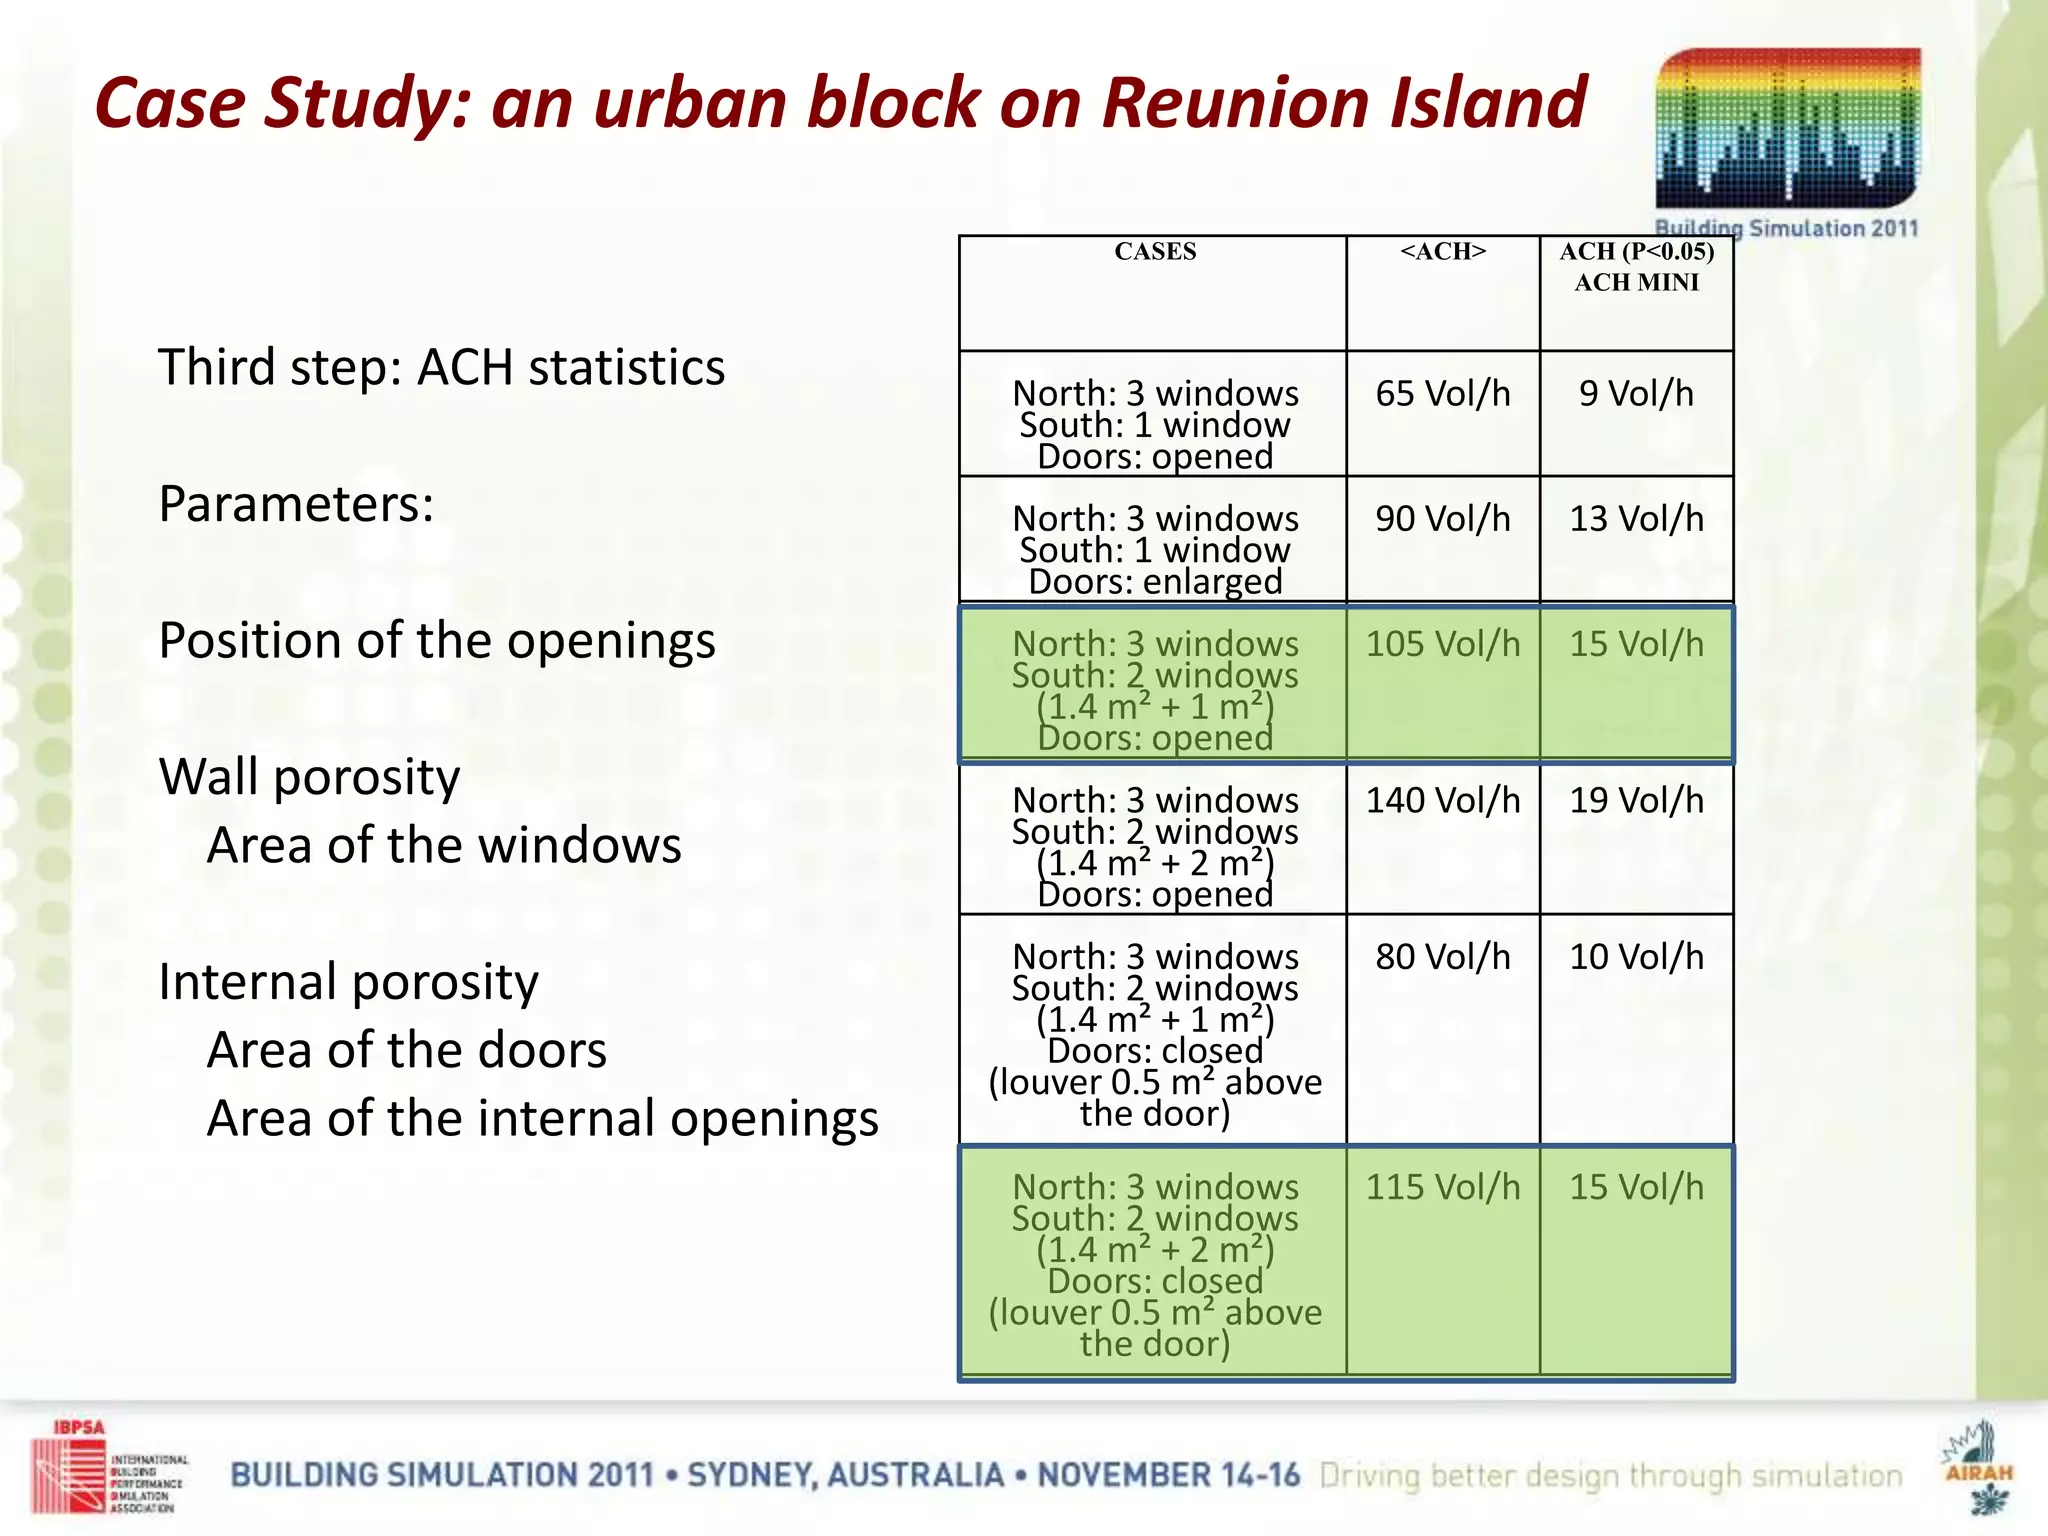
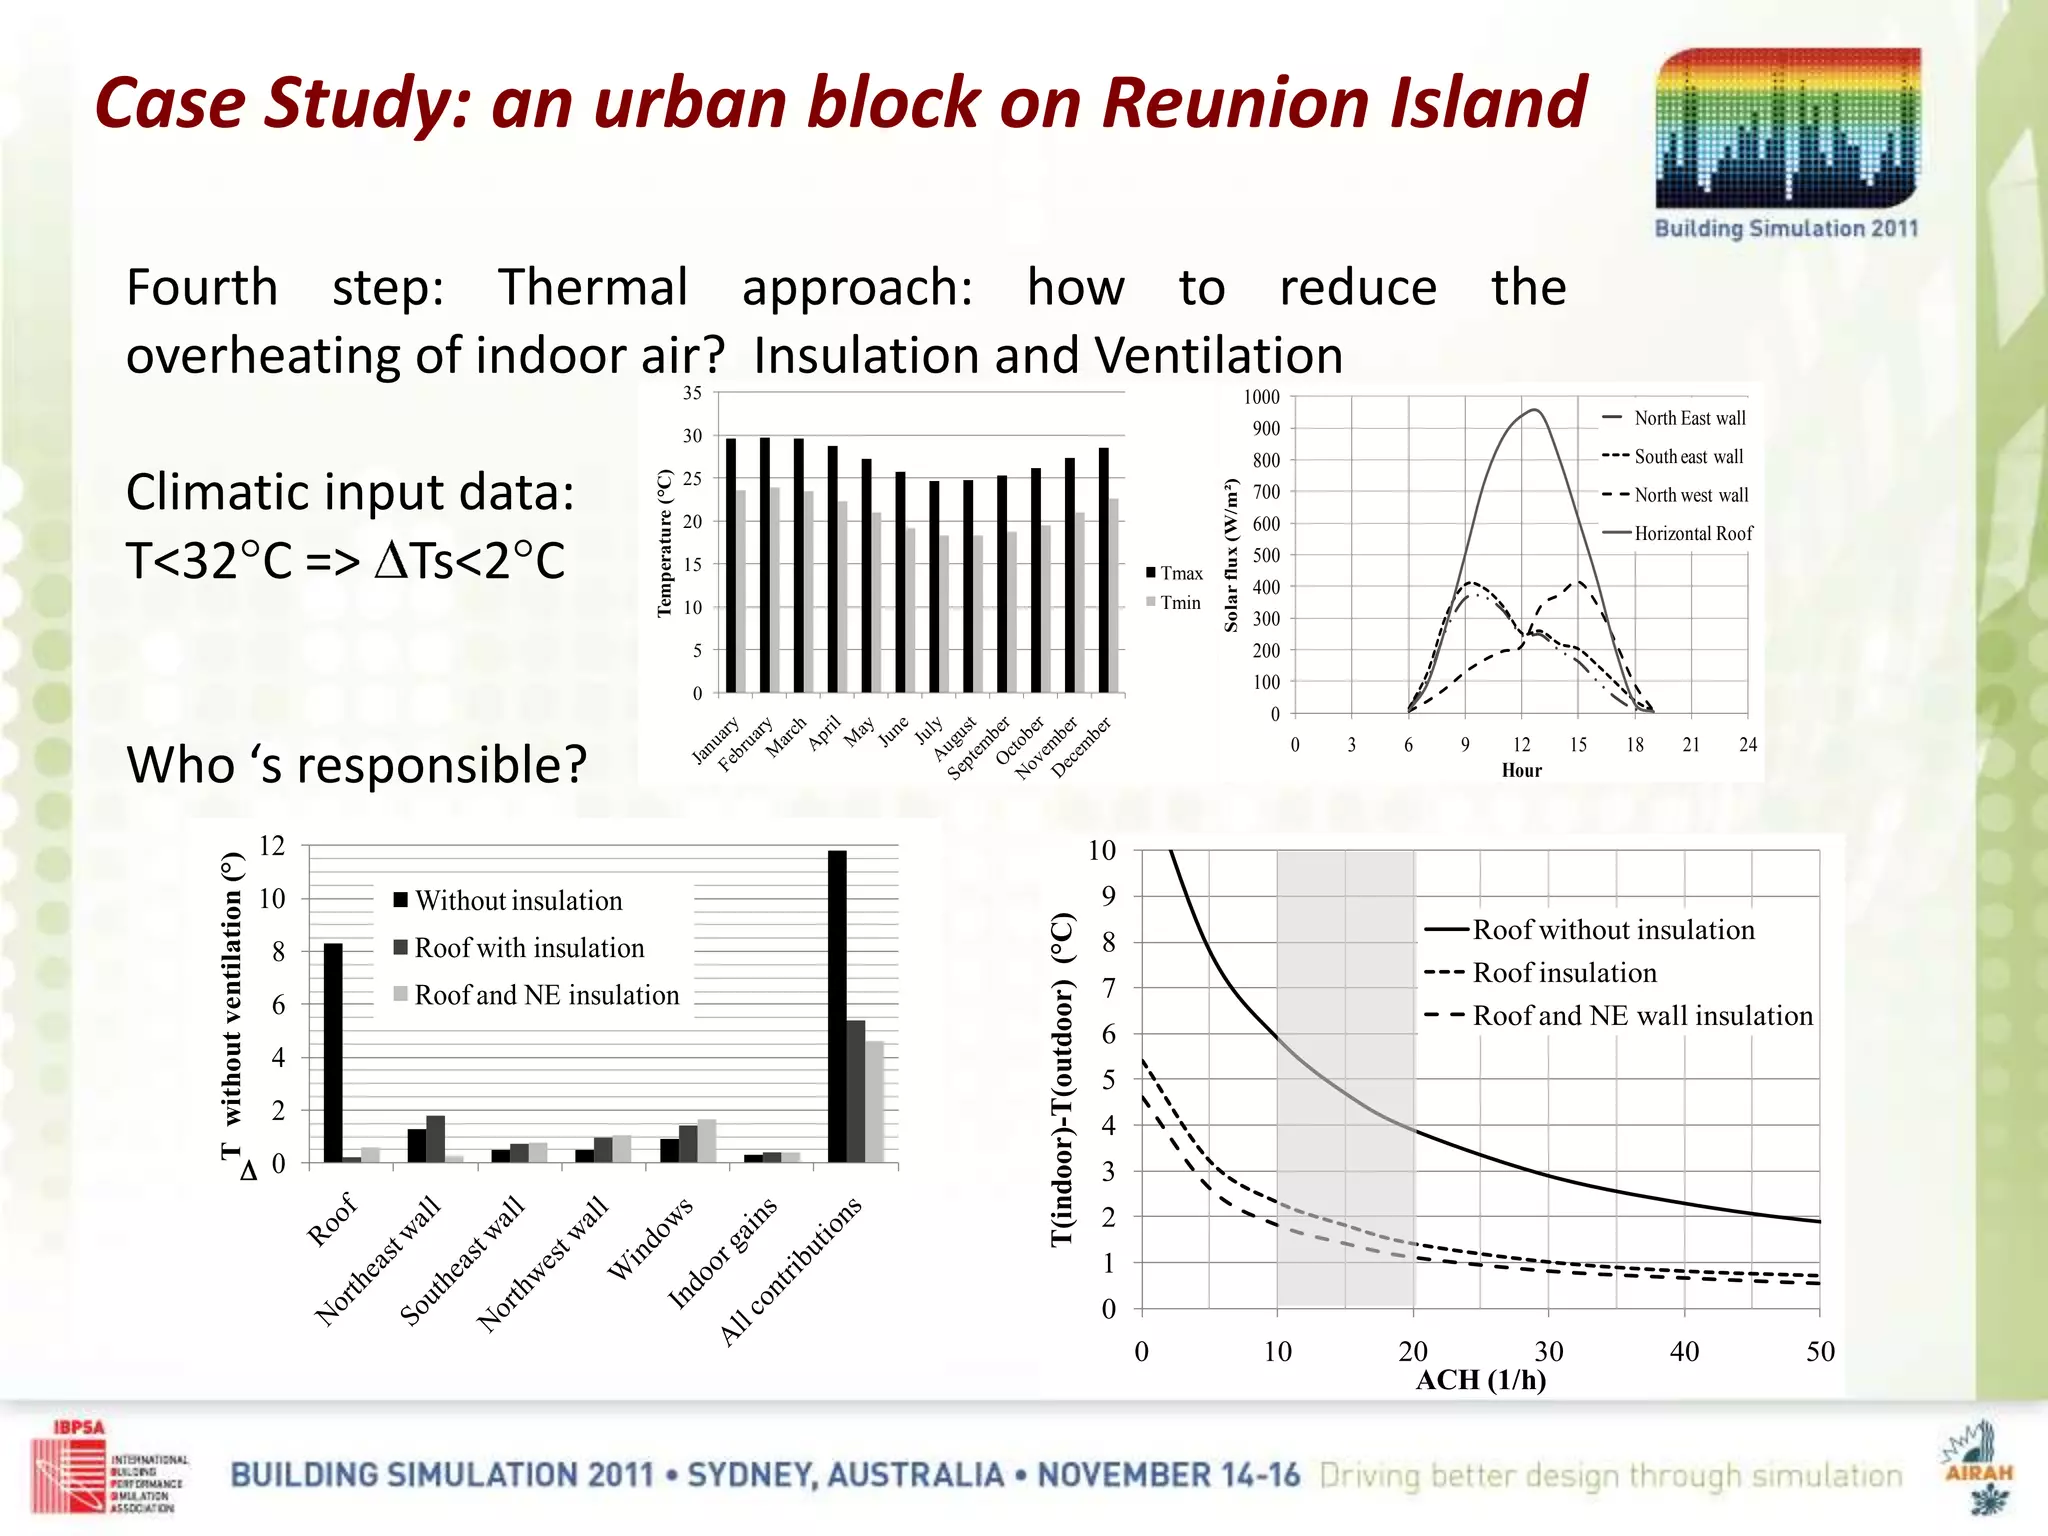
COMBINED CFD-MEAN ENERGY BALANCE METHOD
TO THERMAL COMFORT ASSESSMENT OF BUILDINGS
IN A WARM TROPICAL CLIMATE
Stéphane Sanquer1, Mohamed Abdesselam2, Fabien Picgirard3
1Meteodyn, Nouméa, New Caledonia, France
2Solener, Lille, France
3Ademe, La Réunion, France
BACKGROUND
Reduce the energy consumption in buildings located in warm tropical
climates in overseas territories
17% of buildings use HVAC – this rate has doubled over the last 5
years – Energy providers could not support this increasing
French energy agency ADEME needs rules and tools for existing
buildings in order to make buildings comfortable without artificial
cooling
Designers and architects need simple methods to assess the indoor
thermal comfort in warm tropical climates
ADEME developed BATIPEI. It quickly and easily indicates if air
conditioning is needed
THERMAL COMFORT
The thermal comfort depends on
Indoor temperature
Air flow on occupants (>1 m/s ?)
Air humidity
The indoor temperature depends on
Air change rate
Thermal characteristics of
the envelope
A building is well designed according to the thermal comfort criteria if:
An Indoor mean temperature is close to the mean outdoor temperature
A maximum temperature is lower than the acceptable temperature
Givoni diagram : Thermal dynamic simulation in an office at La Réunion Island
during the summer (Garde R., 2006)
HOW TO CALCULATE THE INDOOR TEMPERATURE ?
Batipei was developed as a simple average method (Abdesselam,
1997) for tropical warm climates.
Various parts of the building are identified within the energy balance to
allow users to make adjustments based on comfort.
Dynamic thermal modeling simulates the instantaneous physical
behaviors of buildings with high accuracy. Numerous results are
produced by DTM which requires an expert to link results to input data.
BATIPEI is used as a pedagogical method for less experienced designers
Both approaches are complementary: the decision depends on the
building complexity and the budget devoted to design.
HOW TO CALCULATE THE AIR CHANGE RATE
Air change rate and indoor velocity fundamentally depend on the
external wind pressure at the openings.
Basic formula for crosswind ventilation (one volume , 2 openings)
Aeq =Aerodynamic area of the openings
Uwind = wind speed
Cp1 et Cp2: pressure coefficients
We need UWIND and Cp1 and Cp2 to calculate the mass flow rate.
Tables (Liddament, Eurocode) and parametric models can be used for
Standard cases, that means for simple, detached and isolated buildings.
WINDeqWIND UCpCpAU
CACA
CpCp
Q 21
2
2
2
2
2
1
2
1
21
11
HOW TO CALCULATE THE AIR CHANGE RATE
In urban configurations, wind velocity and
pressure on buildings may not be easily
evaluated.
Tables and analytic models can not be
used.
Experimental approach (Wind tunnel)
Numerical approach (CFD)
Mass flow rate could be evaluated with a
network model. The inputs are :
-External pressure field
-Characteristics of openings (A,C)
-Indoor volume dimensions
OBJECTIVE
Develop a simple method to assess the comfort levels in
buildings in urban areas with warm tropical climates.
A CFD-Network tool combined to a thermal tool
Computation of mass flow rates across the openings according to the
local climatology: UrbaWind (meteodyn)
Computation of the mean overheating temperature as a comfort
criteria: BATIPEI (Ademe/Abdesselam)
Case study: renovation of an entire block
The combined CFD-mean balance method
The CFD Tool: Meshing
 Automatic and non-structured
 Horizontal and vertical refinement at key locations (points or physical
surfaces)
 Default: 50 cm horizontal, 20 cm vertical
 For this application, only the outdoor
spaces are meshed
 Typical Radius: 300 m =>1 M cells
The CFD calculation computes the outside flow and the pressure field
UrbaWind solves the averaged equations of mass and momentum
conservations (Navier-Stokes equations) for steady flow and the
incompressible fluids.
The turbulent fluxes are parameterized by using the turbulent viscosity
considered as the product of a length scale by a speed scale which are both
characteristic lengths of the turbulent fluctuations.
LT varies linearly with the distance at the nearest wall (ground and buildings).
The combined CFD-mean balance method
The CFD Tool: Directional computations
0'' iji
i
j
j
i
jij
ij
Fuu
x
u
x
u
xx
P
x
uu
Tt
Tj
j
i
j
j
i
T
ik
T
i
i
Lk
L
k
C
x
u
x
u
x
u
x
k
ku
x
2/1
2/3
and
The CFD calculation computes the outside flow and the pressure field for
every wind direction
Velocity field Pressure field
The combined CFD-mean balance method
The CFD Tool: Directional computations
The Network calculation computes ACH based on CFD pressure field
The indoor pressure Pi is unknown and the flow rates through the openings are
solved by a Newton-Raphson iterative process.
where F’(Pi) is the first derivative of F(Pi) with respect to Pi , and w is an under-
relaxation coefficient.
In the case of a multi-volume configuration, the k openings’ aerodynamic area Ak is
replaced by an equivalent aerodynamic surface taken into account the door
aerodynamic surface Adoor
The combined CFD-mean balance method
The CFD Tool: Air Change Rate
n
i
n
i
n
i
n
i PFPFPP '1
/
The Network part computes ACH based on CFD pressure field
UrbaWind provides wind roses, distribution and time series of the
Air Change Rate
The combined CFD-mean balance method
The CFD Tool: Air Change Rate
-4000
-2000
0
2000
4000
6000
8000
10000
0 50 100 150 200
Massflowrate(m3/h)
Time (h)
Mass flow rate across each opening
WIND
VENTILATION
 Requirement of Tmax becomes a requirement of Ts, the daily overheating
mean
 Developed and validated for warm, oceanic tropical climates (BATIPEI ©)
 Regardless of the thermal inertia, comfort is reached if Ts doesn’t exceed 2°C
 The influence of inertia on Tmax is lower than ½°C: second order parameter
compared to the influence of ACH
The combined CFD-mean balance method
The Thermal Tool: Computation of the mean
overheating of air indoor
22
23
24
25
26
27
28
29
30
31
32
33
34
0 2 4 6 8 10 12 14 16 18 20 22 24
Indoortemperature(°C)
Hour
High
Normal
moderate
Weak
No inertia
Inertia level
Daily average temperature doesn't depend on inertia
The combined CFD-mean balance method
The Thermal Tool: Computation of the mean
overheating of air indoor
The energy balance written on a daily cycle is:
The gains: the solar radiation received by the room’s indoor air from
the wall by conduction (Esun), transmitted directly through the
openings (Eo), and the internal gains (Eint)
The losses given to the environment by conduction through the
envelope (Ec) or with the air change rate (Each).
Ts, the mean daily overheating is estimated without ventilation
Um: the mean conductance of the building
D: specific mass flow rate
The more insulated the building is (low value of Um),
the more efficient the air change rate is.
For medium sized isolated buildings (2<Um<4),
the mean overheating is reduced about 2/3 as soon as ACH is in the range
10 to 20 volumes an hour.
The combined CFD-mean balance method
The Thermal Tool: Computation of the mean of
overheating indoor air
The combined CFD-mean balance method
The Thermal Tool: a simple tool for designers
The roof and
the walls
The openings
The internal gains
Results: ACH=0
ACH(min)
ACH(average)
Interventions
envisagées
Toiture 185.42 0.51 1.00 0.80 0.60 0.01 0.168 7099.00 0.61
Plancher 185.42 0.00 0.00 0.000 0.00 0.00
Façades
Nord 42.87 3.18 1.00 0.30 1.00 0.07 0.242 3405.30 2.43
Nord EST 0.00 0.00 1.00 0.00 1.00 0.00 0.000 3255.56 0.00
EST 42.69 3.18 1.00 0.30 1.00 0.07 0.241 3083.63 2.19
Sud EST 0.00 0.00 1.00 0.00 1.00 0.00 0.000 2268.35 0.00
Sud 33.57 3.18 1.00 0.30 1.00 0.07 0.190 1430.89 0.80
Sud ouest 0.00 0.00 1.00 0.00 1.00 0.00 0.000 2261.70 0.00
Ouest 43.92 1.66 1.00 0.30 1.00 0.04 0.133 3094.72 0.63
Ouest Nord 0.00 0.00 1.00 0.00 1.00 0.00 0.000 3250.01 0.00
533.89 1.02 6.66
1.02
OUVERTURES Interventions
envisagées
Nord 1.68 5.00 1.00 0.68 0.68 0.003 3405.30 0.25
Nord EST 0.00 0.00 1.00 0.00 0.00 0.000 3255.56 0.00
EST 2.52 0.00 1.00 0.80 0.80 0.005 3083.63 0.40
Sud EST 0.00 0.00 1.00 0.00 0.00 0.000 2268.35 0.00
Sud 1.68 5.00 1.00 0.68 0.68 0.003 1430.89 0.11
Sud ouest 0.00 0.00 1.00 0.00 0.00 0.000 2261.70 0.00
Ouest 10.68 0.00 0.45 0.80 0.36 0.019 3094.72 0.77
Ouest Nord 0.00 0.00 1.00 0.00 0.00 0.000 3250.01 0.00
16.56 1.01 1.52
Apports internes nb heures Surchauffe en °C
Occupants 15.00 0.31
Eclairage 3.00 0.20
Appareils 3.00 0.55
1.07
9.25
Renouvelleme
nt d'air
en vol/h
coefficient
Rc
surchauffe avec
vent .en °C
Conventionnel 10 0.55 5.09
Calculé 30 0.29 2.68
SURCHAUFFE
TOTALE AVEC
VENTILATION
NATURELLE
Interventions envisagées Surface plancher
60.00
volume
135.00
5.00 7500.00
Total apports internes
Surchauffe totale potentielle sans renouvellement d'air
500.00
15.00 2700.00
70.00
60.00
Quantité Energie dissipéeInterventions envisagées Ratio
4.00 4200.00
Ensol Moy Surchauffe en °C
Total ouvertures
Ventilation
bardage/comble
Total parois opaques
Surface Conductance Masques
Facteur de
transmission
FtxFmasque
solaire
Pondération
surface
PAROIS OPAQUES
Surface Conductance Masques Couleur
Transmission
solaire
Poids
thermique
Ensol Moy
en Wh
Surchauffe en °C
Area ,Conductance, Shadow, color Overheating
Case Study: an urban block on Reunion Island
First step: block geometry and directional computations
(12 directions)
Case Study: an urban block on Reunion Island
Second step: ACH computations
(time step : every hour of a year)
Case Study: an urban block on Reunion Island
Third step: ACH statistics
Parameters:
Position of the openings
Wall porosity
Area of the windows
Internal porosity
Area of the doors
Area of the internal openings
CASES <ACH> ACH (P<0.05)
ACH MINI
North: 3 windows
South: 1 window
Doors: opened
65 Vol/h 9 Vol/h
North: 3 windows
South: 1 window
Doors: enlarged
90 Vol/h 13 Vol/h
North: 3 windows
South: 2 windows
(1.4 m² + 1 m²)
Doors: opened
105 Vol/h 15 Vol/h
North: 3 windows
South: 2 windows
(1.4 m² + 2 m²)
Doors: opened
140 Vol/h 19 Vol/h
North: 3 windows
South: 2 windows
(1.4 m² + 1 m²)
Doors: closed
(louver 0.5 m² above
the door)
80 Vol/h 10 Vol/h
North: 3 windows
South: 2 windows
(1.4 m² + 2 m²)
Doors: closed
(louver 0.5 m² above
the door)
115 Vol/h 15 Vol/h
Case Study: an urban block on Reunion Island
Fourth step: Thermal approach: how to reduce the
overheating of indoor air? Insulation and Ventilation
Climatic input data:
T<32°C => Ts<2°C
Who ‘s responsible?
0
5
10
15
20
25
30
35
Temperature(C)
Tmax
Tmin
0
100
200
300
400
500
600
700
800
900
1000
0 3 6 9 12 15 18 21 24
Solarflux(W/m²)
Hour
North East wall
Southeast wall
North west wall
Horizontal Roof
0
1
2
3
4
5
6
7
8
9
10
0 10 20 30 40 50
T(indoor)-T(outdoor)(C)
ACH (1/h)
Roof without insulation
Roof insulation
Roof and NE wall insulation
0
2
4
6
8
10
12
Twithoutventilation()
Without insulation
Roof with insulation
Roof and NE insulation
Conclusions
A simple method was developed to assess the comfort of buildings in
urban area in warm tropical climate.
A method was delevoped for designers who want to understand which
elements of the building are responsible for overheating.
A CFD-Network tool was combined with a thermal tool
Computation of the mass flow rates through the openings according to
the local climatology
Computation of the mean overheating temperature as comfort criteria
Many thanks !

Combined CFD-Mean energy balance methode to thermal comfort assessment of buildings in a warm tropical climate - Urbawind -BS 2011

  • 2.
    COMBINED CFD-MEAN ENERGYBALANCE METHOD TO THERMAL COMFORT ASSESSMENT OF BUILDINGS IN A WARM TROPICAL CLIMATE Stéphane Sanquer1, Mohamed Abdesselam2, Fabien Picgirard3 1Meteodyn, Nouméa, New Caledonia, France 2Solener, Lille, France 3Ademe, La Réunion, France
  • 3.
    BACKGROUND Reduce the energyconsumption in buildings located in warm tropical climates in overseas territories 17% of buildings use HVAC – this rate has doubled over the last 5 years – Energy providers could not support this increasing French energy agency ADEME needs rules and tools for existing buildings in order to make buildings comfortable without artificial cooling Designers and architects need simple methods to assess the indoor thermal comfort in warm tropical climates ADEME developed BATIPEI. It quickly and easily indicates if air conditioning is needed
  • 4.
    THERMAL COMFORT The thermalcomfort depends on Indoor temperature Air flow on occupants (>1 m/s ?) Air humidity The indoor temperature depends on Air change rate Thermal characteristics of the envelope A building is well designed according to the thermal comfort criteria if: An Indoor mean temperature is close to the mean outdoor temperature A maximum temperature is lower than the acceptable temperature Givoni diagram : Thermal dynamic simulation in an office at La Réunion Island during the summer (Garde R., 2006)
  • 5.
    HOW TO CALCULATETHE INDOOR TEMPERATURE ? Batipei was developed as a simple average method (Abdesselam, 1997) for tropical warm climates. Various parts of the building are identified within the energy balance to allow users to make adjustments based on comfort. Dynamic thermal modeling simulates the instantaneous physical behaviors of buildings with high accuracy. Numerous results are produced by DTM which requires an expert to link results to input data. BATIPEI is used as a pedagogical method for less experienced designers Both approaches are complementary: the decision depends on the building complexity and the budget devoted to design.
  • 6.
    HOW TO CALCULATETHE AIR CHANGE RATE Air change rate and indoor velocity fundamentally depend on the external wind pressure at the openings. Basic formula for crosswind ventilation (one volume , 2 openings) Aeq =Aerodynamic area of the openings Uwind = wind speed Cp1 et Cp2: pressure coefficients We need UWIND and Cp1 and Cp2 to calculate the mass flow rate. Tables (Liddament, Eurocode) and parametric models can be used for Standard cases, that means for simple, detached and isolated buildings. WINDeqWIND UCpCpAU CACA CpCp Q 21 2 2 2 2 2 1 2 1 21 11
  • 7.
    HOW TO CALCULATETHE AIR CHANGE RATE In urban configurations, wind velocity and pressure on buildings may not be easily evaluated. Tables and analytic models can not be used. Experimental approach (Wind tunnel) Numerical approach (CFD) Mass flow rate could be evaluated with a network model. The inputs are : -External pressure field -Characteristics of openings (A,C) -Indoor volume dimensions
  • 8.
    OBJECTIVE Develop a simplemethod to assess the comfort levels in buildings in urban areas with warm tropical climates. A CFD-Network tool combined to a thermal tool Computation of mass flow rates across the openings according to the local climatology: UrbaWind (meteodyn) Computation of the mean overheating temperature as a comfort criteria: BATIPEI (Ademe/Abdesselam) Case study: renovation of an entire block
  • 9.
    The combined CFD-meanbalance method The CFD Tool: Meshing  Automatic and non-structured  Horizontal and vertical refinement at key locations (points or physical surfaces)  Default: 50 cm horizontal, 20 cm vertical  For this application, only the outdoor spaces are meshed  Typical Radius: 300 m =>1 M cells
  • 10.
    The CFD calculationcomputes the outside flow and the pressure field UrbaWind solves the averaged equations of mass and momentum conservations (Navier-Stokes equations) for steady flow and the incompressible fluids. The turbulent fluxes are parameterized by using the turbulent viscosity considered as the product of a length scale by a speed scale which are both characteristic lengths of the turbulent fluctuations. LT varies linearly with the distance at the nearest wall (ground and buildings). The combined CFD-mean balance method The CFD Tool: Directional computations 0'' iji i j j i jij ij Fuu x u x u xx P x uu Tt Tj j i j j i T ik T i i Lk L k C x u x u x u x k ku x 2/1 2/3 and
  • 11.
    The CFD calculationcomputes the outside flow and the pressure field for every wind direction Velocity field Pressure field The combined CFD-mean balance method The CFD Tool: Directional computations
  • 12.
    The Network calculationcomputes ACH based on CFD pressure field The indoor pressure Pi is unknown and the flow rates through the openings are solved by a Newton-Raphson iterative process. where F’(Pi) is the first derivative of F(Pi) with respect to Pi , and w is an under- relaxation coefficient. In the case of a multi-volume configuration, the k openings’ aerodynamic area Ak is replaced by an equivalent aerodynamic surface taken into account the door aerodynamic surface Adoor The combined CFD-mean balance method The CFD Tool: Air Change Rate n i n i n i n i PFPFPP '1 /
  • 13.
    The Network partcomputes ACH based on CFD pressure field UrbaWind provides wind roses, distribution and time series of the Air Change Rate The combined CFD-mean balance method The CFD Tool: Air Change Rate -4000 -2000 0 2000 4000 6000 8000 10000 0 50 100 150 200 Massflowrate(m3/h) Time (h) Mass flow rate across each opening WIND VENTILATION
  • 14.
     Requirement ofTmax becomes a requirement of Ts, the daily overheating mean  Developed and validated for warm, oceanic tropical climates (BATIPEI ©)  Regardless of the thermal inertia, comfort is reached if Ts doesn’t exceed 2°C  The influence of inertia on Tmax is lower than ½°C: second order parameter compared to the influence of ACH The combined CFD-mean balance method The Thermal Tool: Computation of the mean overheating of air indoor 22 23 24 25 26 27 28 29 30 31 32 33 34 0 2 4 6 8 10 12 14 16 18 20 22 24 Indoortemperature(°C) Hour High Normal moderate Weak No inertia Inertia level Daily average temperature doesn't depend on inertia
  • 15.
    The combined CFD-meanbalance method The Thermal Tool: Computation of the mean overheating of air indoor The energy balance written on a daily cycle is: The gains: the solar radiation received by the room’s indoor air from the wall by conduction (Esun), transmitted directly through the openings (Eo), and the internal gains (Eint) The losses given to the environment by conduction through the envelope (Ec) or with the air change rate (Each).
  • 16.
    Ts, the meandaily overheating is estimated without ventilation Um: the mean conductance of the building D: specific mass flow rate The more insulated the building is (low value of Um), the more efficient the air change rate is. For medium sized isolated buildings (2<Um<4), the mean overheating is reduced about 2/3 as soon as ACH is in the range 10 to 20 volumes an hour. The combined CFD-mean balance method The Thermal Tool: Computation of the mean of overheating indoor air
  • 17.
    The combined CFD-meanbalance method The Thermal Tool: a simple tool for designers The roof and the walls The openings The internal gains Results: ACH=0 ACH(min) ACH(average) Interventions envisagées Toiture 185.42 0.51 1.00 0.80 0.60 0.01 0.168 7099.00 0.61 Plancher 185.42 0.00 0.00 0.000 0.00 0.00 Façades Nord 42.87 3.18 1.00 0.30 1.00 0.07 0.242 3405.30 2.43 Nord EST 0.00 0.00 1.00 0.00 1.00 0.00 0.000 3255.56 0.00 EST 42.69 3.18 1.00 0.30 1.00 0.07 0.241 3083.63 2.19 Sud EST 0.00 0.00 1.00 0.00 1.00 0.00 0.000 2268.35 0.00 Sud 33.57 3.18 1.00 0.30 1.00 0.07 0.190 1430.89 0.80 Sud ouest 0.00 0.00 1.00 0.00 1.00 0.00 0.000 2261.70 0.00 Ouest 43.92 1.66 1.00 0.30 1.00 0.04 0.133 3094.72 0.63 Ouest Nord 0.00 0.00 1.00 0.00 1.00 0.00 0.000 3250.01 0.00 533.89 1.02 6.66 1.02 OUVERTURES Interventions envisagées Nord 1.68 5.00 1.00 0.68 0.68 0.003 3405.30 0.25 Nord EST 0.00 0.00 1.00 0.00 0.00 0.000 3255.56 0.00 EST 2.52 0.00 1.00 0.80 0.80 0.005 3083.63 0.40 Sud EST 0.00 0.00 1.00 0.00 0.00 0.000 2268.35 0.00 Sud 1.68 5.00 1.00 0.68 0.68 0.003 1430.89 0.11 Sud ouest 0.00 0.00 1.00 0.00 0.00 0.000 2261.70 0.00 Ouest 10.68 0.00 0.45 0.80 0.36 0.019 3094.72 0.77 Ouest Nord 0.00 0.00 1.00 0.00 0.00 0.000 3250.01 0.00 16.56 1.01 1.52 Apports internes nb heures Surchauffe en °C Occupants 15.00 0.31 Eclairage 3.00 0.20 Appareils 3.00 0.55 1.07 9.25 Renouvelleme nt d'air en vol/h coefficient Rc surchauffe avec vent .en °C Conventionnel 10 0.55 5.09 Calculé 30 0.29 2.68 SURCHAUFFE TOTALE AVEC VENTILATION NATURELLE Interventions envisagées Surface plancher 60.00 volume 135.00 5.00 7500.00 Total apports internes Surchauffe totale potentielle sans renouvellement d'air 500.00 15.00 2700.00 70.00 60.00 Quantité Energie dissipéeInterventions envisagées Ratio 4.00 4200.00 Ensol Moy Surchauffe en °C Total ouvertures Ventilation bardage/comble Total parois opaques Surface Conductance Masques Facteur de transmission FtxFmasque solaire Pondération surface PAROIS OPAQUES Surface Conductance Masques Couleur Transmission solaire Poids thermique Ensol Moy en Wh Surchauffe en °C Area ,Conductance, Shadow, color Overheating
  • 18.
    Case Study: anurban block on Reunion Island First step: block geometry and directional computations (12 directions)
  • 19.
    Case Study: anurban block on Reunion Island Second step: ACH computations (time step : every hour of a year)
  • 20.
    Case Study: anurban block on Reunion Island Third step: ACH statistics Parameters: Position of the openings Wall porosity Area of the windows Internal porosity Area of the doors Area of the internal openings CASES <ACH> ACH (P<0.05) ACH MINI North: 3 windows South: 1 window Doors: opened 65 Vol/h 9 Vol/h North: 3 windows South: 1 window Doors: enlarged 90 Vol/h 13 Vol/h North: 3 windows South: 2 windows (1.4 m² + 1 m²) Doors: opened 105 Vol/h 15 Vol/h North: 3 windows South: 2 windows (1.4 m² + 2 m²) Doors: opened 140 Vol/h 19 Vol/h North: 3 windows South: 2 windows (1.4 m² + 1 m²) Doors: closed (louver 0.5 m² above the door) 80 Vol/h 10 Vol/h North: 3 windows South: 2 windows (1.4 m² + 2 m²) Doors: closed (louver 0.5 m² above the door) 115 Vol/h 15 Vol/h
  • 21.
    Case Study: anurban block on Reunion Island Fourth step: Thermal approach: how to reduce the overheating of indoor air? Insulation and Ventilation Climatic input data: T<32°C => Ts<2°C Who ‘s responsible? 0 5 10 15 20 25 30 35 Temperature(C) Tmax Tmin 0 100 200 300 400 500 600 700 800 900 1000 0 3 6 9 12 15 18 21 24 Solarflux(W/m²) Hour North East wall Southeast wall North west wall Horizontal Roof 0 1 2 3 4 5 6 7 8 9 10 0 10 20 30 40 50 T(indoor)-T(outdoor)(C) ACH (1/h) Roof without insulation Roof insulation Roof and NE wall insulation 0 2 4 6 8 10 12 Twithoutventilation() Without insulation Roof with insulation Roof and NE insulation
  • 22.
    Conclusions A simple methodwas developed to assess the comfort of buildings in urban area in warm tropical climate. A method was delevoped for designers who want to understand which elements of the building are responsible for overheating. A CFD-Network tool was combined with a thermal tool Computation of the mass flow rates through the openings according to the local climatology Computation of the mean overheating temperature as comfort criteria
  • 23.