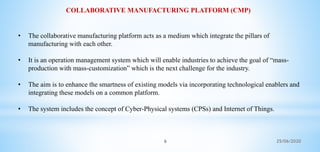
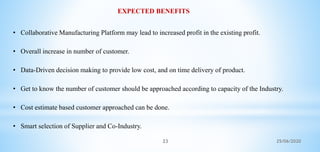
SlideShare a Scribd company logo
COLLABORATIVE MANUFACTURING PLATFORM FOR
INDUSTRY 4.0
by
Akshay Mate
DISCIPLINE OF MECHANICAL ENGINEERING
INDIAN INSTITUTE OF TECHNOLOGY INDORE
1 25/06/2020
2
CONTENTS
• Introduction
• Objective
• Literature Survey
• Collaborative Manufacturing Platform (CMP)
• Assumptions
• Model
• Parameters
• Cost Breakdown
• Analysis
• Conclusion
• Expected Benefits
• Future Scope
25/06/2020
3
INTRODUCTION
• Industry 4.0 is a promising approach based on integration of the business and manufacturing
processes, as well as integration of all factors in the company’s value chain (suppliers and customers).
• The goal is transformation of industrial manufacturing through digitalization and exploitation of
potentials of new technologies.
• Industry 4.0 is a production solution in a flexible and efficient way should be to meet the needs of
today's market, and achieves integration between the various industrial and non-industrial partners.
• Industry 4.0 production system is thus flexible and enables individualized and customized products.
25/06/2020
4
OBJECTIVES
• To establish a platform for achieving mass production with mass customization.
• To propose profit efficient decision making system.
• To achieve real time and remote planning decision making solution.
• To develop cost based customer approached model to get near real time demand.
25/06/2020
5
LITERATURE SURVEY
AUTHOR OBJECTIVE RESULTS & CONCLUSIONS
Elvis Hozdić, (2015) To provide review on type of integration, linking the physical
components of the production system and digital, abstract, virtual
components into a single system called cyber – physical production
systems.
• The development of production systems in the spirit of cyber –
physical production systems, use of digitization and e - business
imperative is to aspire to smart factories.
Dorleta Ibarra, et
al.(2017)
To suggest different approaches that make the firm closer to the
Industry 4.0
• Improvement of traditional Business Model due to an incremental
innovation of both, value creation and value delivery has been
defined.
• A new Business Model typology based on the smartization of
products and services has been proposed.
Pai ZHENG, et
al.((2018)
To present conceptual framework of smart manufacturing systems
for Industry 4.0 and demonstrative scenarios that involves smart
design, smart machining, smart control, smart monitoring, and
smart scheduling.
• A systematic framework for Industry 4.0 smart manufacturing
systems is proposed. The framework covers many relevant topics,
such as design, machining, monitoring, control, and scheduling.
• On the basis of the demonstrative scenarios, related key
technologies, such as Internet of Things, CPS are reviewed.
Luis M. et al. () To analyze the collaboration problems which are challenges of
Industry 4.0.
• Collaboration of all dimensions of Industry 4.0 vision and needs
along its six dimensions – horizontal integration, vertical
integration, acceleration of Manufacturing, through-engineering,
digitalization, and new business models – which helps to
recognize a large number of collaboration-related problems are
analyze.
25/06/2020
6
• The collaborative manufacturing platform acts as a medium which integrate the pillars of
manufacturing with each other.
• It is an operation management system which will enable industries to achieve the goal of “mass-
production with mass-customization” which is the next challenge for the industry.
• The aim is to enhance the smartness of existing models via incorporating technological enablers and
integrating these models on a common platform.
• The system includes the concept of Cyber-Physical systems (CPSs) and Internet of Things.
COLLABORATIVE MANUFACTURING PLATFORM (CMP)
25/06/2020
7
TECHNOLOGIES AND PILLARS
Cloud
Computing
Cyber
Security
Big data
Internet of
Things
Cyber Twin
Simulation
Additive
Manufacturing
Augmented
Reality
Robotics
Horizontal & Vertical
Integration
INDUSTRY
4.0
Industry
Co-Industry
Customer
Supplier
25/06/2020
8
Standalone Manufacturing
CC
C
C
CC
C
C
MCC
C
C
CC
C
C
M
CC
C
C
CC
C
C
M CC
C
C
CC
C
C
M
M
M
M
CC
C
C
CC
C
C
CC
C
C
CC
C
C
Data
Data
Data
Collaborative Manufacturing
Industry
Co-Industry
Co-Industry
C MCustomer Manufacturer Manufacturer NetworkCustomer Network
EVOLUTION OF MANUFACTURING NETWORK
25/06/2020
9
ASSUMPTIONS
• All machines are intelligent means IoT based.
• Each machines from industry and co-industry are connected to each other.
• Sharing of data is enable between Industry, Supplier and Co-Industry.
• Customer demand is going to increase, as this platform works well for existing industry.
• Decision and negotiation are done by smart machine.
25/06/2020
MANUFACTURING
STATION
ASSEMBLY
STATION
INSPECTION &
PACKING STATION
10
INDUSTRY
25/06/2020
11
Customer
Demand Pool
Recommender System
Social Network
Algorithm Interaction
Decision
Priorities Selection
Network Resource Sharing
Devices
Co-Industry
Industry
Suppliers
• Communication
• Negotiation
• Scheduling
1
2
3
4
MODEL
25/06/2020
1212
Supplier Price/gm
Quality
Factor
City
T + H
cost/spool
Lead Time
(Days)
A 1.4 0.95 X 120 2
B 1.2 0.98 Y 200 3
C 1 0.93 Z 320 6
Supplier
Material ( in spool)
5 10 18 30
A
Discoun
t(%)
5 7 8 10
B 6 8 10 12
C 7 9 11 14
WIRE A B C A B C
Demand 3 3 3 18.2796 18.2796 18.2796
Price/Gram 1.4 1.2 1 1.4 1.2 1
Material required 600 600 600 3655.92 3655.92 3655.92
Cost of Material 840 720 600 5118.288 4387.104 3655.92
Cost after Discount 840 720 600 4862.3736 4123.87776 3400.0056
T + H Cost (per Kg) 72 120 192 438.7104 731.184 1169.8944
Total Cost 912 840 792 5301.084 4855.06176 4569.9
Weightage(40%) Cost 34.74 36.84 40 31.63 36.64 40
Weightage(20%) Quality 19.38 20 18.98 19.38 20 18.98
Weightage(20%) Discount 0 0 0 14.28 17.14 20
Weightage(20%) Lead Time 20 10 6.67 20 10 6.67
Selection 74.12 66.84 65.65 85.29 83.78 85.65
Supplier Price/gm
Quality
Factor
City
T + H
cost/piece
Lead Time
(Days)
P 12 0.98 X 0.3 2
Q 9 0.95 Y 0.5 3
R 8 0.93 Z 0.8 6
Supplier
Quantity
50 100 180 300
P
Discoun
t(%)
5 7 8 10
Q 6 8 10 12
R 7 9 12 14
RING P Q R P Q R P Q R
Demand 3 3 3 18.28 18.28 18.28 48.84 48.84 48.84
Price/piece 12 9 8 12 9 8 12 9 8
Quantity 3 3 3 18.28 18.28 18.28 48.84 48.84 48.84
Cost of Material 36 27 24 219.36 164.52 146.24 586.08 439.56 390.72
Cost after Discount 36 27 24 219.36 164.52 146.24 556.776 413.1864 363.3696
T + H Cost (per Kg) 0.9 1.5 2.4 5.484 9.14 14.624 14.652 24.42 39.072
Total Cost 36.9 28.5 26.4 224.844 173.66 160.864 571.428 437.6064 402.4416
Weightage(40%) Cost 28.62 30.9 40 28.62 30.9 40 28.17 30.63 40
Weightage(20%) Quality 20 19.38 18.98 20 19.38 18.98 20 19.38 18.98
Weightage(20%) Discount 0 0 0 0 0 0 14.28 17.14 20
Weightage(20%) Lead Time 20 10 6.67 20 10 6.67 20 10 6.67
Selection 68.62 60.28 65.65 68.62 60.28 65.65 82.45 77.15 85.65
PARAMETERS
25/06/2020
13
Demand
Initial 3 3 3 3 3 3
Customer Approached 0 100 300 500 1000 1500
Customer Influence (60%) 0 60 180 300 600 900
Customer Category Loyal (25%)
0 9 27 45 90 135
Accept (60%)
Intermediate (35%)
0 5.25 15.75 26.25 52.5 78.75
Accept (25%)
Reject (40%)
0 3.6 10.8 18 36 54
Accept (15%)
Customer after Influence 0 17.85 53.55 89.25 178.5 267.75
Probability of order cancelation 20% 0 14.28 42.84 71.4 142.8 214.2
Probability of defective product 7% 0 15.2796 45.8388 76.398 152.796 229.194
Final Demand 3 18.2796 48.8388 79.398 155.796 232.194
Material Required
Wire (200 Grams) 600 3655.92 9767.76 15879.6 31159.2 46438.8
Ring 3.00 18.28 48.84 79.40 155.80 232.19
Supplier (Wire)
A
Material Cost 1.4 840 4862.3736 12717.6235 20452.9248 39260.592 58512.89
T + H Cost 120 72 438.7104 1172.1312 1905.552 3739.104 5572.656
Total 912 5301.084 13889.7547 22358.4768 42999.696 64085.54
B
Material Cost 1.2 720 4123.87776 10783.607 17149.968 32904.1152 49039.37
T + H Cost 200 120 731.184 1953.552 3175.92 6231.84 9287.76
Total 840 4855.06176 12737.159 20325.888 39135.9552 58327.13
C
Material Cost 1 600 3400.0056 8986.3392 14132.844 27420.096 40866.14
T + H Cost 320 192 1169.8944 3125.6832 5081.472 9970.944 14860.42
Total 792 4569.9 12112.0224 19214.316 37391.04 55726.56
Supplier (Ring)
P
Ring 12 36 219.3552 556.76232 886.08168 1719.98784 2507.695
T + H Cost 0.3 0.9 5.48388 14.65164 23.8194 46.7388 69.6582
Total 36.9 224.83908 571.41396 909.90108 1766.72664 2577.353
Q
Ring 9 27 164.5164 413.176248 657.41544 1261.9476 1838.976
T + H Cost 0.5 1.5 9.1398 24.4194 39.699 77.898 116.097
Total 28.5 173.6562 437.595648 697.11444 1339.8456 1955.073
R
Ring 8 24 146.2368 363.360672 578.01744 1096.80384 1597.495
T + H Cost 0.8 2.4 14.62368 39.07104 63.5184 124.6368 185.7552
Total 26.4 160.86048 402.431712 641.53584 1221.44064 1783.25
COST BREAKDOWN
25/06/2020
14
COST BREAKDOWN
DEMAND
3 18.28 48.84 79.4 155.796 232.2
DESIGN COST 500 500 500 500 500 500
MATERIAL COST(A/C DEMAND) 912 4569.9 13889.755 22358.4768 42999.696 64085.5
RING COST 36.9 224.84 402.44 641.54 1221.45 1783.25
PROCESSING COST(A/C DEMAND) 60 365.6 976.8 1588 1750 2100
LABOUR COST 60 365.6 976.8 1588 3115.92 4644
OVERHEAD COST 90 548.4 1465.2 2382 50 50
TOTAL COST 1658.9 6574.34 18210.995 29058.0168 49637.066 73162.75
COST/UNIT 552.9666667 359.6466083 372.8704955 365.9699849 318.6029551 315.085056
PROFIT (%) 25 25 25 25 25 25
SELLING PRICE/UNIT (COST/UNIT +
PROFIT)
691.2083333 449.5582604 466.0881194 457.4624811 398.2536939 393.85632
TOTAL SELLING PRICE 2073.625 8217.925 22763.74375 36322.521 62046.3325 91453.4375
DISCOUNT ON INCRASING DEMAND 0 5 8 10 12 15
SELLING PRICE/UNIT WITH DISCOUNT 691.2083333 427.0803474 428.8010698 411.716233 350.4632507 334.777872
TOTAL SELLING PRICE WITH DISCOUNT 2073.625 7807.02875 20942.64425 32690.2689 54600.7726 77735.42188
PROFIT PER UNIT 138.2416667 67.43373906 55.93057432 45.74624811 31.86029551 19.692816
NET PROFIT 414.725 1232.68875 2731.64925 3632.2521 4963.7066 4572.671875
Time Required (Mins) 90 548.4 1465.2 2382 4673.88 6966
Time Required (Hr) 1.5 9.14 24.42 39.7 77.898 116.1
Estimated Delivery Date 3 3 3 4 5 6
MODEL-1
25/06/2020
15
MODEL-2
Demand
Initial 5 5 5 5 5 5
Customer Approached 0 100 200 500 800 1000
Customer Influence (50%) 0 50 100 250 400 500
Customer Category Loyal (20%)
0 7 14 35 56 70
Accept (70%)
Intermediate (50%)
0 7.5 15 37.5 60 75
Accept (30%)
Reject (30%)
0 1.5 3 7.5 12 15
Accept (10%)
Customer after Influence 0 16 32 80 128 160
Probability of order cancelation 15% 0 13.6 27.2 68 108.8 136
Probability of defective product 5% 0 14.28 28.56 71.4 114.24 142.8
Final Demand 5 19.28 33.56 76.4 119.24 147.8
Material Required
Wire (200 Grams) 1000 3856 6712 15280 23848 29560
Ring 5.00 19.28 33.56 76.40 119.24 147.80
Supplier (Wire)
A
Material Cost 1.3 1300 5012.8 8725.6 19864 31002.4 38428
T + H Cost 100 100 385.6 671.2 1528 2384.8 2956
Total 1400 5398.4 9396.8 21392 33387.2 41384
B
Material Cost 1.2 1200 4627.2 8054.4 18336 28617.6 35472
T + H Cost 180 180 694.08 1208.16 2750.4 4292.64 5320.8
Total 1380 5321.28 9262.56 21086.4 32910.24 40792.8
C
Material Cost 1 1000 3856 6712 15280 23848 29560
T + H Cost 300 300 1156.8 2013.6 4584 7154.4 8868
Total 1300 5012.8 8725.6 19864 31002.4 38428
Supplier (Ring)
X
Ring 10 50 192.8 335.6 764 1192.4 1478
T + H Cost 0.2 1 3.856 6.712 15.28 23.848 29.56
Total 51 196.656 342.312 779.28 1216.248 1507.56
Y
Ring 8 40 154.24 268.48 611.2 953.92 1182.4
T + H Cost 0.4 2 7.712 13.424 30.56 47.696 59.12
Total 42 161.952 281.904 641.76 1001.616 1241.52
Z
Ring 6 30 115.68 201.36 458.4 715.44 886.8
T + H Cost 0.6 3 11.568 20.136 45.84 71.544 88.68
Total 33 127.248 221.496 504.24 786.984 975.48
25/06/2020
16
MODEL-2
COST BREAKDOWN
DEMAND
5 19.28 33.56 76.4 119.24 147.8
DESIGN COST 500 500 500 500 500 500
MATERIAL COST(A/C DEMAND) 1400 5398.4 9396.8 21392 33387.2 41384
RING COST 33 127.248 221.496 504.24 786.984 975.48
PROCESSING COST(A/C DEMAND) 100 385.6 671.2 1528 1750 2100
LABOUR COST 100 385.6 671.2 1528 2384.8 2956
OVERHEAD COST 150 578.4 1006.8 2292 50 50
TOTAL COST 2283 7375.248 12467.496 27744.24 38858.984 47965.48
COST/UNIT 456.6 382.53361 371.4986889 363.1445 325.88883 324.5296
PROFIT (%) 25 25 25 25 25 25
SELLING PRICE/UNIT (COST/UNIT + PROFIT) 570.75 478.1670124 464.3733611 453.93063 407.36104 405.662
TOTAL SELLING PRICE 2853.75 9219.06 15584.37 34680.3 48573.73 59956.85
DISCOUNT ON INCRASING DEMAND 0 5 8 10 12 15
SELLING PRICE/UNIT WITH DISCOUNT 570.75 454.2586618 427.2234923 408.53757 358.47771 344.8127
TOTAL SELLING PRICE WITH DISCOUNT 2853.75 8758.107 14337.6204 31212.27 42744.882 50963.32
PROFIT PER UNIT 114.15 71.72505187 55.72480334 45.393063 32.588883 20.2831
NET PROFIT 570.75 1382.859 1870.1244 3468.03 3885.8984 2997.843
Time Required (Mins) 150 578.4 1006.8 2292 3577.2 4434
Time Required (Hr) 2.5 9.64 16.78 38.2 59.62 73.9
Estimated Delivery Date 3 3 3 4 5 6
25/06/2020
ANALYSIS MODEL 1
17 25/06/2020
MODEL 2CONT’D…
25/06/202018
89
190.5
339.5
521.5
710.5
0
100
200
300
400
500
600
700
800
1 2 3 4 5
DEMAND
DEMAND PATTERN 91.11439394
86.98014888
84.70375672
81.93303177
80.79904228
74
76
78
80
82
84
86
88
90
92
1 2 3 4 5
COST/PIECE
COST PATTERN
Initial Demand Customer Approached Total Demand Industry(Cost/Piece) Time of Industry Outsourcing Qty Co-Industry(Cost/Piece) Lead Time of Co-Industry
3.5 304.5 89 91.11439394 3 54.5 117.3492437 3
4.5 882.5 190.5 86.98014888 6.5 17.5 398.15 3
5.5 2173.5 339.5 84.70375672 11 19.5 294.0625 3
3.5 2846 521.5 81.93303177 17 201.5 91.21394231 7
2 4468.5 710.5 80.79904228 22.5 390.5 78.87718449 17
19
IMPROVED MODEL (PYTHON)
25/06/2020
20
INDUSTRY RESULTS
25/06/2020
21
CO-INDUSTRY RESULTS
25/06/2020
25/06/202022
• Typical characteristics of the program include capacity calculation, availability of industry, failure
of the machine, defective product, customer probability, cost analysis, real-time scheduling, etc.
• Cost analysis, according to a smart selection of supplier and co-industry every time is done with
the change in demand.
• The intelligent selection of suppliers and co-industry through the algorithm ensures best possible
amalgamation of the lowest cost, best quality and availability.
CONCLUSION
23
EXPECTED BENEFITS
• Collaborative Manufacturing Platform may lead to increased profit in the existing profit.
• Overall increase in number of customer.
• Data-Driven decision making to provide low cost, and on time delivery of product.
• Get to know the number of customer should be approached according to capacity of the Industry.
• Cost estimate based customer approached can be done.
• Smart selection of Supplier and Co-Industry.
25/06/2020
24
FUTURE SCOPE
• Development of user friendly interactive User Interface which connects all the pillars of industry.
• Improve results by considering the other parameters like more number of machine, location of
co-industry, maintenance, seasonal effect.
• Implementing this platform at small scale to get actual results.
25/06/2020
25
THANK YOU
25/06/2020

More Related Content

Similar to Collaborative Manufacturing Platform for Industry 4.0

Evaluation of Service Performance & Analysis of Scope of Market
Evaluation of Service Performance & Analysis of Scope of MarketEvaluation of Service Performance & Analysis of Scope of Market
Evaluation of Service Performance & Analysis of Scope of Market
Sarvajeet Halder
 
Digital Transformation for Manufacturing Industries
Digital Transformation for Manufacturing IndustriesDigital Transformation for Manufacturing Industries
Digital Transformation for Manufacturing Industries
Margot Heiligman
 
Digital Transformation for Manufacturing Industries
Digital Transformation for Manufacturing IndustriesDigital Transformation for Manufacturing Industries
Digital Transformation for Manufacturing Industries
SAP Customer Experience
 
OECD workshop on measuring the link between public procurement, R&D and innov...
OECD workshop on measuring the link between public procurement, R&D and innov...OECD workshop on measuring the link between public procurement, R&D and innov...
OECD workshop on measuring the link between public procurement, R&D and innov...
STIEAS
 
Disruption oil-gas-upstream
Disruption oil-gas-upstreamDisruption oil-gas-upstream
Disruption oil-gas-upstream
Nurul Amri
 
PROJECT_REPORT_for_TERM_LOAN.doc
PROJECT_REPORT_for_TERM_LOAN.docPROJECT_REPORT_for_TERM_LOAN.doc
PROJECT_REPORT_for_TERM_LOAN.doc
MOHDARIF20884
 
Smart vertical parking system presentation
Smart vertical parking system presentationSmart vertical parking system presentation
Smart vertical parking system presentation
vinur897
 
Copper Sulphate- Manufacturing Plant, Detailed Project Report, Profile, Busin...
Copper Sulphate- Manufacturing Plant, Detailed Project Report, Profile, Busin...Copper Sulphate- Manufacturing Plant, Detailed Project Report, Profile, Busin...
Copper Sulphate- Manufacturing Plant, Detailed Project Report, Profile, Busin...
Ajjay Kumar Gupta
 
Artificial Grass Carpet Case Study
Artificial Grass Carpet Case StudyArtificial Grass Carpet Case Study
Artificial Grass Carpet Case Study
John William
 
wires and cables industry and Diamond Infrastructure Ltd
wires and cables industry and Diamond Infrastructure Ltdwires and cables industry and Diamond Infrastructure Ltd
wires and cables industry and Diamond Infrastructure Ltd
Nitin Bighane
 
ATS Company Reports: Finolex cables ltd
ATS Company Reports: Finolex cables ltdATS Company Reports: Finolex cables ltd
ATS Company Reports: Finolex cables ltd
Aditya Trading Solutions Pvt Ltd
 
TEAM GALILEO | National Management Olympiad Season 4 Quarter Final Stage BCS ...
TEAM GALILEO | National Management Olympiad Season 4 Quarter Final Stage BCS ...TEAM GALILEO | National Management Olympiad Season 4 Quarter Final Stage BCS ...
TEAM GALILEO | National Management Olympiad Season 4 Quarter Final Stage BCS ...
National Management Olympiad
 
Banglalink (VEON) Ennovators 2.0 Winning Idea Brochure
Banglalink (VEON) Ennovators 2.0 Winning Idea BrochureBanglalink (VEON) Ennovators 2.0 Winning Idea Brochure
Banglalink (VEON) Ennovators 2.0 Winning Idea Brochure
Md Asif Imrul
 
Projectppts
ProjectpptsProjectppts
Projectpptssavisca
 
MPG Engineering, Design, PLM, and Simulation Software Market Update - 2019
MPG Engineering, Design, PLM, and Simulation Software Market Update - 2019MPG Engineering, Design, PLM, and Simulation Software Market Update - 2019
MPG Engineering, Design, PLM, and Simulation Software Market Update - 2019
Madison Park Group
 
AT&S Investor and Analyst Presentation August 2016
AT&S Investor and Analyst Presentation August 2016AT&S Investor and Analyst Presentation August 2016
AT&S Investor and Analyst Presentation August 2016
AT&S_IR
 
ForldRite Furniture Co : PLANNING TO MEET A SURGE IN DEMAND
ForldRite Furniture Co :  PLANNING TO MEET A SURGE IN DEMANDForldRite Furniture Co :  PLANNING TO MEET A SURGE IN DEMAND
ForldRite Furniture Co : PLANNING TO MEET A SURGE IN DEMAND
aliyudhi_h
 
IMC ppt toyota ffff.pptx
IMC ppt toyota ffff.pptxIMC ppt toyota ffff.pptx
IMC ppt toyota ffff.pptx
Hira Naz
 

Similar to Collaborative Manufacturing Platform for Industry 4.0 (20)

Evaluation of Service Performance & Analysis of Scope of Market
Evaluation of Service Performance & Analysis of Scope of MarketEvaluation of Service Performance & Analysis of Scope of Market
Evaluation of Service Performance & Analysis of Scope of Market
 
Digital Transformation for Manufacturing Industries
Digital Transformation for Manufacturing IndustriesDigital Transformation for Manufacturing Industries
Digital Transformation for Manufacturing Industries
 
Digital Transformation for Manufacturing Industries
Digital Transformation for Manufacturing IndustriesDigital Transformation for Manufacturing Industries
Digital Transformation for Manufacturing Industries
 
OECD workshop on measuring the link between public procurement, R&D and innov...
OECD workshop on measuring the link between public procurement, R&D and innov...OECD workshop on measuring the link between public procurement, R&D and innov...
OECD workshop on measuring the link between public procurement, R&D and innov...
 
Disruption oil-gas-upstream
Disruption oil-gas-upstreamDisruption oil-gas-upstream
Disruption oil-gas-upstream
 
PROJECT_REPORT_for_TERM_LOAN.doc
PROJECT_REPORT_for_TERM_LOAN.docPROJECT_REPORT_for_TERM_LOAN.doc
PROJECT_REPORT_for_TERM_LOAN.doc
 
Smart vertical parking system presentation
Smart vertical parking system presentationSmart vertical parking system presentation
Smart vertical parking system presentation
 
PG thesis
PG thesisPG thesis
PG thesis
 
Copper Sulphate- Manufacturing Plant, Detailed Project Report, Profile, Busin...
Copper Sulphate- Manufacturing Plant, Detailed Project Report, Profile, Busin...Copper Sulphate- Manufacturing Plant, Detailed Project Report, Profile, Busin...
Copper Sulphate- Manufacturing Plant, Detailed Project Report, Profile, Busin...
 
Artificial Grass Carpet Case Study
Artificial Grass Carpet Case StudyArtificial Grass Carpet Case Study
Artificial Grass Carpet Case Study
 
wires and cables industry and Diamond Infrastructure Ltd
wires and cables industry and Diamond Infrastructure Ltdwires and cables industry and Diamond Infrastructure Ltd
wires and cables industry and Diamond Infrastructure Ltd
 
ATS Company Reports: Finolex cables ltd
ATS Company Reports: Finolex cables ltdATS Company Reports: Finolex cables ltd
ATS Company Reports: Finolex cables ltd
 
TEAM GALILEO | National Management Olympiad Season 4 Quarter Final Stage BCS ...
TEAM GALILEO | National Management Olympiad Season 4 Quarter Final Stage BCS ...TEAM GALILEO | National Management Olympiad Season 4 Quarter Final Stage BCS ...
TEAM GALILEO | National Management Olympiad Season 4 Quarter Final Stage BCS ...
 
Banglalink (VEON) Ennovators 2.0 Winning Idea Brochure
Banglalink (VEON) Ennovators 2.0 Winning Idea BrochureBanglalink (VEON) Ennovators 2.0 Winning Idea Brochure
Banglalink (VEON) Ennovators 2.0 Winning Idea Brochure
 
Projectppts
ProjectpptsProjectppts
Projectppts
 
MPG Engineering, Design, PLM, and Simulation Software Market Update - 2019
MPG Engineering, Design, PLM, and Simulation Software Market Update - 2019MPG Engineering, Design, PLM, and Simulation Software Market Update - 2019
MPG Engineering, Design, PLM, and Simulation Software Market Update - 2019
 
AT&S Investor and Analyst Presentation August 2016
AT&S Investor and Analyst Presentation August 2016AT&S Investor and Analyst Presentation August 2016
AT&S Investor and Analyst Presentation August 2016
 
ForldRite Furniture Co : PLANNING TO MEET A SURGE IN DEMAND
ForldRite Furniture Co :  PLANNING TO MEET A SURGE IN DEMANDForldRite Furniture Co :  PLANNING TO MEET A SURGE IN DEMAND
ForldRite Furniture Co : PLANNING TO MEET A SURGE IN DEMAND
 
Fold rite furniture v1.7
Fold rite furniture v1.7Fold rite furniture v1.7
Fold rite furniture v1.7
 
IMC ppt toyota ffff.pptx
IMC ppt toyota ffff.pptxIMC ppt toyota ffff.pptx
IMC ppt toyota ffff.pptx
 

Recently uploaded

space technology lecture notes on satellite
space technology lecture notes on satellitespace technology lecture notes on satellite
space technology lecture notes on satellite
ongomchris
 
The Benefits and Techniques of Trenchless Pipe Repair.pdf
The Benefits and Techniques of Trenchless Pipe Repair.pdfThe Benefits and Techniques of Trenchless Pipe Repair.pdf
The Benefits and Techniques of Trenchless Pipe Repair.pdf
Pipe Restoration Solutions
 
一比一原版(IIT毕业证)伊利诺伊理工大学毕业证成绩单专业办理
一比一原版(IIT毕业证)伊利诺伊理工大学毕业证成绩单专业办理一比一原版(IIT毕业证)伊利诺伊理工大学毕业证成绩单专业办理
一比一原版(IIT毕业证)伊利诺伊理工大学毕业证成绩单专业办理
zwunae
 
block diagram and signal flow graph representation
block diagram and signal flow graph representationblock diagram and signal flow graph representation
block diagram and signal flow graph representation
Divya Somashekar
 
J.Yang, ICLR 2024, MLILAB, KAIST AI.pdf
J.Yang,  ICLR 2024, MLILAB, KAIST AI.pdfJ.Yang,  ICLR 2024, MLILAB, KAIST AI.pdf
J.Yang, ICLR 2024, MLILAB, KAIST AI.pdf
MLILAB
 
road safety engineering r s e unit 3.pdf
road safety engineering  r s e unit 3.pdfroad safety engineering  r s e unit 3.pdf
road safety engineering r s e unit 3.pdf
VENKATESHvenky89705
 
一比一原版(SFU毕业证)西蒙菲莎大学毕业证成绩单如何办理
一比一原版(SFU毕业证)西蒙菲莎大学毕业证成绩单如何办理一比一原版(SFU毕业证)西蒙菲莎大学毕业证成绩单如何办理
一比一原版(SFU毕业证)西蒙菲莎大学毕业证成绩单如何办理
bakpo1
 
Architectural Portfolio Sean Lockwood
Architectural Portfolio Sean LockwoodArchitectural Portfolio Sean Lockwood
Architectural Portfolio Sean Lockwood
seandesed
 
CME397 Surface Engineering- Professional Elective
CME397 Surface Engineering- Professional ElectiveCME397 Surface Engineering- Professional Elective
CME397 Surface Engineering- Professional Elective
karthi keyan
 
ethical hacking in wireless-hacking1.ppt
ethical hacking in wireless-hacking1.pptethical hacking in wireless-hacking1.ppt
ethical hacking in wireless-hacking1.ppt
Jayaprasanna4
 
RAT: Retrieval Augmented Thoughts Elicit Context-Aware Reasoning in Long-Hori...
RAT: Retrieval Augmented Thoughts Elicit Context-Aware Reasoning in Long-Hori...RAT: Retrieval Augmented Thoughts Elicit Context-Aware Reasoning in Long-Hori...
RAT: Retrieval Augmented Thoughts Elicit Context-Aware Reasoning in Long-Hori...
thanhdowork
 
CFD Simulation of By-pass Flow in a HRSG module by R&R Consult.pptx
CFD Simulation of By-pass Flow in a HRSG module by R&R Consult.pptxCFD Simulation of By-pass Flow in a HRSG module by R&R Consult.pptx
CFD Simulation of By-pass Flow in a HRSG module by R&R Consult.pptx
R&R Consult
 
English lab ppt no titlespecENG PPTt.pdf
English lab ppt no titlespecENG PPTt.pdfEnglish lab ppt no titlespecENG PPTt.pdf
English lab ppt no titlespecENG PPTt.pdf
BrazilAccount1
 
Final project report on grocery store management system..pdf
Final project report on grocery store management system..pdfFinal project report on grocery store management system..pdf
Final project report on grocery store management system..pdf
Kamal Acharya
 
Cosmetic shop management system project report.pdf
Cosmetic shop management system project report.pdfCosmetic shop management system project report.pdf
Cosmetic shop management system project report.pdf
Kamal Acharya
 
ASME IX(9) 2007 Full Version .pdf
ASME IX(9)  2007 Full Version       .pdfASME IX(9)  2007 Full Version       .pdf
ASME IX(9) 2007 Full Version .pdf
AhmedHussein950959
 
一比一原版(UofT毕业证)多伦多大学毕业证成绩单如何办理
一比一原版(UofT毕业证)多伦多大学毕业证成绩单如何办理一比一原版(UofT毕业证)多伦多大学毕业证成绩单如何办理
一比一原版(UofT毕业证)多伦多大学毕业证成绩单如何办理
ydteq
 
WATER CRISIS and its solutions-pptx 1234
WATER CRISIS and its solutions-pptx 1234WATER CRISIS and its solutions-pptx 1234
WATER CRISIS and its solutions-pptx 1234
AafreenAbuthahir2
 
Design and Analysis of Algorithms-DP,Backtracking,Graphs,B&B
Design and Analysis of Algorithms-DP,Backtracking,Graphs,B&BDesign and Analysis of Algorithms-DP,Backtracking,Graphs,B&B
Design and Analysis of Algorithms-DP,Backtracking,Graphs,B&B
Sreedhar Chowdam
 
Top 10 Oil and Gas Projects in Saudi Arabia 2024.pdf
Top 10 Oil and Gas Projects in Saudi Arabia 2024.pdfTop 10 Oil and Gas Projects in Saudi Arabia 2024.pdf
Top 10 Oil and Gas Projects in Saudi Arabia 2024.pdf
Teleport Manpower Consultant
 

Recently uploaded (20)

space technology lecture notes on satellite
space technology lecture notes on satellitespace technology lecture notes on satellite
space technology lecture notes on satellite
 
The Benefits and Techniques of Trenchless Pipe Repair.pdf
The Benefits and Techniques of Trenchless Pipe Repair.pdfThe Benefits and Techniques of Trenchless Pipe Repair.pdf
The Benefits and Techniques of Trenchless Pipe Repair.pdf
 
一比一原版(IIT毕业证)伊利诺伊理工大学毕业证成绩单专业办理
一比一原版(IIT毕业证)伊利诺伊理工大学毕业证成绩单专业办理一比一原版(IIT毕业证)伊利诺伊理工大学毕业证成绩单专业办理
一比一原版(IIT毕业证)伊利诺伊理工大学毕业证成绩单专业办理
 
block diagram and signal flow graph representation
block diagram and signal flow graph representationblock diagram and signal flow graph representation
block diagram and signal flow graph representation
 
J.Yang, ICLR 2024, MLILAB, KAIST AI.pdf
J.Yang,  ICLR 2024, MLILAB, KAIST AI.pdfJ.Yang,  ICLR 2024, MLILAB, KAIST AI.pdf
J.Yang, ICLR 2024, MLILAB, KAIST AI.pdf
 
road safety engineering r s e unit 3.pdf
road safety engineering  r s e unit 3.pdfroad safety engineering  r s e unit 3.pdf
road safety engineering r s e unit 3.pdf
 
一比一原版(SFU毕业证)西蒙菲莎大学毕业证成绩单如何办理
一比一原版(SFU毕业证)西蒙菲莎大学毕业证成绩单如何办理一比一原版(SFU毕业证)西蒙菲莎大学毕业证成绩单如何办理
一比一原版(SFU毕业证)西蒙菲莎大学毕业证成绩单如何办理
 
Architectural Portfolio Sean Lockwood
Architectural Portfolio Sean LockwoodArchitectural Portfolio Sean Lockwood
Architectural Portfolio Sean Lockwood
 
CME397 Surface Engineering- Professional Elective
CME397 Surface Engineering- Professional ElectiveCME397 Surface Engineering- Professional Elective
CME397 Surface Engineering- Professional Elective
 
ethical hacking in wireless-hacking1.ppt
ethical hacking in wireless-hacking1.pptethical hacking in wireless-hacking1.ppt
ethical hacking in wireless-hacking1.ppt
 
RAT: Retrieval Augmented Thoughts Elicit Context-Aware Reasoning in Long-Hori...
RAT: Retrieval Augmented Thoughts Elicit Context-Aware Reasoning in Long-Hori...RAT: Retrieval Augmented Thoughts Elicit Context-Aware Reasoning in Long-Hori...
RAT: Retrieval Augmented Thoughts Elicit Context-Aware Reasoning in Long-Hori...
 
CFD Simulation of By-pass Flow in a HRSG module by R&R Consult.pptx
CFD Simulation of By-pass Flow in a HRSG module by R&R Consult.pptxCFD Simulation of By-pass Flow in a HRSG module by R&R Consult.pptx
CFD Simulation of By-pass Flow in a HRSG module by R&R Consult.pptx
 
English lab ppt no titlespecENG PPTt.pdf
English lab ppt no titlespecENG PPTt.pdfEnglish lab ppt no titlespecENG PPTt.pdf
English lab ppt no titlespecENG PPTt.pdf
 
Final project report on grocery store management system..pdf
Final project report on grocery store management system..pdfFinal project report on grocery store management system..pdf
Final project report on grocery store management system..pdf
 
Cosmetic shop management system project report.pdf
Cosmetic shop management system project report.pdfCosmetic shop management system project report.pdf
Cosmetic shop management system project report.pdf
 
ASME IX(9) 2007 Full Version .pdf
ASME IX(9)  2007 Full Version       .pdfASME IX(9)  2007 Full Version       .pdf
ASME IX(9) 2007 Full Version .pdf
 
一比一原版(UofT毕业证)多伦多大学毕业证成绩单如何办理
一比一原版(UofT毕业证)多伦多大学毕业证成绩单如何办理一比一原版(UofT毕业证)多伦多大学毕业证成绩单如何办理
一比一原版(UofT毕业证)多伦多大学毕业证成绩单如何办理
 
WATER CRISIS and its solutions-pptx 1234
WATER CRISIS and its solutions-pptx 1234WATER CRISIS and its solutions-pptx 1234
WATER CRISIS and its solutions-pptx 1234
 
Design and Analysis of Algorithms-DP,Backtracking,Graphs,B&B
Design and Analysis of Algorithms-DP,Backtracking,Graphs,B&BDesign and Analysis of Algorithms-DP,Backtracking,Graphs,B&B
Design and Analysis of Algorithms-DP,Backtracking,Graphs,B&B
 
Top 10 Oil and Gas Projects in Saudi Arabia 2024.pdf
Top 10 Oil and Gas Projects in Saudi Arabia 2024.pdfTop 10 Oil and Gas Projects in Saudi Arabia 2024.pdf
Top 10 Oil and Gas Projects in Saudi Arabia 2024.pdf
 

Collaborative Manufacturing Platform for Industry 4.0

  • 1. COLLABORATIVE MANUFACTURING PLATFORM FOR INDUSTRY 4.0 by Akshay Mate DISCIPLINE OF MECHANICAL ENGINEERING INDIAN INSTITUTE OF TECHNOLOGY INDORE 1 25/06/2020
  • 2. 2 CONTENTS • Introduction • Objective • Literature Survey • Collaborative Manufacturing Platform (CMP) • Assumptions • Model • Parameters • Cost Breakdown • Analysis • Conclusion • Expected Benefits • Future Scope 25/06/2020
  • 3. 3 INTRODUCTION • Industry 4.0 is a promising approach based on integration of the business and manufacturing processes, as well as integration of all factors in the company’s value chain (suppliers and customers). • The goal is transformation of industrial manufacturing through digitalization and exploitation of potentials of new technologies. • Industry 4.0 is a production solution in a flexible and efficient way should be to meet the needs of today's market, and achieves integration between the various industrial and non-industrial partners. • Industry 4.0 production system is thus flexible and enables individualized and customized products. 25/06/2020
  • 4. 4 OBJECTIVES • To establish a platform for achieving mass production with mass customization. • To propose profit efficient decision making system. • To achieve real time and remote planning decision making solution. • To develop cost based customer approached model to get near real time demand. 25/06/2020
  • 5. 5 LITERATURE SURVEY AUTHOR OBJECTIVE RESULTS & CONCLUSIONS Elvis Hozdić, (2015) To provide review on type of integration, linking the physical components of the production system and digital, abstract, virtual components into a single system called cyber – physical production systems. • The development of production systems in the spirit of cyber – physical production systems, use of digitization and e - business imperative is to aspire to smart factories. Dorleta Ibarra, et al.(2017) To suggest different approaches that make the firm closer to the Industry 4.0 • Improvement of traditional Business Model due to an incremental innovation of both, value creation and value delivery has been defined. • A new Business Model typology based on the smartization of products and services has been proposed. Pai ZHENG, et al.((2018) To present conceptual framework of smart manufacturing systems for Industry 4.0 and demonstrative scenarios that involves smart design, smart machining, smart control, smart monitoring, and smart scheduling. • A systematic framework for Industry 4.0 smart manufacturing systems is proposed. The framework covers many relevant topics, such as design, machining, monitoring, control, and scheduling. • On the basis of the demonstrative scenarios, related key technologies, such as Internet of Things, CPS are reviewed. Luis M. et al. () To analyze the collaboration problems which are challenges of Industry 4.0. • Collaboration of all dimensions of Industry 4.0 vision and needs along its six dimensions – horizontal integration, vertical integration, acceleration of Manufacturing, through-engineering, digitalization, and new business models – which helps to recognize a large number of collaboration-related problems are analyze. 25/06/2020
  • 6. 6 • The collaborative manufacturing platform acts as a medium which integrate the pillars of manufacturing with each other. • It is an operation management system which will enable industries to achieve the goal of “mass- production with mass-customization” which is the next challenge for the industry. • The aim is to enhance the smartness of existing models via incorporating technological enablers and integrating these models on a common platform. • The system includes the concept of Cyber-Physical systems (CPSs) and Internet of Things. COLLABORATIVE MANUFACTURING PLATFORM (CMP) 25/06/2020
  • 7. 7 TECHNOLOGIES AND PILLARS Cloud Computing Cyber Security Big data Internet of Things Cyber Twin Simulation Additive Manufacturing Augmented Reality Robotics Horizontal & Vertical Integration INDUSTRY 4.0 Industry Co-Industry Customer Supplier 25/06/2020
  • 8. 8 Standalone Manufacturing CC C C CC C C MCC C C CC C C M CC C C CC C C M CC C C CC C C M M M M CC C C CC C C CC C C CC C C Data Data Data Collaborative Manufacturing Industry Co-Industry Co-Industry C MCustomer Manufacturer Manufacturer NetworkCustomer Network EVOLUTION OF MANUFACTURING NETWORK 25/06/2020
  • 9. 9 ASSUMPTIONS • All machines are intelligent means IoT based. • Each machines from industry and co-industry are connected to each other. • Sharing of data is enable between Industry, Supplier and Co-Industry. • Customer demand is going to increase, as this platform works well for existing industry. • Decision and negotiation are done by smart machine. 25/06/2020
  • 11. 11 Customer Demand Pool Recommender System Social Network Algorithm Interaction Decision Priorities Selection Network Resource Sharing Devices Co-Industry Industry Suppliers • Communication • Negotiation • Scheduling 1 2 3 4 MODEL 25/06/2020
  • 12. 1212 Supplier Price/gm Quality Factor City T + H cost/spool Lead Time (Days) A 1.4 0.95 X 120 2 B 1.2 0.98 Y 200 3 C 1 0.93 Z 320 6 Supplier Material ( in spool) 5 10 18 30 A Discoun t(%) 5 7 8 10 B 6 8 10 12 C 7 9 11 14 WIRE A B C A B C Demand 3 3 3 18.2796 18.2796 18.2796 Price/Gram 1.4 1.2 1 1.4 1.2 1 Material required 600 600 600 3655.92 3655.92 3655.92 Cost of Material 840 720 600 5118.288 4387.104 3655.92 Cost after Discount 840 720 600 4862.3736 4123.87776 3400.0056 T + H Cost (per Kg) 72 120 192 438.7104 731.184 1169.8944 Total Cost 912 840 792 5301.084 4855.06176 4569.9 Weightage(40%) Cost 34.74 36.84 40 31.63 36.64 40 Weightage(20%) Quality 19.38 20 18.98 19.38 20 18.98 Weightage(20%) Discount 0 0 0 14.28 17.14 20 Weightage(20%) Lead Time 20 10 6.67 20 10 6.67 Selection 74.12 66.84 65.65 85.29 83.78 85.65 Supplier Price/gm Quality Factor City T + H cost/piece Lead Time (Days) P 12 0.98 X 0.3 2 Q 9 0.95 Y 0.5 3 R 8 0.93 Z 0.8 6 Supplier Quantity 50 100 180 300 P Discoun t(%) 5 7 8 10 Q 6 8 10 12 R 7 9 12 14 RING P Q R P Q R P Q R Demand 3 3 3 18.28 18.28 18.28 48.84 48.84 48.84 Price/piece 12 9 8 12 9 8 12 9 8 Quantity 3 3 3 18.28 18.28 18.28 48.84 48.84 48.84 Cost of Material 36 27 24 219.36 164.52 146.24 586.08 439.56 390.72 Cost after Discount 36 27 24 219.36 164.52 146.24 556.776 413.1864 363.3696 T + H Cost (per Kg) 0.9 1.5 2.4 5.484 9.14 14.624 14.652 24.42 39.072 Total Cost 36.9 28.5 26.4 224.844 173.66 160.864 571.428 437.6064 402.4416 Weightage(40%) Cost 28.62 30.9 40 28.62 30.9 40 28.17 30.63 40 Weightage(20%) Quality 20 19.38 18.98 20 19.38 18.98 20 19.38 18.98 Weightage(20%) Discount 0 0 0 0 0 0 14.28 17.14 20 Weightage(20%) Lead Time 20 10 6.67 20 10 6.67 20 10 6.67 Selection 68.62 60.28 65.65 68.62 60.28 65.65 82.45 77.15 85.65 PARAMETERS 25/06/2020
  • 13. 13 Demand Initial 3 3 3 3 3 3 Customer Approached 0 100 300 500 1000 1500 Customer Influence (60%) 0 60 180 300 600 900 Customer Category Loyal (25%) 0 9 27 45 90 135 Accept (60%) Intermediate (35%) 0 5.25 15.75 26.25 52.5 78.75 Accept (25%) Reject (40%) 0 3.6 10.8 18 36 54 Accept (15%) Customer after Influence 0 17.85 53.55 89.25 178.5 267.75 Probability of order cancelation 20% 0 14.28 42.84 71.4 142.8 214.2 Probability of defective product 7% 0 15.2796 45.8388 76.398 152.796 229.194 Final Demand 3 18.2796 48.8388 79.398 155.796 232.194 Material Required Wire (200 Grams) 600 3655.92 9767.76 15879.6 31159.2 46438.8 Ring 3.00 18.28 48.84 79.40 155.80 232.19 Supplier (Wire) A Material Cost 1.4 840 4862.3736 12717.6235 20452.9248 39260.592 58512.89 T + H Cost 120 72 438.7104 1172.1312 1905.552 3739.104 5572.656 Total 912 5301.084 13889.7547 22358.4768 42999.696 64085.54 B Material Cost 1.2 720 4123.87776 10783.607 17149.968 32904.1152 49039.37 T + H Cost 200 120 731.184 1953.552 3175.92 6231.84 9287.76 Total 840 4855.06176 12737.159 20325.888 39135.9552 58327.13 C Material Cost 1 600 3400.0056 8986.3392 14132.844 27420.096 40866.14 T + H Cost 320 192 1169.8944 3125.6832 5081.472 9970.944 14860.42 Total 792 4569.9 12112.0224 19214.316 37391.04 55726.56 Supplier (Ring) P Ring 12 36 219.3552 556.76232 886.08168 1719.98784 2507.695 T + H Cost 0.3 0.9 5.48388 14.65164 23.8194 46.7388 69.6582 Total 36.9 224.83908 571.41396 909.90108 1766.72664 2577.353 Q Ring 9 27 164.5164 413.176248 657.41544 1261.9476 1838.976 T + H Cost 0.5 1.5 9.1398 24.4194 39.699 77.898 116.097 Total 28.5 173.6562 437.595648 697.11444 1339.8456 1955.073 R Ring 8 24 146.2368 363.360672 578.01744 1096.80384 1597.495 T + H Cost 0.8 2.4 14.62368 39.07104 63.5184 124.6368 185.7552 Total 26.4 160.86048 402.431712 641.53584 1221.44064 1783.25 COST BREAKDOWN 25/06/2020
  • 14. 14 COST BREAKDOWN DEMAND 3 18.28 48.84 79.4 155.796 232.2 DESIGN COST 500 500 500 500 500 500 MATERIAL COST(A/C DEMAND) 912 4569.9 13889.755 22358.4768 42999.696 64085.5 RING COST 36.9 224.84 402.44 641.54 1221.45 1783.25 PROCESSING COST(A/C DEMAND) 60 365.6 976.8 1588 1750 2100 LABOUR COST 60 365.6 976.8 1588 3115.92 4644 OVERHEAD COST 90 548.4 1465.2 2382 50 50 TOTAL COST 1658.9 6574.34 18210.995 29058.0168 49637.066 73162.75 COST/UNIT 552.9666667 359.6466083 372.8704955 365.9699849 318.6029551 315.085056 PROFIT (%) 25 25 25 25 25 25 SELLING PRICE/UNIT (COST/UNIT + PROFIT) 691.2083333 449.5582604 466.0881194 457.4624811 398.2536939 393.85632 TOTAL SELLING PRICE 2073.625 8217.925 22763.74375 36322.521 62046.3325 91453.4375 DISCOUNT ON INCRASING DEMAND 0 5 8 10 12 15 SELLING PRICE/UNIT WITH DISCOUNT 691.2083333 427.0803474 428.8010698 411.716233 350.4632507 334.777872 TOTAL SELLING PRICE WITH DISCOUNT 2073.625 7807.02875 20942.64425 32690.2689 54600.7726 77735.42188 PROFIT PER UNIT 138.2416667 67.43373906 55.93057432 45.74624811 31.86029551 19.692816 NET PROFIT 414.725 1232.68875 2731.64925 3632.2521 4963.7066 4572.671875 Time Required (Mins) 90 548.4 1465.2 2382 4673.88 6966 Time Required (Hr) 1.5 9.14 24.42 39.7 77.898 116.1 Estimated Delivery Date 3 3 3 4 5 6 MODEL-1 25/06/2020
  • 15. 15 MODEL-2 Demand Initial 5 5 5 5 5 5 Customer Approached 0 100 200 500 800 1000 Customer Influence (50%) 0 50 100 250 400 500 Customer Category Loyal (20%) 0 7 14 35 56 70 Accept (70%) Intermediate (50%) 0 7.5 15 37.5 60 75 Accept (30%) Reject (30%) 0 1.5 3 7.5 12 15 Accept (10%) Customer after Influence 0 16 32 80 128 160 Probability of order cancelation 15% 0 13.6 27.2 68 108.8 136 Probability of defective product 5% 0 14.28 28.56 71.4 114.24 142.8 Final Demand 5 19.28 33.56 76.4 119.24 147.8 Material Required Wire (200 Grams) 1000 3856 6712 15280 23848 29560 Ring 5.00 19.28 33.56 76.40 119.24 147.80 Supplier (Wire) A Material Cost 1.3 1300 5012.8 8725.6 19864 31002.4 38428 T + H Cost 100 100 385.6 671.2 1528 2384.8 2956 Total 1400 5398.4 9396.8 21392 33387.2 41384 B Material Cost 1.2 1200 4627.2 8054.4 18336 28617.6 35472 T + H Cost 180 180 694.08 1208.16 2750.4 4292.64 5320.8 Total 1380 5321.28 9262.56 21086.4 32910.24 40792.8 C Material Cost 1 1000 3856 6712 15280 23848 29560 T + H Cost 300 300 1156.8 2013.6 4584 7154.4 8868 Total 1300 5012.8 8725.6 19864 31002.4 38428 Supplier (Ring) X Ring 10 50 192.8 335.6 764 1192.4 1478 T + H Cost 0.2 1 3.856 6.712 15.28 23.848 29.56 Total 51 196.656 342.312 779.28 1216.248 1507.56 Y Ring 8 40 154.24 268.48 611.2 953.92 1182.4 T + H Cost 0.4 2 7.712 13.424 30.56 47.696 59.12 Total 42 161.952 281.904 641.76 1001.616 1241.52 Z Ring 6 30 115.68 201.36 458.4 715.44 886.8 T + H Cost 0.6 3 11.568 20.136 45.84 71.544 88.68 Total 33 127.248 221.496 504.24 786.984 975.48 25/06/2020
  • 16. 16 MODEL-2 COST BREAKDOWN DEMAND 5 19.28 33.56 76.4 119.24 147.8 DESIGN COST 500 500 500 500 500 500 MATERIAL COST(A/C DEMAND) 1400 5398.4 9396.8 21392 33387.2 41384 RING COST 33 127.248 221.496 504.24 786.984 975.48 PROCESSING COST(A/C DEMAND) 100 385.6 671.2 1528 1750 2100 LABOUR COST 100 385.6 671.2 1528 2384.8 2956 OVERHEAD COST 150 578.4 1006.8 2292 50 50 TOTAL COST 2283 7375.248 12467.496 27744.24 38858.984 47965.48 COST/UNIT 456.6 382.53361 371.4986889 363.1445 325.88883 324.5296 PROFIT (%) 25 25 25 25 25 25 SELLING PRICE/UNIT (COST/UNIT + PROFIT) 570.75 478.1670124 464.3733611 453.93063 407.36104 405.662 TOTAL SELLING PRICE 2853.75 9219.06 15584.37 34680.3 48573.73 59956.85 DISCOUNT ON INCRASING DEMAND 0 5 8 10 12 15 SELLING PRICE/UNIT WITH DISCOUNT 570.75 454.2586618 427.2234923 408.53757 358.47771 344.8127 TOTAL SELLING PRICE WITH DISCOUNT 2853.75 8758.107 14337.6204 31212.27 42744.882 50963.32 PROFIT PER UNIT 114.15 71.72505187 55.72480334 45.393063 32.588883 20.2831 NET PROFIT 570.75 1382.859 1870.1244 3468.03 3885.8984 2997.843 Time Required (Mins) 150 578.4 1006.8 2292 3577.2 4434 Time Required (Hr) 2.5 9.64 16.78 38.2 59.62 73.9 Estimated Delivery Date 3 3 3 4 5 6 25/06/2020
  • 17. ANALYSIS MODEL 1 17 25/06/2020
  • 19. 89 190.5 339.5 521.5 710.5 0 100 200 300 400 500 600 700 800 1 2 3 4 5 DEMAND DEMAND PATTERN 91.11439394 86.98014888 84.70375672 81.93303177 80.79904228 74 76 78 80 82 84 86 88 90 92 1 2 3 4 5 COST/PIECE COST PATTERN Initial Demand Customer Approached Total Demand Industry(Cost/Piece) Time of Industry Outsourcing Qty Co-Industry(Cost/Piece) Lead Time of Co-Industry 3.5 304.5 89 91.11439394 3 54.5 117.3492437 3 4.5 882.5 190.5 86.98014888 6.5 17.5 398.15 3 5.5 2173.5 339.5 84.70375672 11 19.5 294.0625 3 3.5 2846 521.5 81.93303177 17 201.5 91.21394231 7 2 4468.5 710.5 80.79904228 22.5 390.5 78.87718449 17 19 IMPROVED MODEL (PYTHON) 25/06/2020
  • 22. 25/06/202022 • Typical characteristics of the program include capacity calculation, availability of industry, failure of the machine, defective product, customer probability, cost analysis, real-time scheduling, etc. • Cost analysis, according to a smart selection of supplier and co-industry every time is done with the change in demand. • The intelligent selection of suppliers and co-industry through the algorithm ensures best possible amalgamation of the lowest cost, best quality and availability. CONCLUSION
  • 23. 23 EXPECTED BENEFITS • Collaborative Manufacturing Platform may lead to increased profit in the existing profit. • Overall increase in number of customer. • Data-Driven decision making to provide low cost, and on time delivery of product. • Get to know the number of customer should be approached according to capacity of the Industry. • Cost estimate based customer approached can be done. • Smart selection of Supplier and Co-Industry. 25/06/2020
  • 24. 24 FUTURE SCOPE • Development of user friendly interactive User Interface which connects all the pillars of industry. • Improve results by considering the other parameters like more number of machine, location of co-industry, maintenance, seasonal effect. • Implementing this platform at small scale to get actual results. 25/06/2020