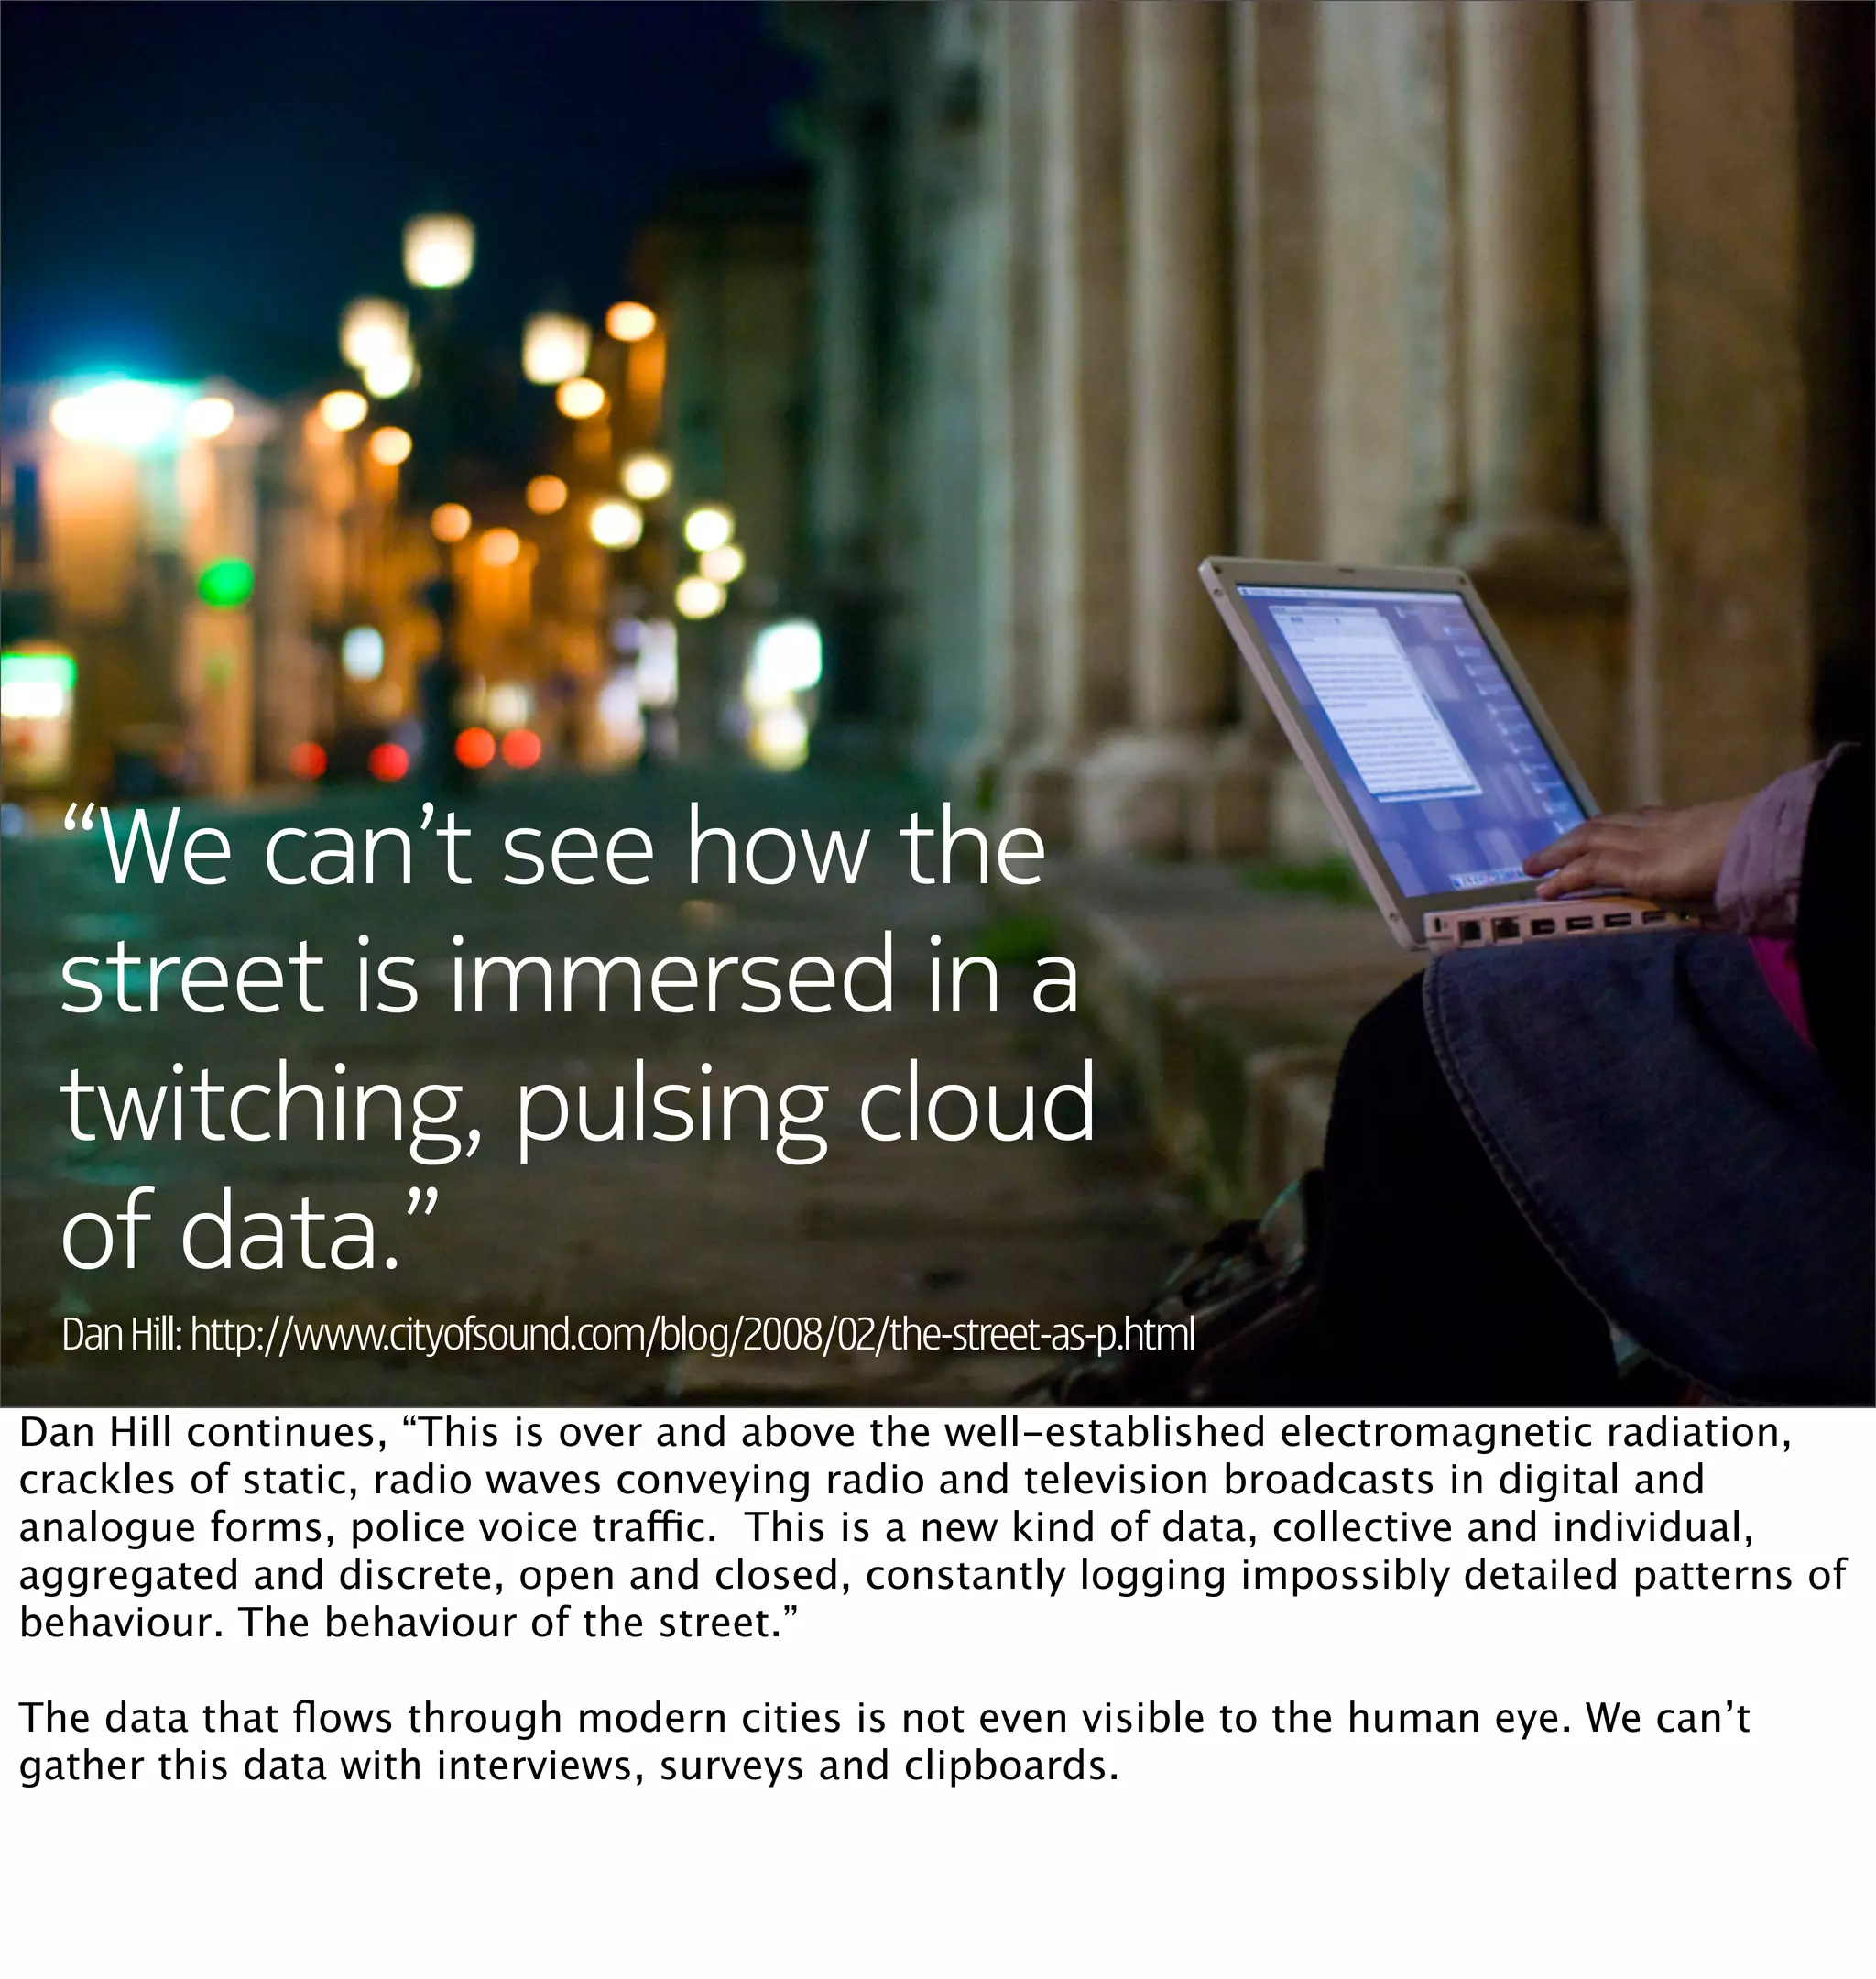
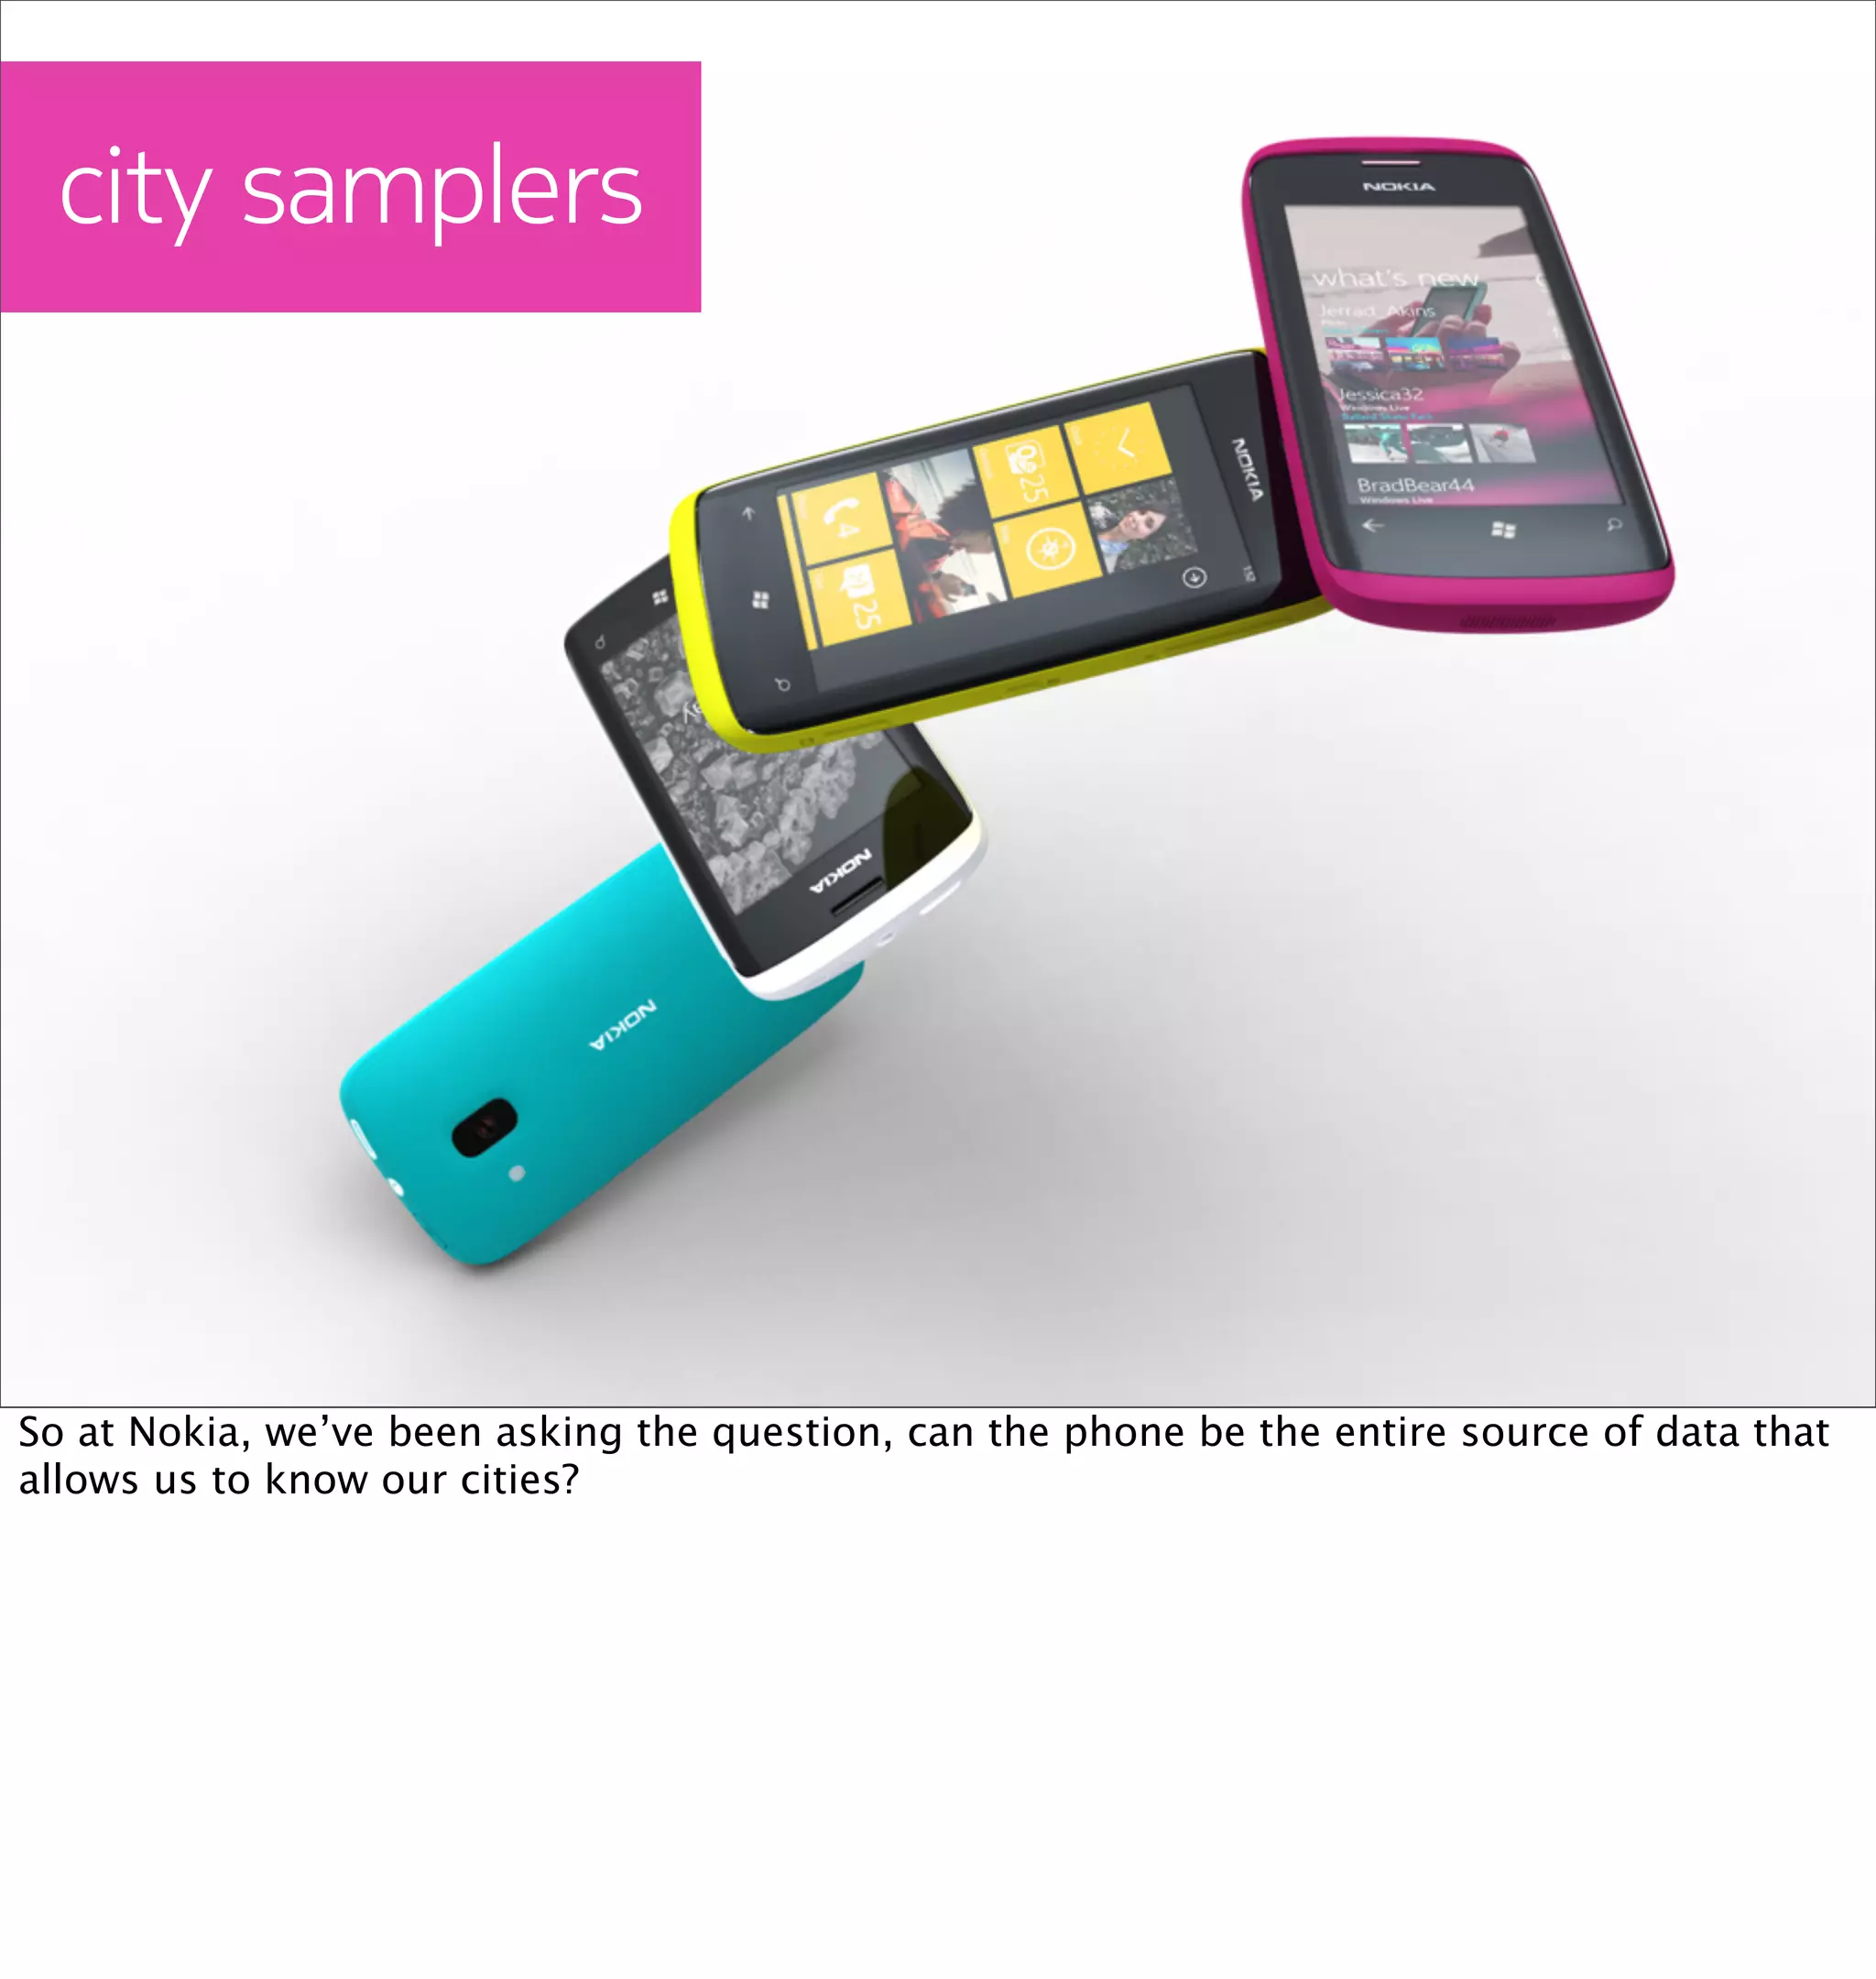
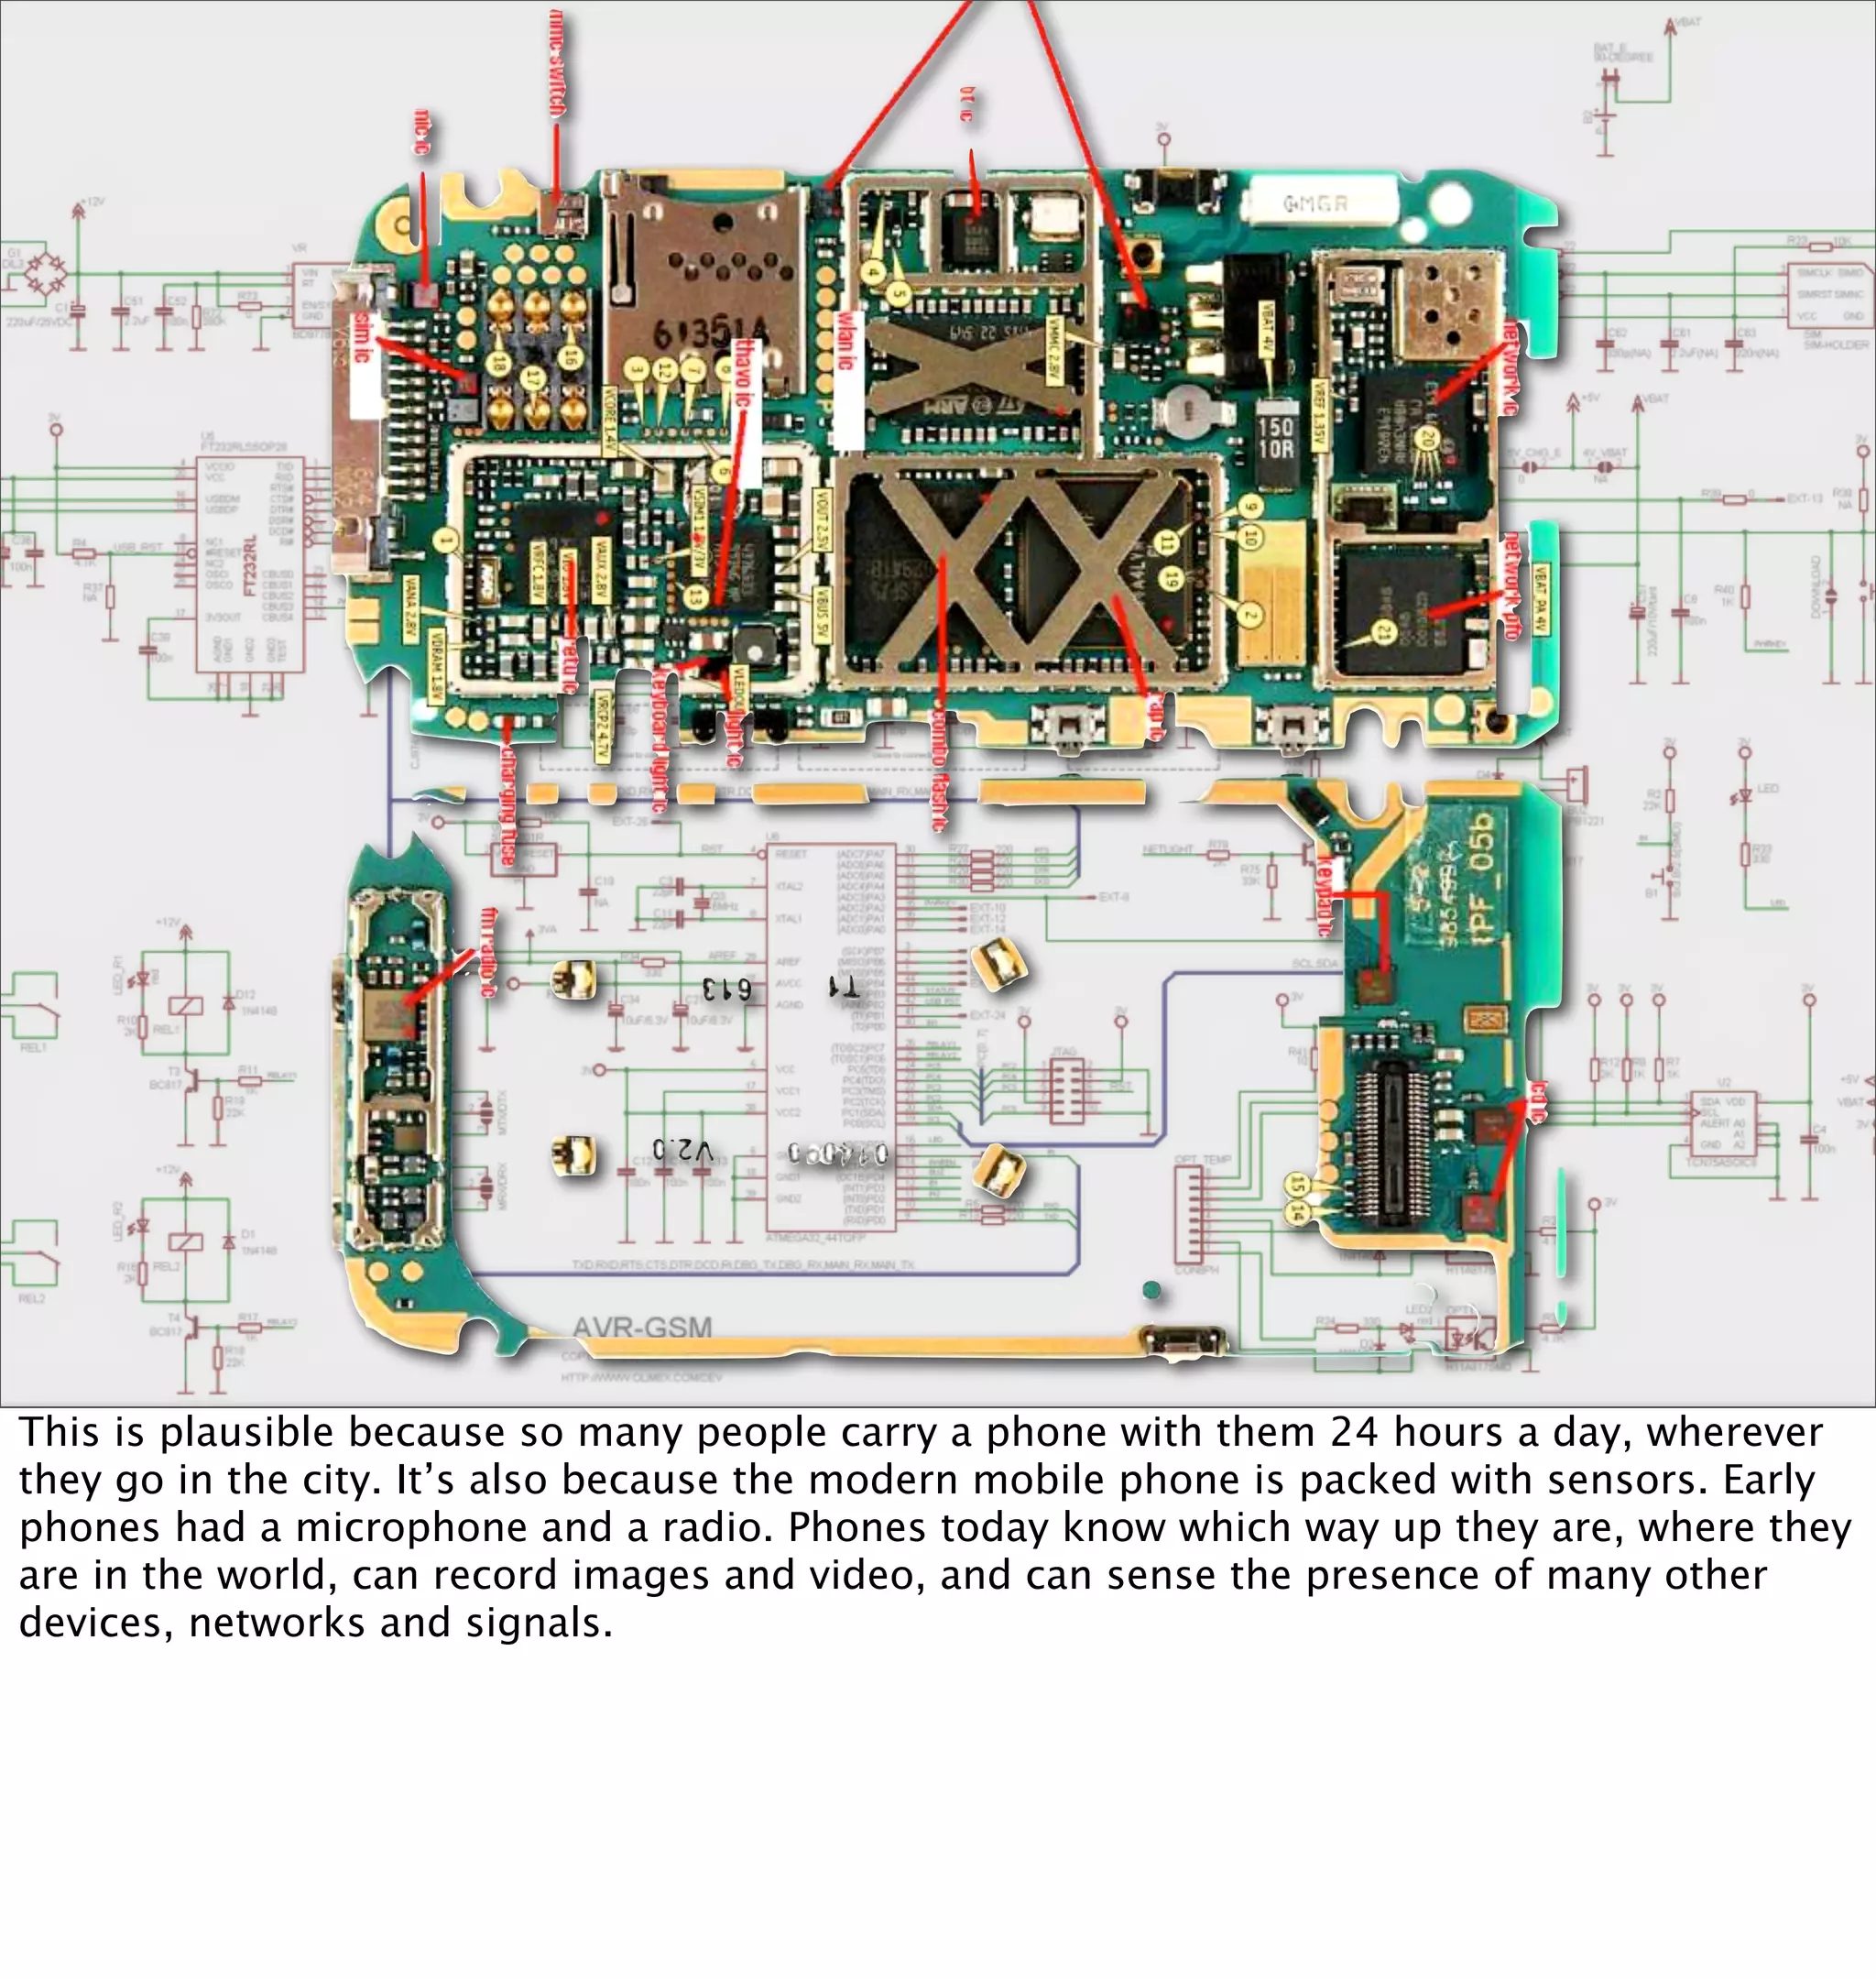
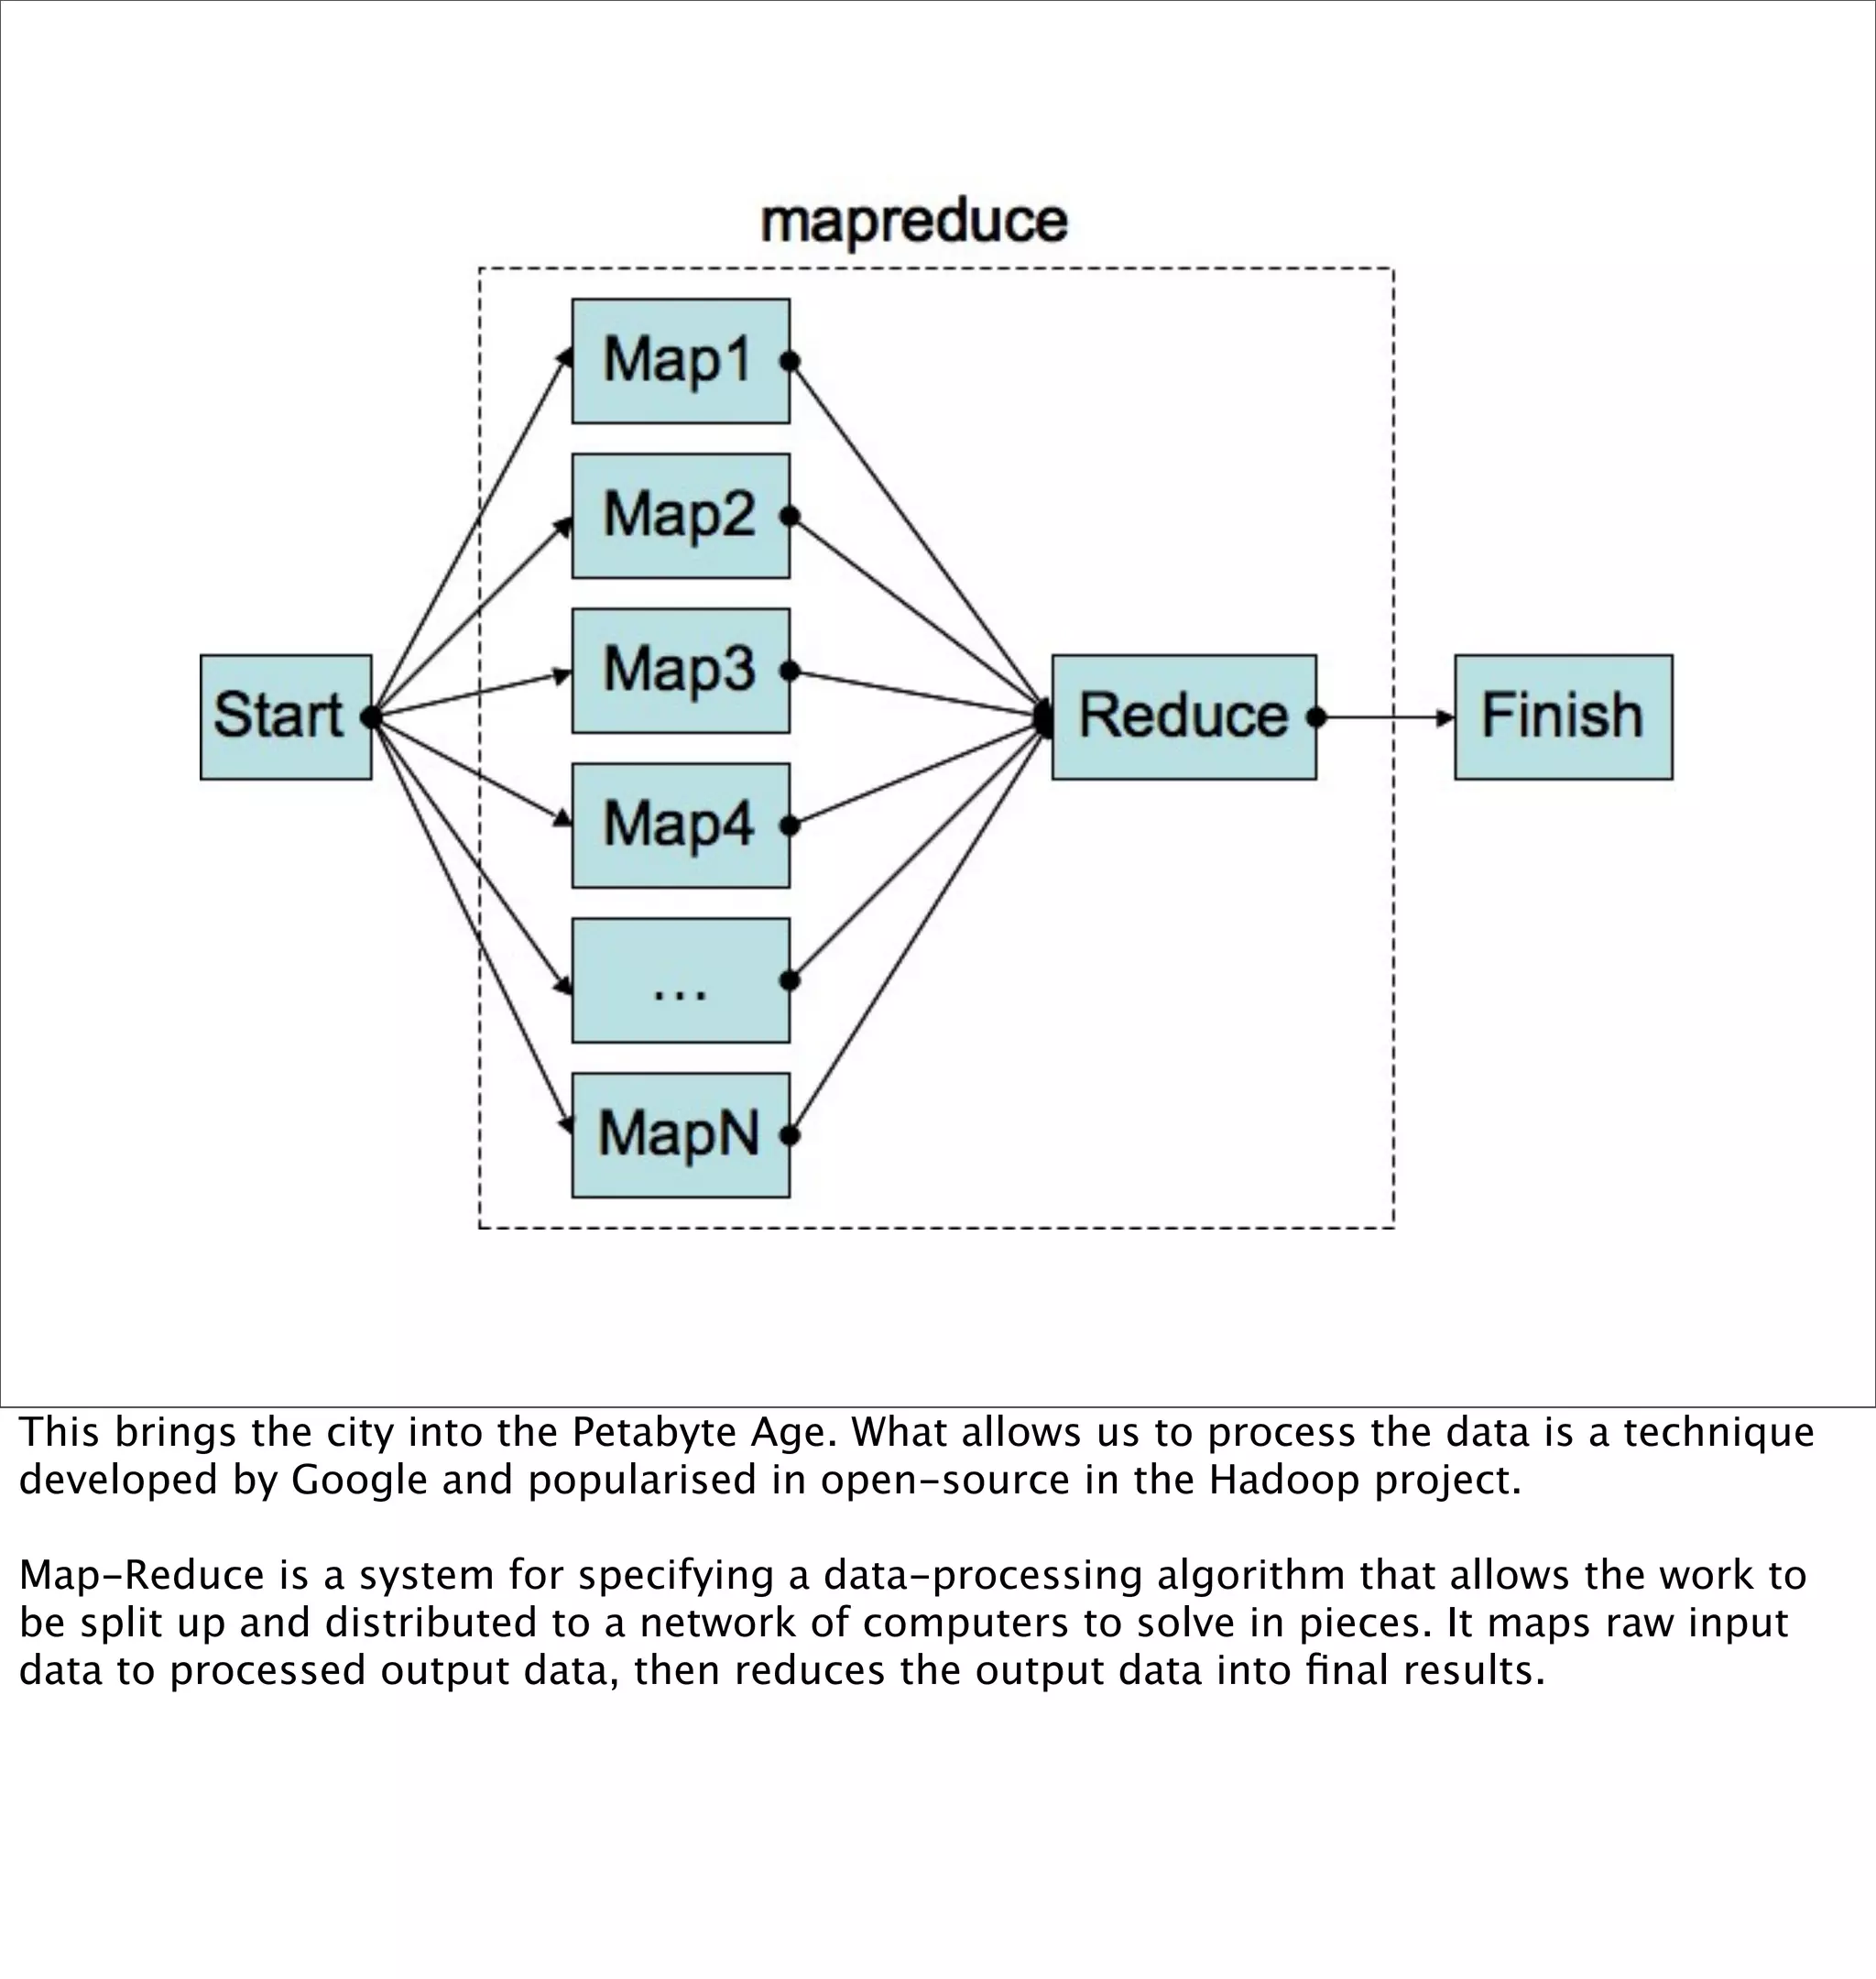
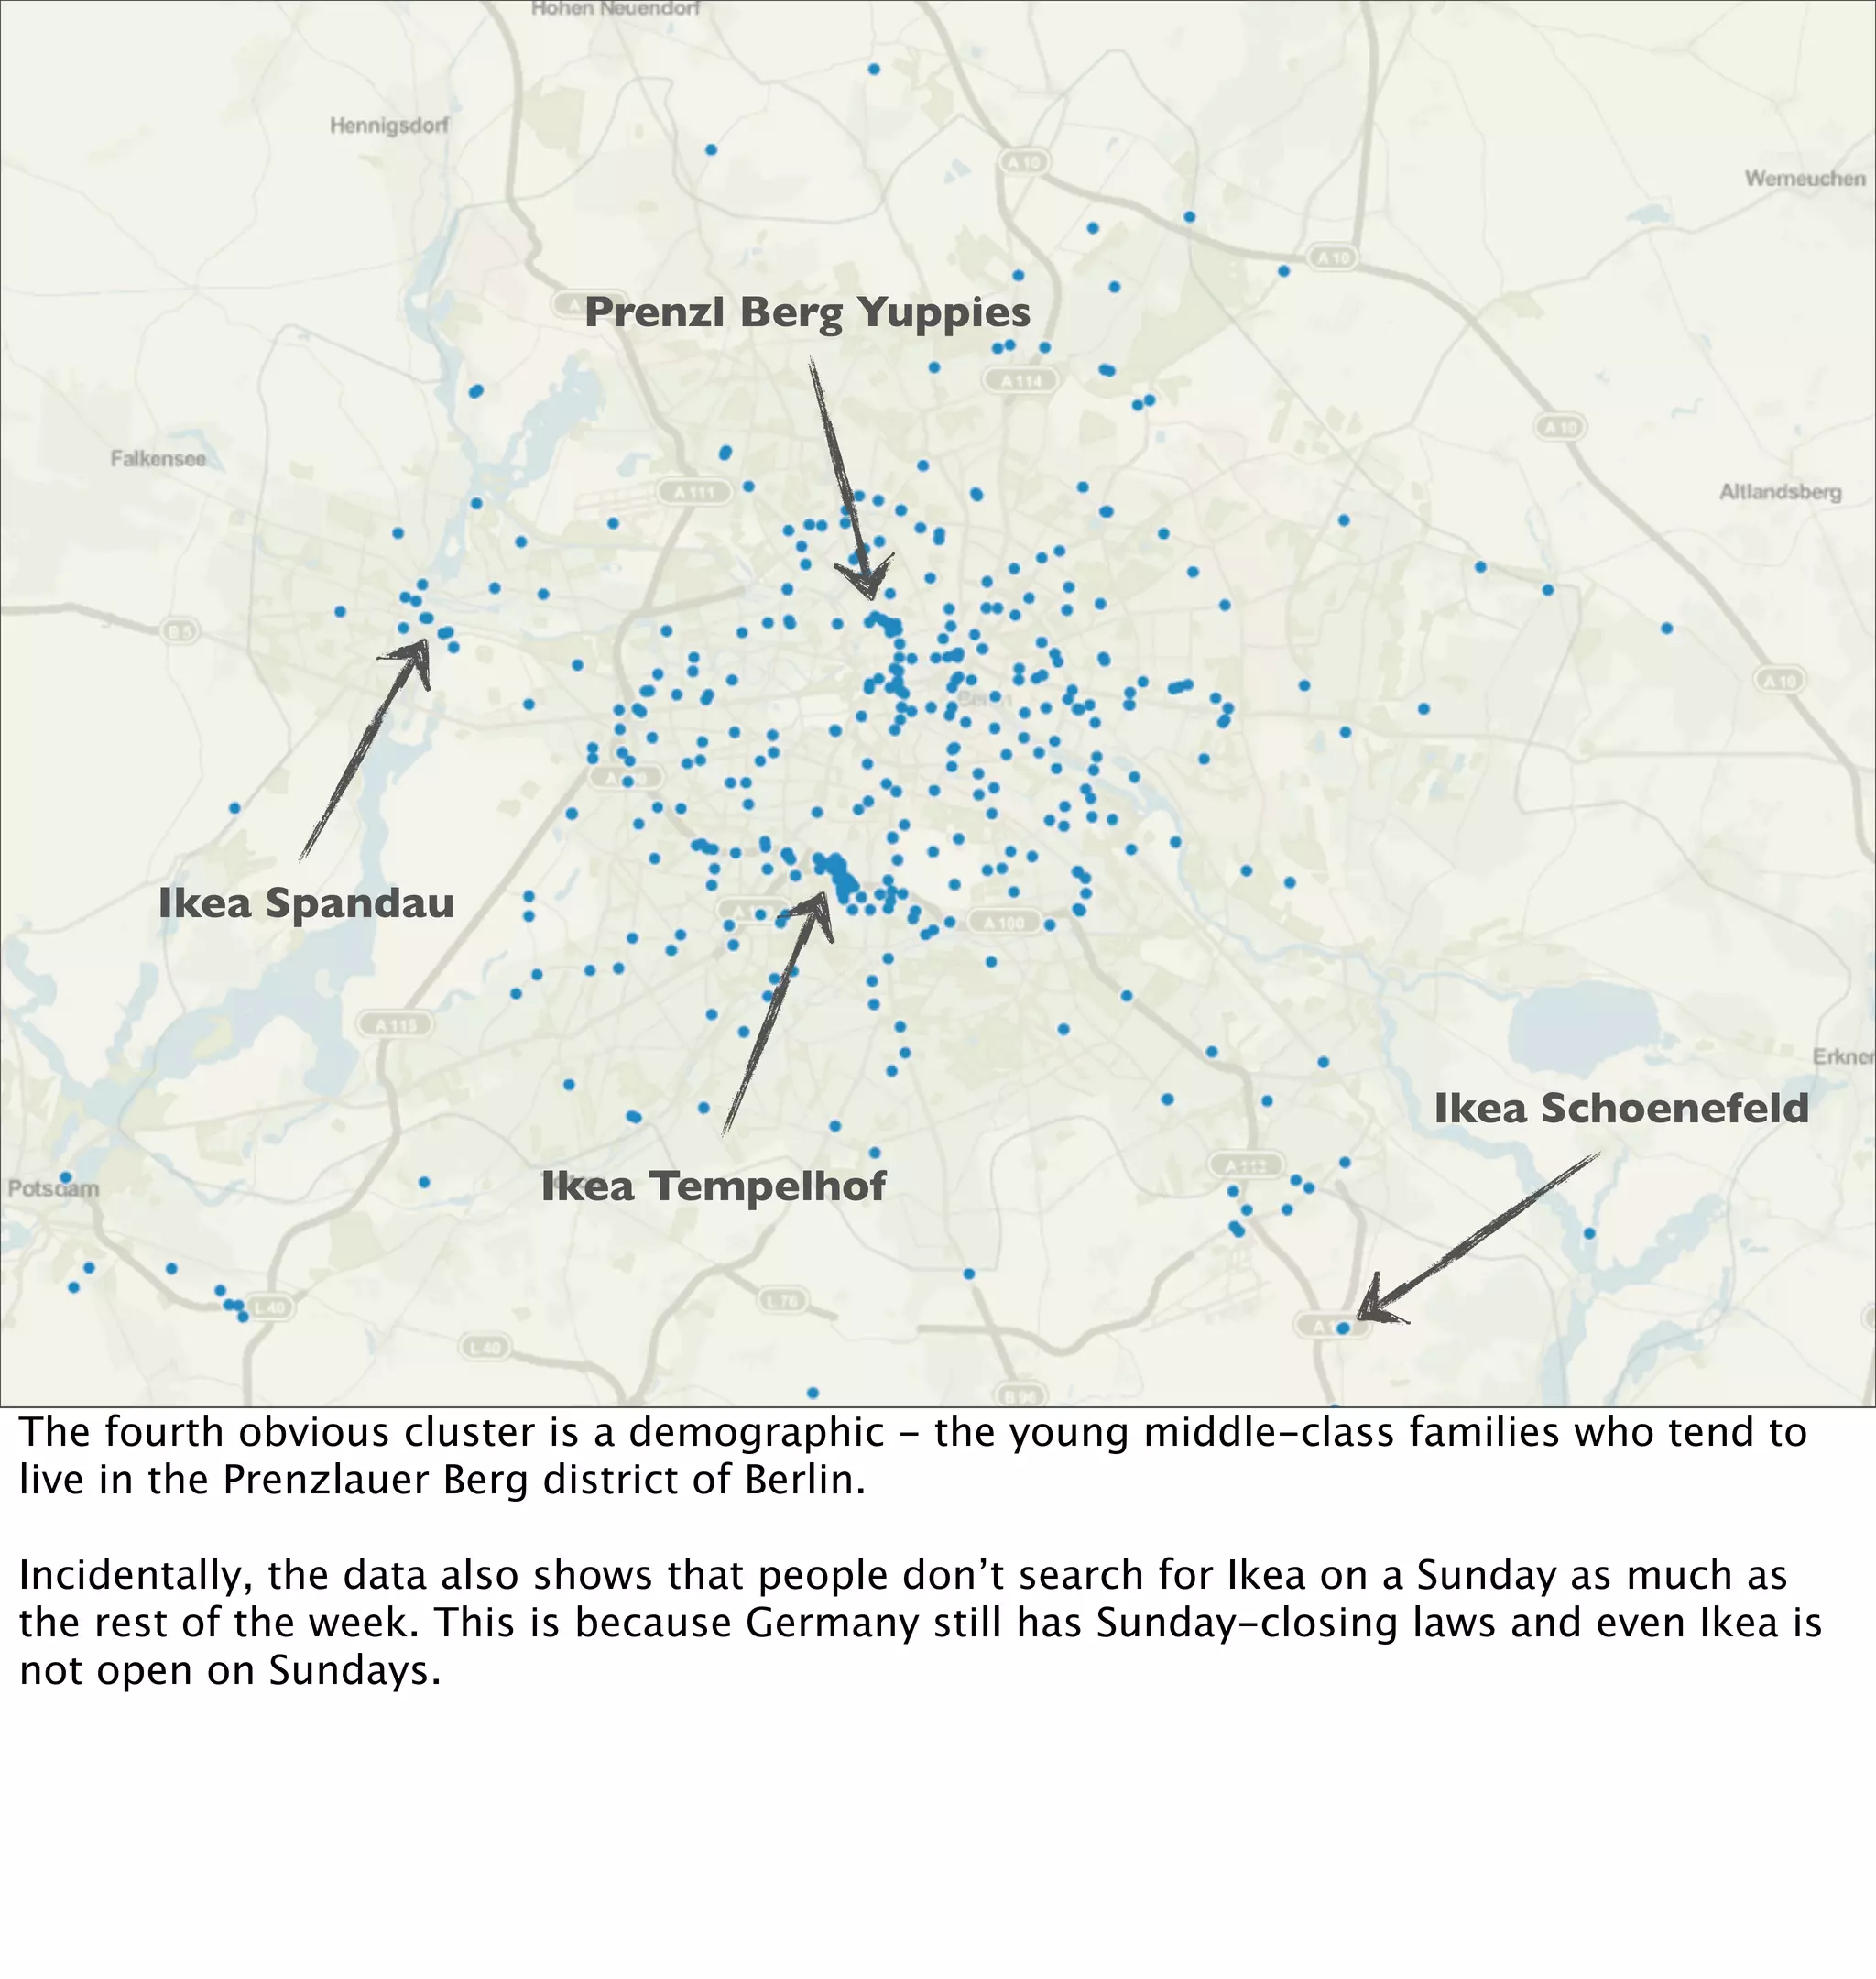
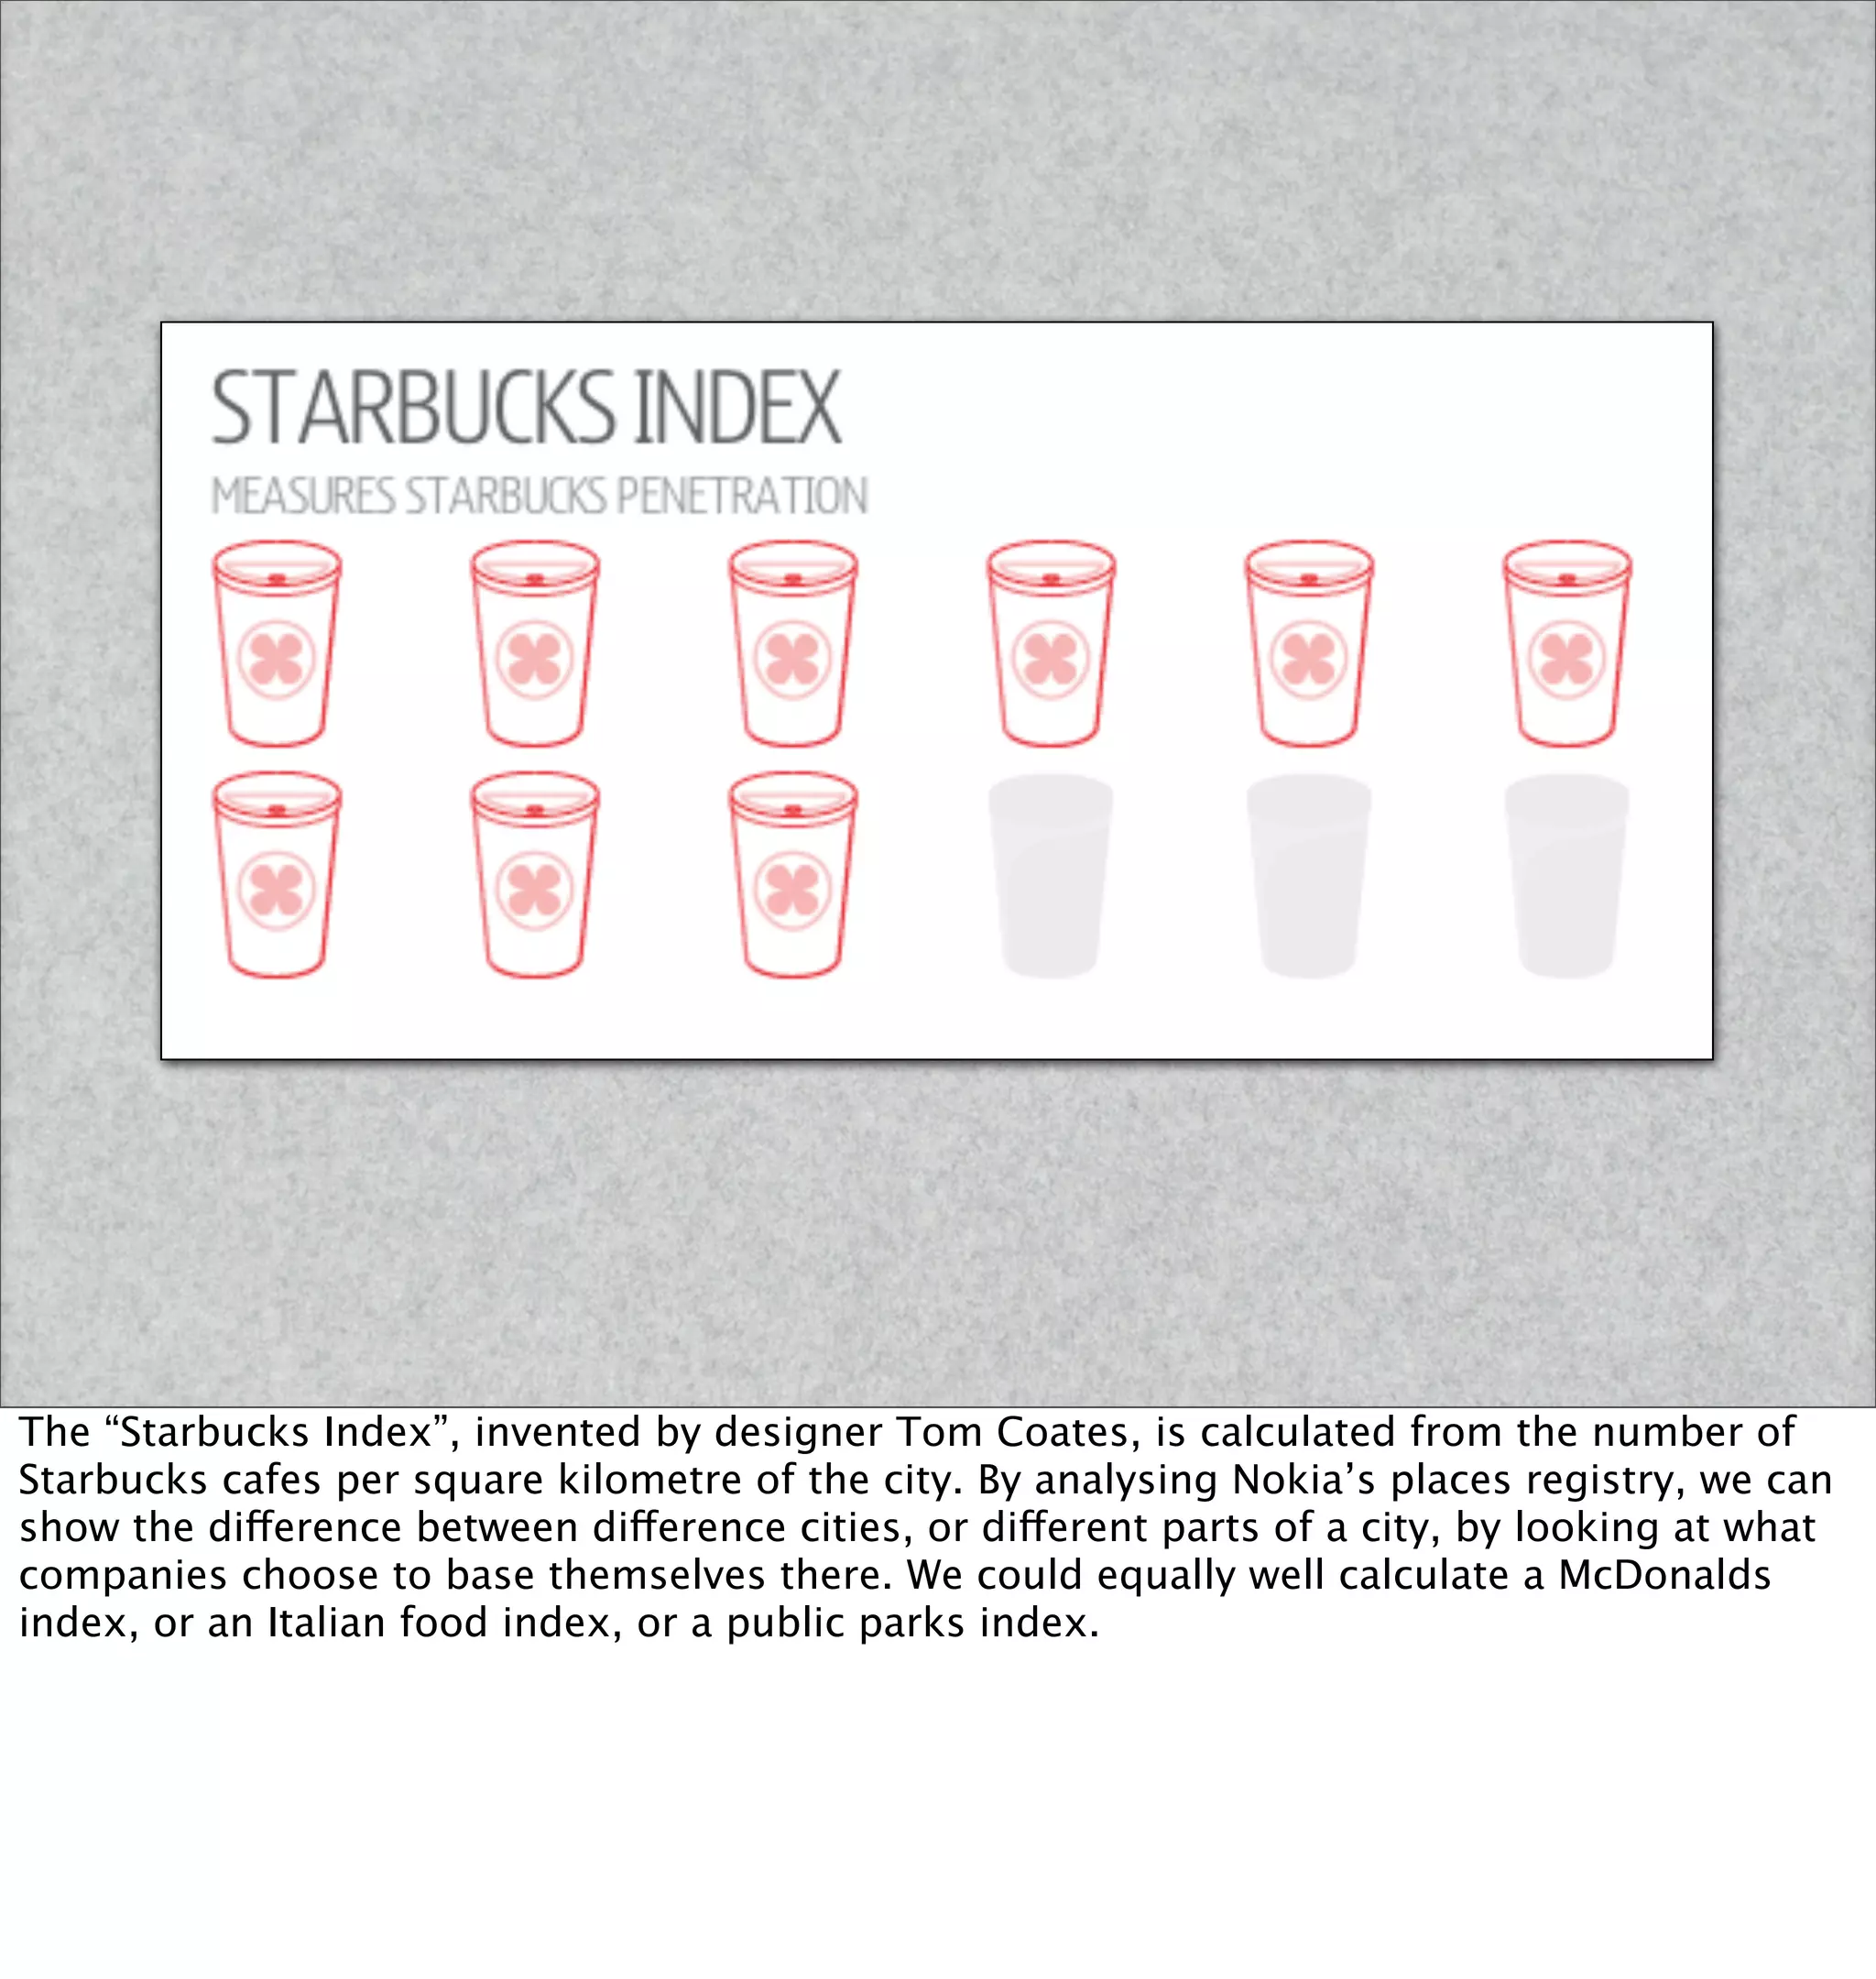
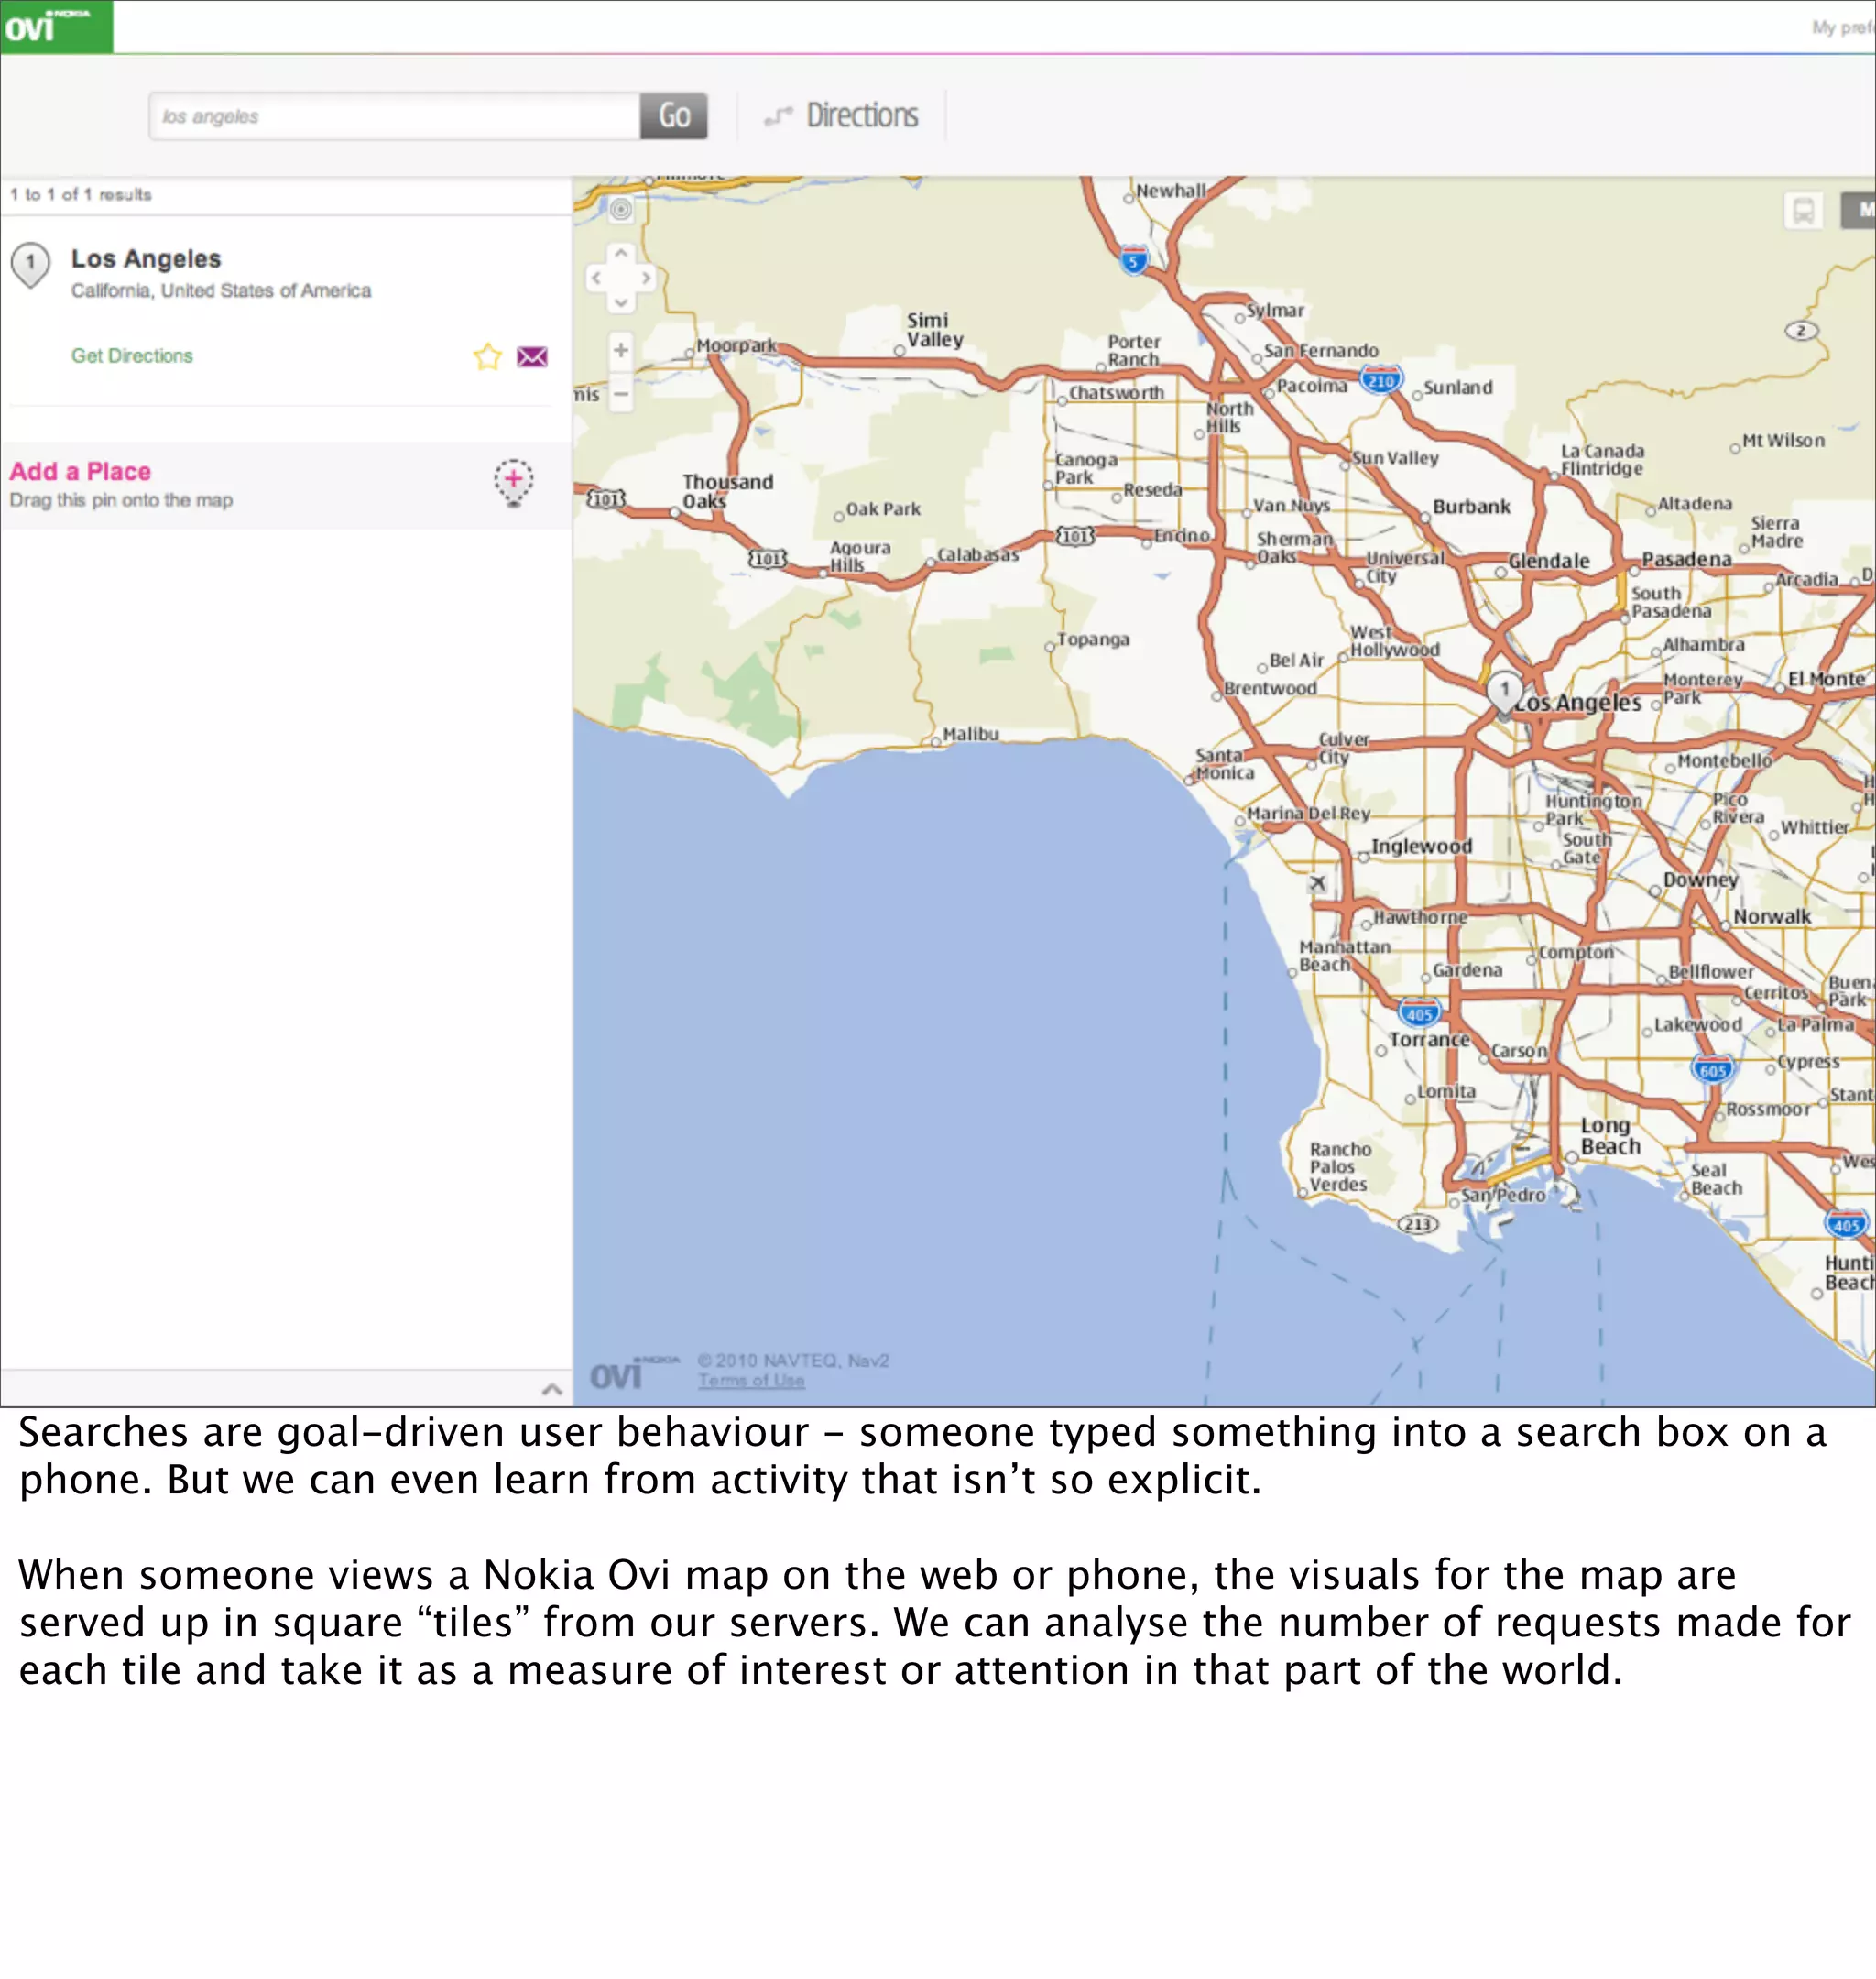
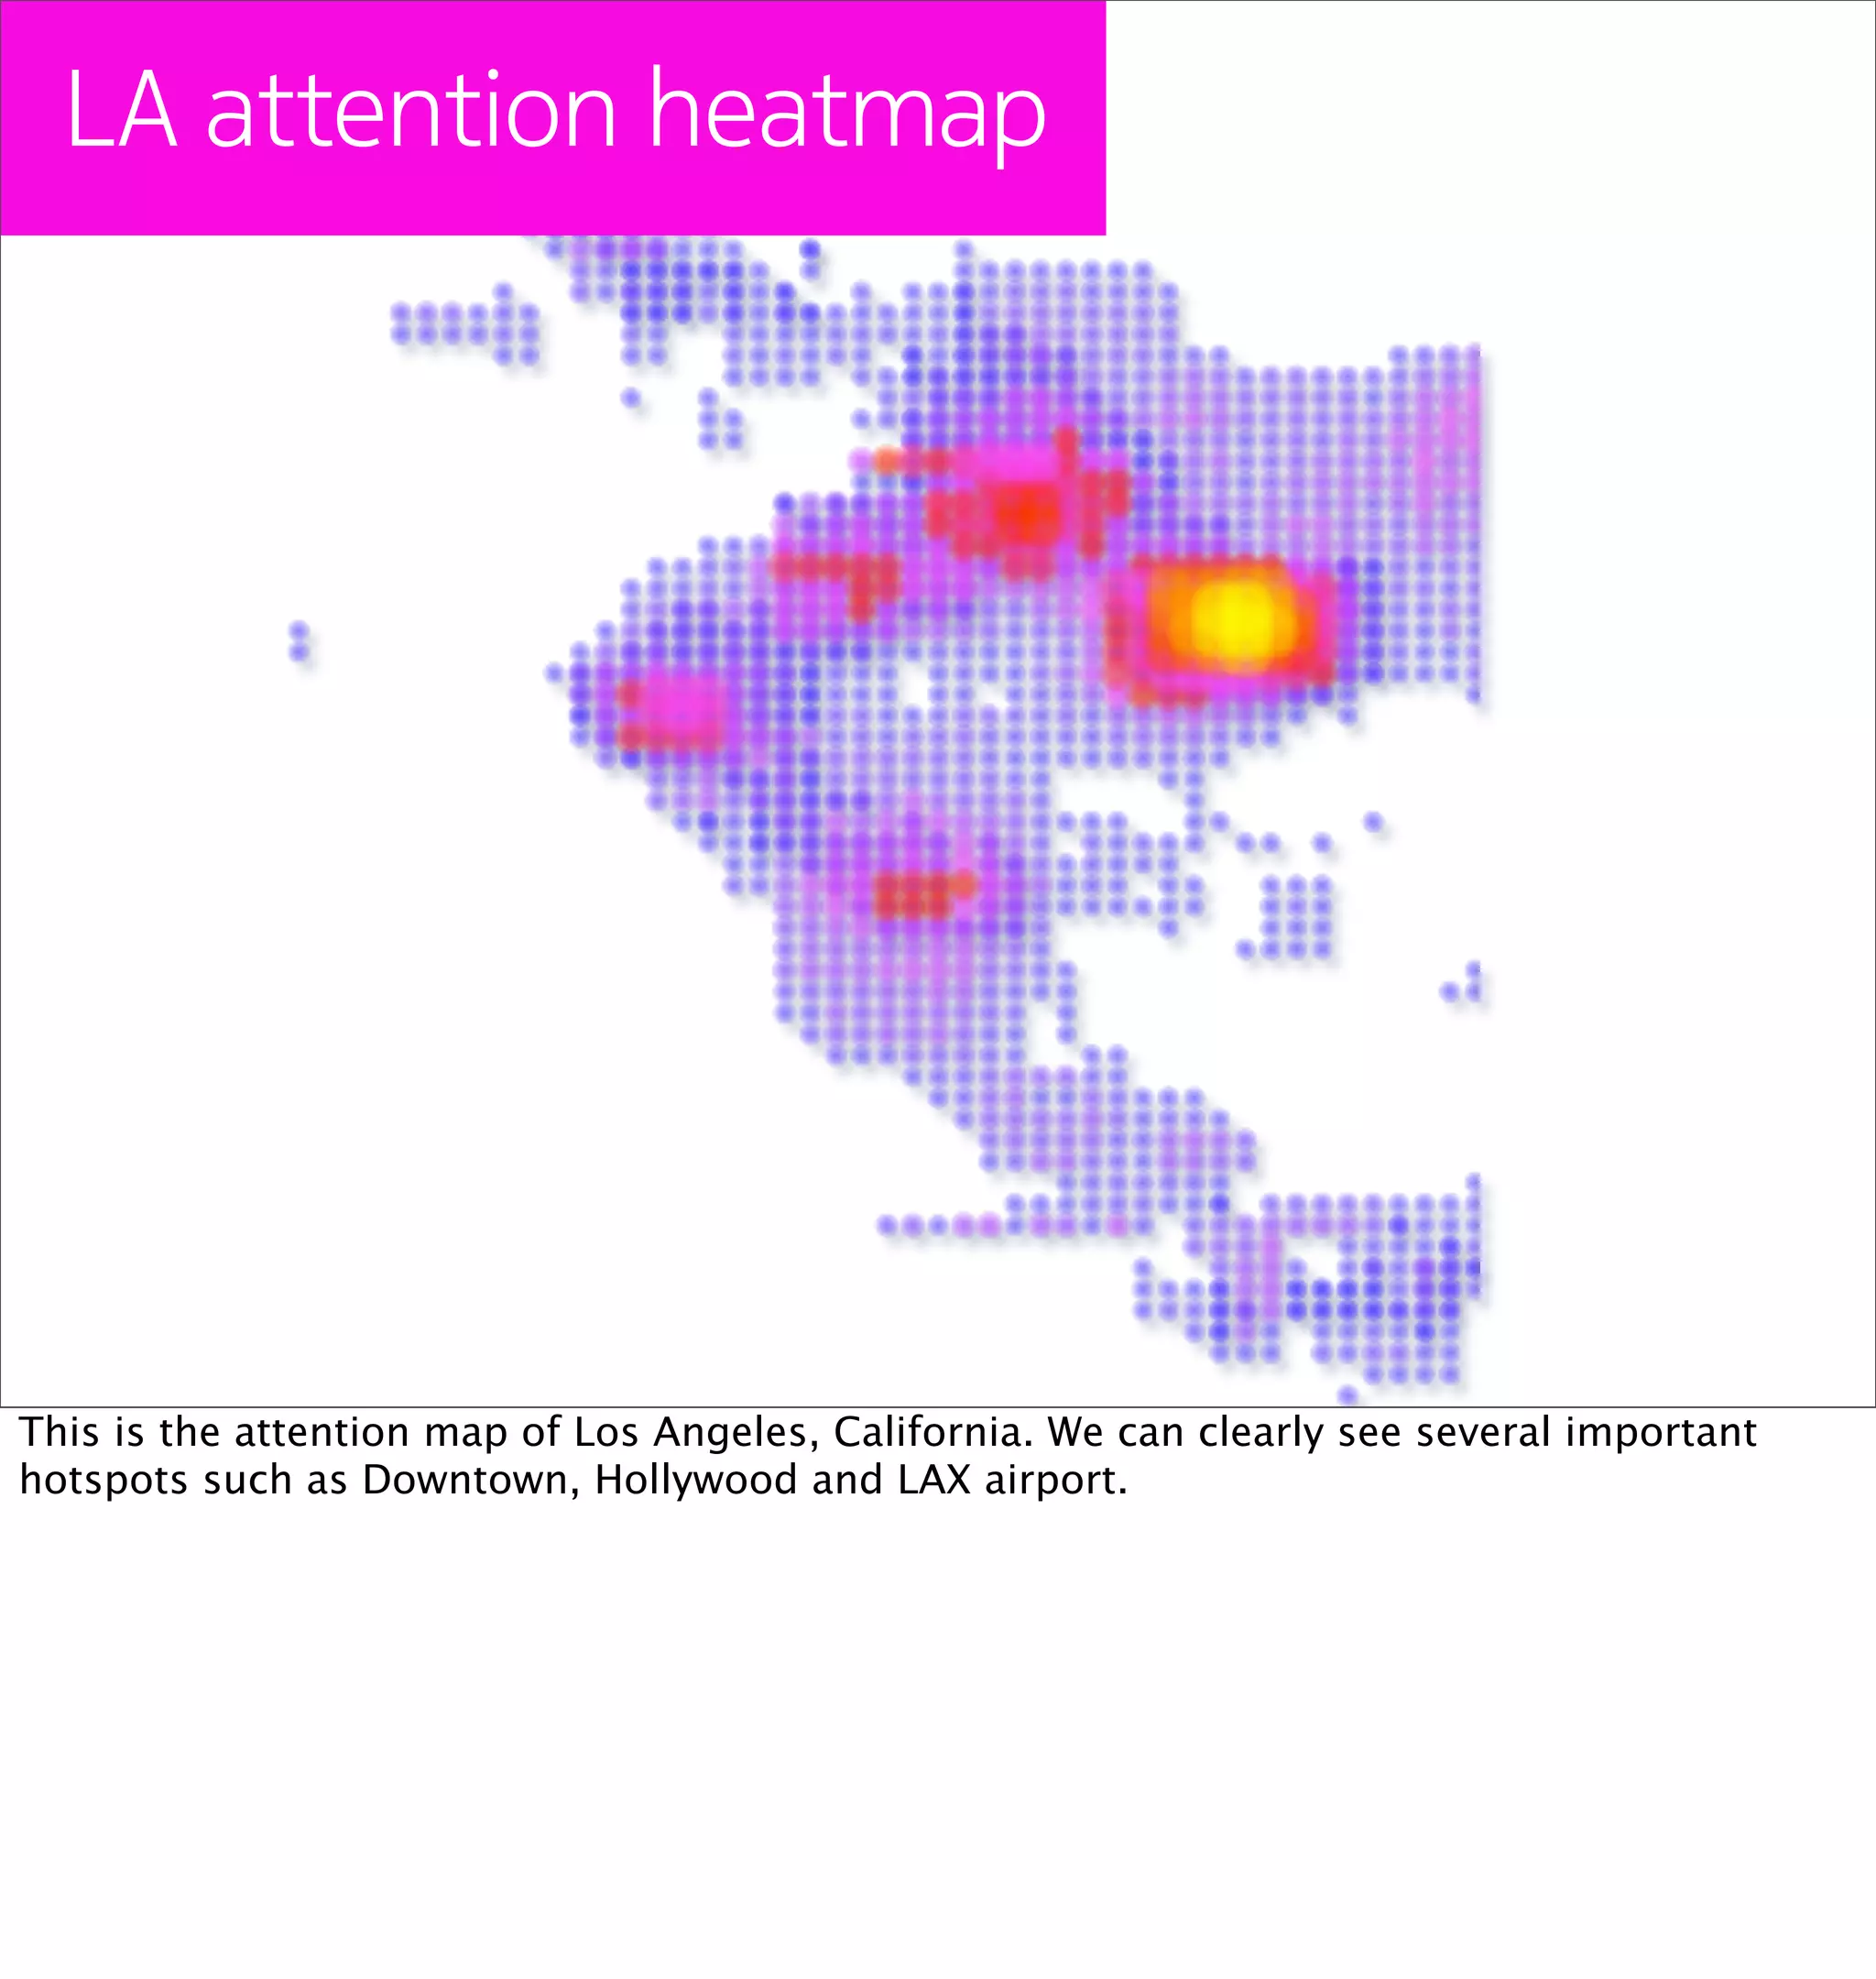
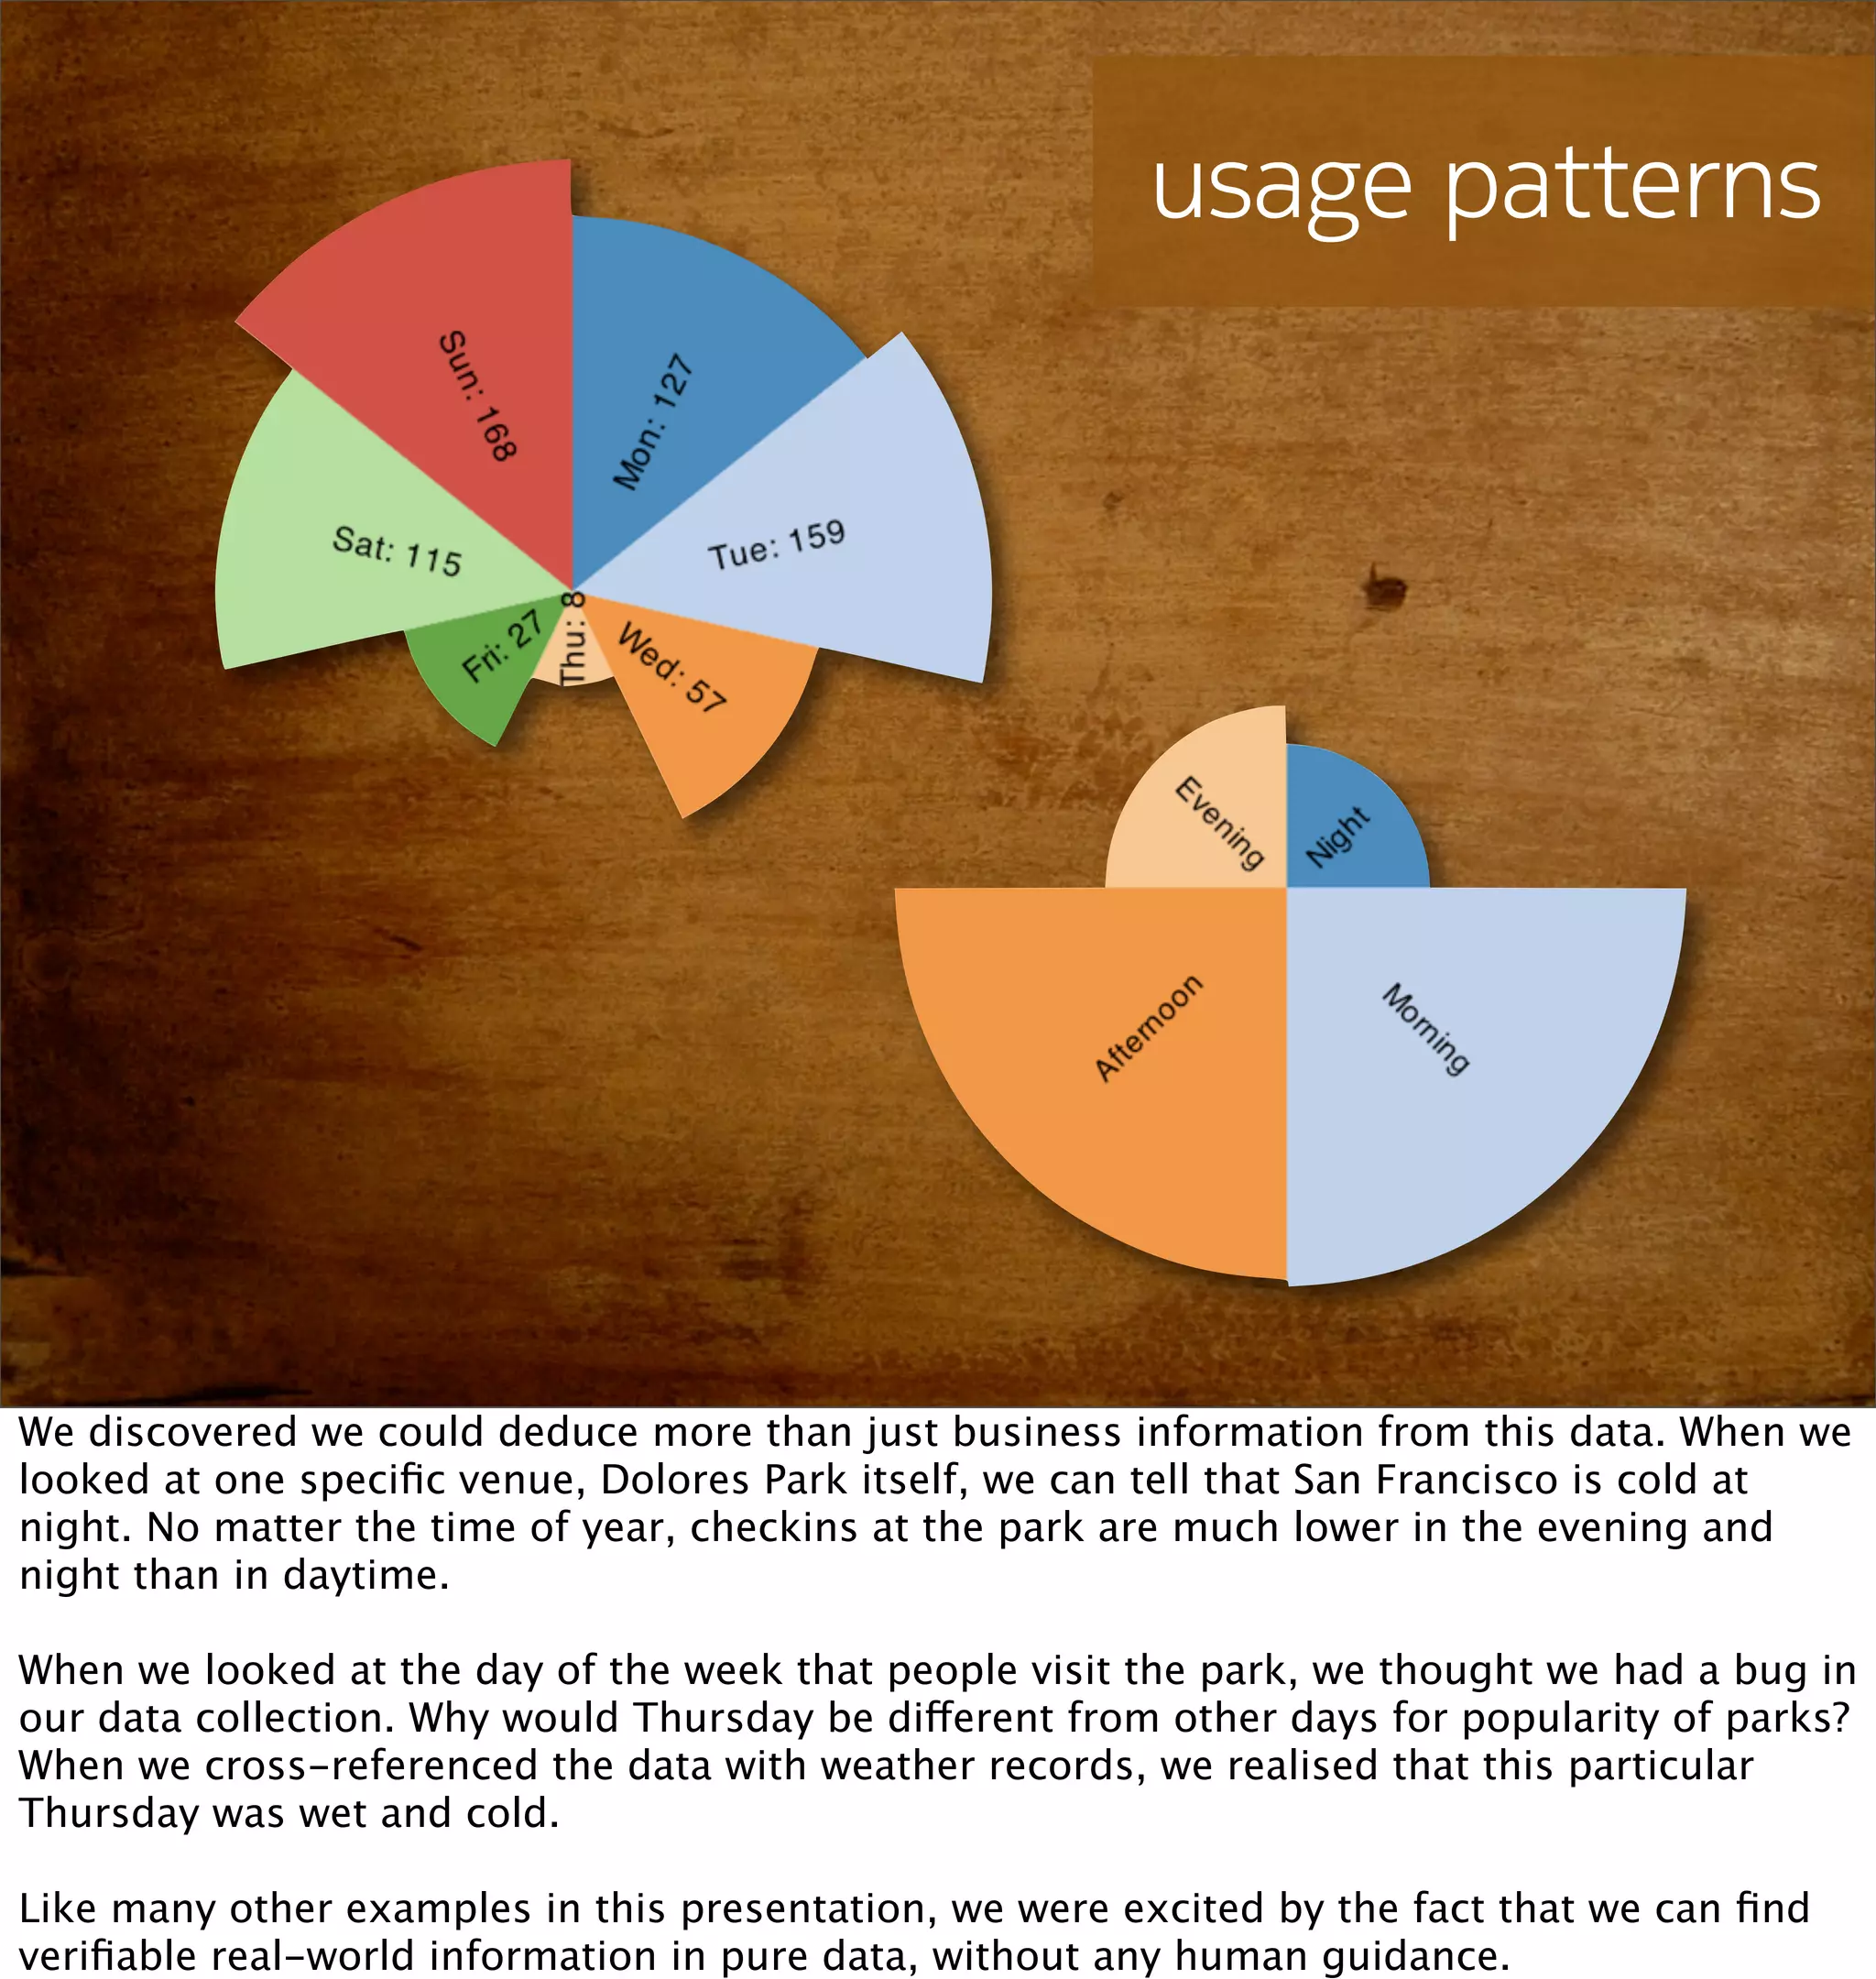
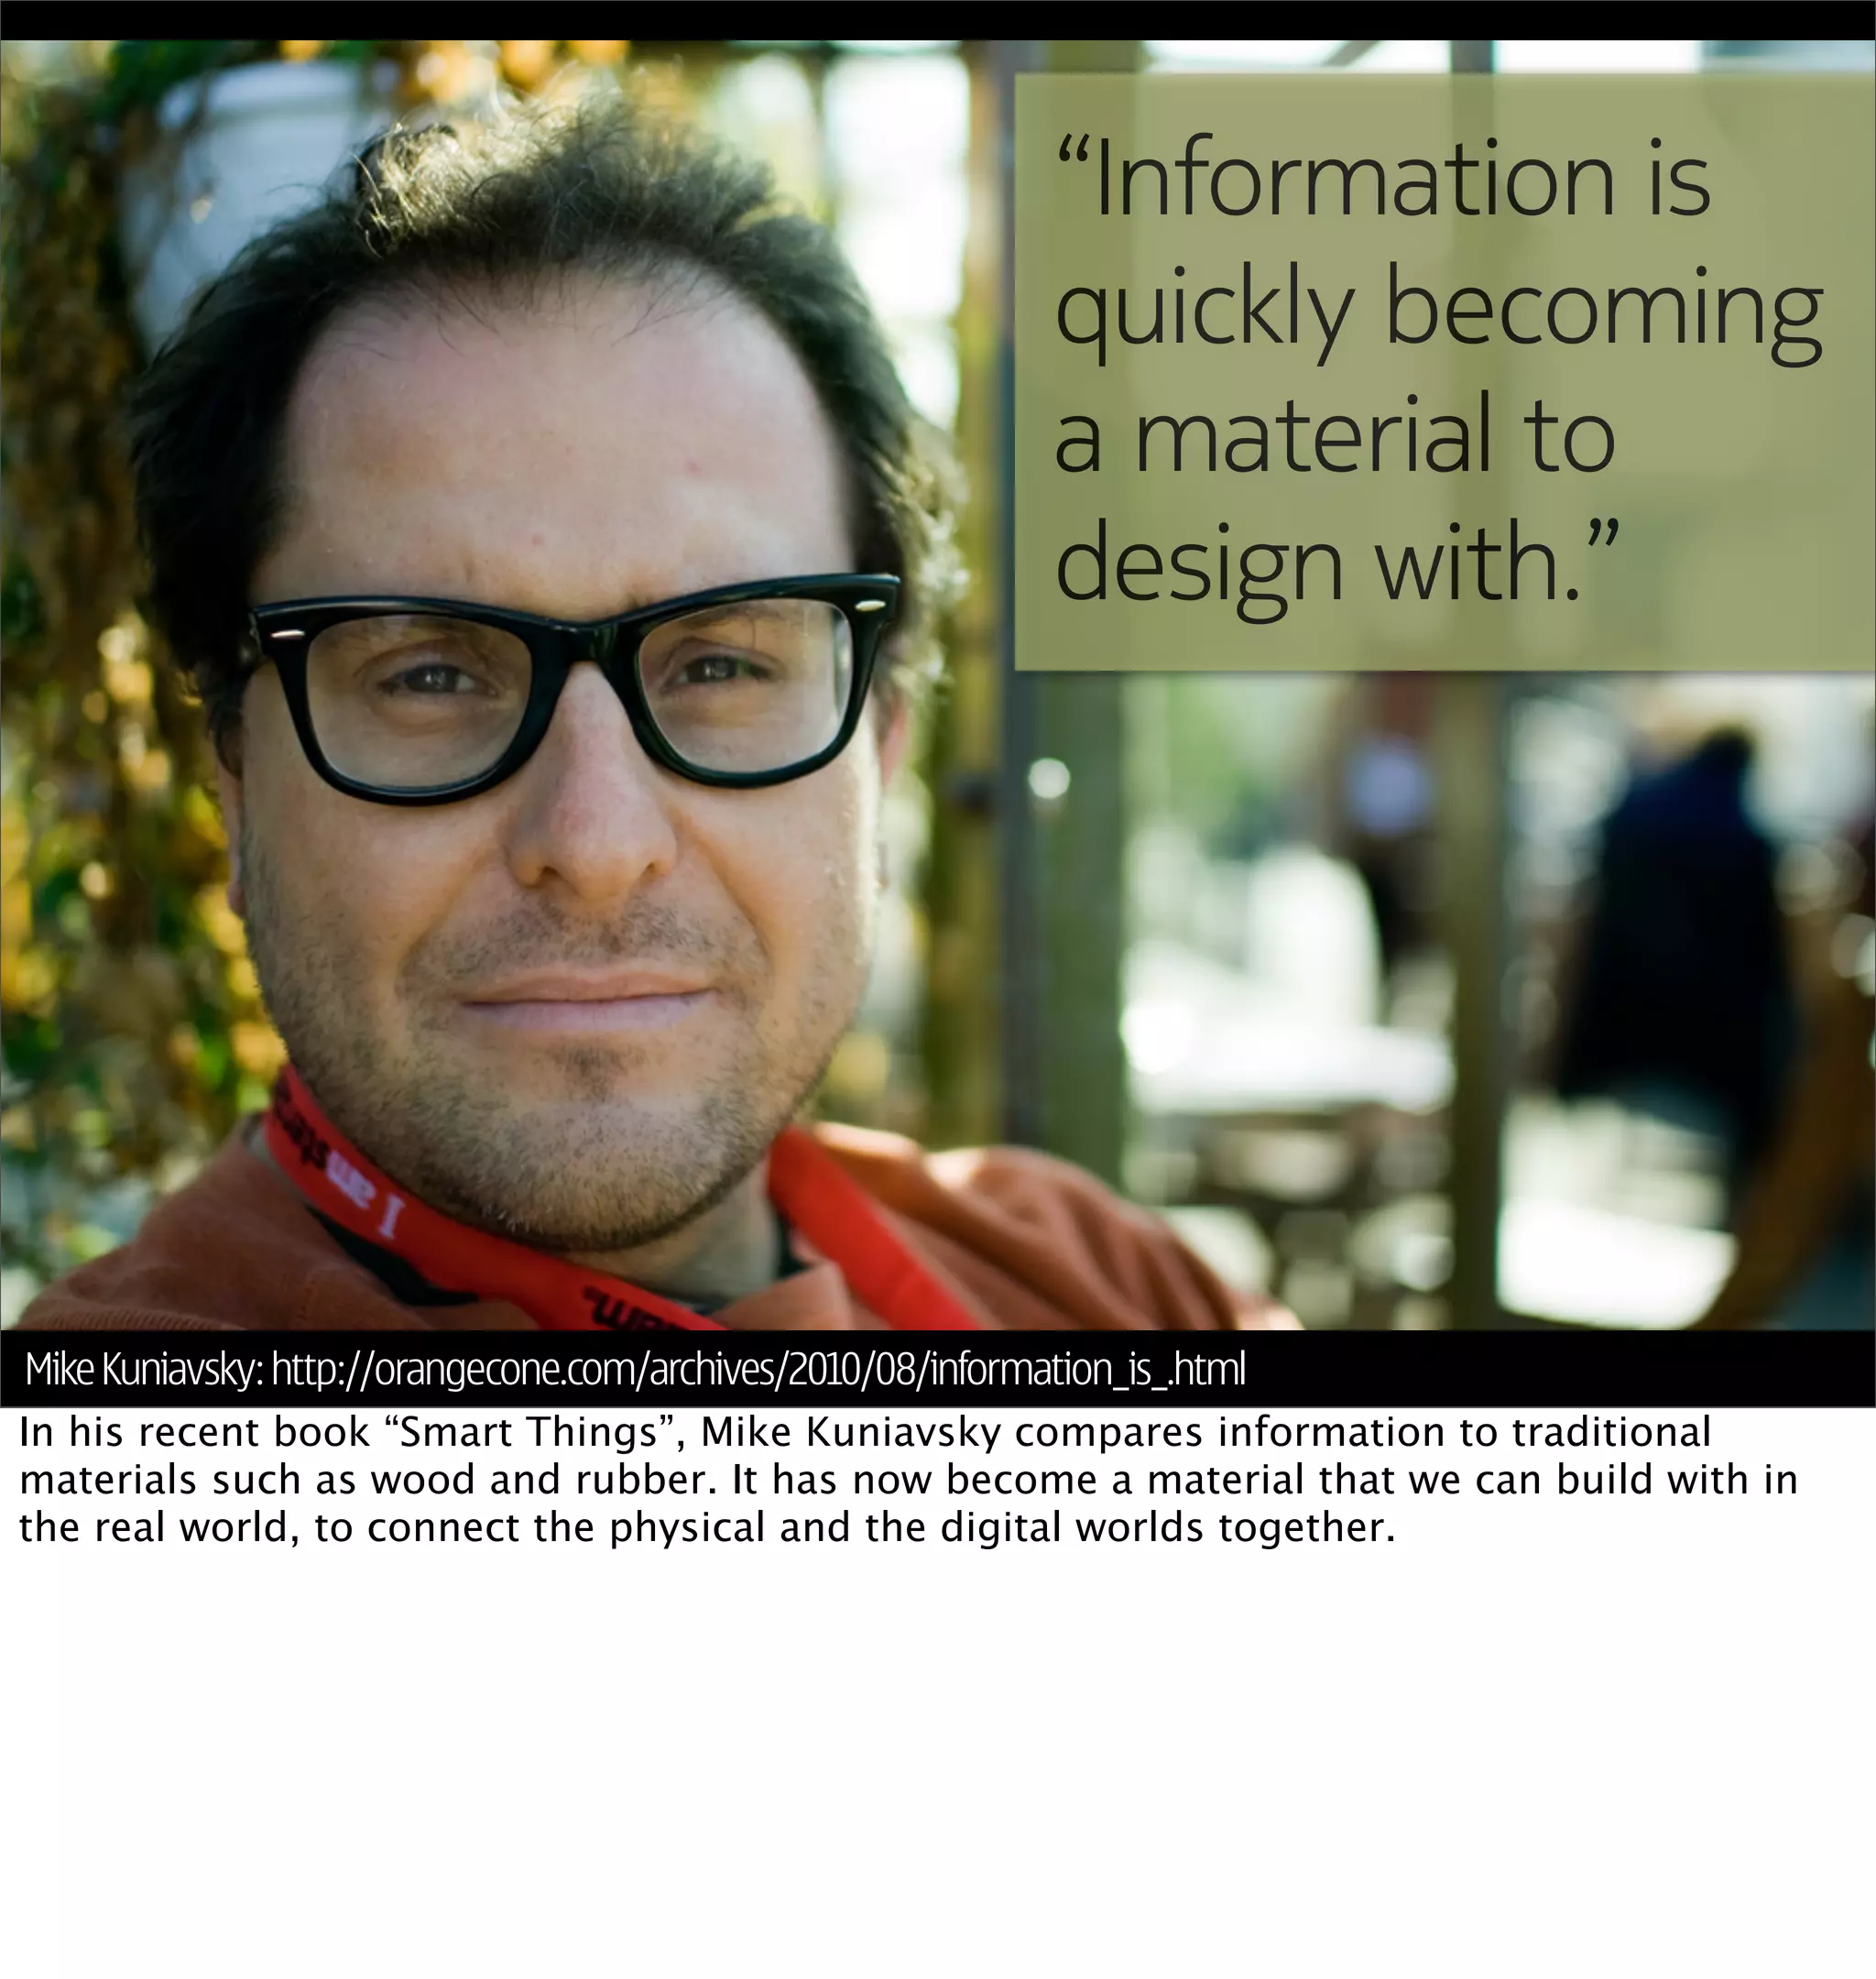
This document discusses how mobile phone data can be used to understand and model cities. It provides examples of analyzing aggregated and anonymized data from mobile phones to understand search patterns, map views, check-ins, and other data to learn about a city's businesses, transportation patterns, and usage over time. The document argues that with the vast amount of sensor and usage data collected from phones, they can act as "city samplers" and allow analysis of a city's "biology" without traditional surveys or models.
Open Source in the Cloud Computing EraTim O'Reilly
While open source software plays an important role in many cloud applications, we need to understand where the cloud is taking us or we'll find ourselves in the grip of a new monopoly. Open source needs to get serious about building interoperable open data services - they are the operating system of the internet.
Some initial experiments to investigate whether further experiments are justified, investigating the performance comparison between Groovy and Java. (Java 8 vs Groovy 2.2.0-SNAPSHOT)
FORMAGRUPO y AGROTRAVEL Turismo Responsable unen sus equipos para proponer un innovador programa de formación y capacitación práctica en 3 jornadas intensivas (24 horas de formación) para técnicos y profesionales vinculados al sector turístico interesados en:
– Conocer cómo aprovechar las oportunidades que ofrece la creciente demanda en el mercado de un turismo sostenible
– Saber utilizar la sostenibilidad para crear valor diferenciador en el branding, la comercialización, el posicionamiento y el marketing de sus productos y servicios turísticos.
This report collects insights from several recent projects with a view to exploring how consumers are starting to think about the world as an internet of things. Ericsson ConsumerLab gains its knowledge through a global consumer research program based on interviews with 100,000 individuals each year, in more than 40 countries and 15 megacities – statistically representing the views of 1.1 billion people.
the near future of tourism services based on digital tracesnicolas nova
Digital objects used by tourists such as mobile phones and cameras leave a large amount of traces. The phone can indeed be geolocated through cell-phone antennas or GPS and digital cameras take pictures that people can upload on web sharing platforms such as Flickr. All of this enable new application that allow to count tourists or provide them with new sorts of services. Based on existing experiments, the presentation will describe how the tourism industry can benefit from these digital traces to obtain new representations of tourists activities and to build up new services based on them
A whirlwind introduction to digital humanities for CDP Digital Humanities: Collections & Heritage - current challenges and futures workshop. February 22, 2018 Imperial War Museum
Changing contexts: museums, audiences and technologyMia
A presentation for the International Training Programme run by the British Museum for museum professionals from around the world. This is based on a presentation I prepared for OpenCulture 2011, but includes additional material on mobile phones/devices including the 'Hidden Histories' pilot.
Possibilities and perils of the data-driven world.joshuakauffman
I gave this lecture and led a discussion at the Future Insight summit in Oslo, Norway, March 13, 2014.
This was an introduction to subjects relating to the data-driven world, including a lengthier bit on the Quantified Self.
I improvised from the presenter notes.They give a pretty good sense of the contour of the talk.
In the Q and A session, people were mostly concerned about privacy implications of personal data collection.
My short answer is that I am also concerned, and think we need to broaden the discussion of privacy so that it transcends the concept of unwanted exposure and recenters itself on questions relating to the terms of exchange of personal data as they relate to social and economic value.
Web Storytelling and Open Data Publishing for TourismAndrea Volpini
This deck is about webstorytelling, the travel industry in the digital world, wordlift (our plugin bringing artificial intelligence to web publishers) and linked open data.
If you're excited by the many advances in web technologies, rapid changes in mobile and content marketing than this presentation is for you.
I've prepared this deck for a workshop held on February the 18th 2015 in Austria at the Semantic Technology Institute (STI) Innsbruck - a world leading research institute working on the Semantic Web.
In the same way as the web is quickly extending onto the mobile platform, we are starting to see the web moving further into the physical world. Many emerging technologies are beginning to offer physical-world inputs and outputs; multi-touch iPhones, gestural Wii controllers, RFID-driven museum interfaces, QR-coded magazines and GPS-enabled mobile phones.
These technologies have been used to create very useful services that interact with the web such as Plazes, Nokia Sports Tracker, Wattson, Tikitag and Nike Plus. But the technologies themselves often overshadow the user-experience and so far designers haven’t had language or patterns to express new ideas for these interfaces.
This talk will focus on a number of design directions for new physical interfaces. We will discuss various ideas around presence, location, context awareness, peripheral interaction as well as haptics and tangible interfaces. How do these interactions work with the web? What are the potentials and problems, and what kinds of design approaches are needed?
This presentation is a quick overview of the results from a workshop about how people move/interact in the city of Torino. It was discussed in a panel with Bruce Sterling and Geoff Manaugh at the "i realize conference".
A presentation for "Helsinki Design Capital 2012 - Palvelumuotoilu kaupunkimediassa" event
on March 4th 2010
(Service Design in Urban Media)
This presentation is Creative Commons Attribution-Noncommercial-Share Alike 2.0 Generic
Teppo Kotirinta / Nordkapp
Science Hackday: using visualisation to understand your dataMatt Biddulph
Some pointers to good books, software and code libraries for use in data visualisation.
Lightning talk from Science Hack Day SF.
http://sf.sciencehackday.com/
A perspective on iPhone development from a server-side developer with very little GUI background.
Given at http://www.lfpug.com in London on 26 March 2009.
Blaine Cook couldn't make it to XTech 2008 to give his talk, so Seth Fitzsimmons, Rabble and I did a panel in its place. We used these slides as backing. Uploading them for completeness, as they're not all that useful. But I like the pictures.
"Building Web Apps Togther"
The all-knowledgable webmaster is long gone, replaced by groups of specialists. When they work well together awesome things happen. When they don't the results are ugly, insecure, inaccessible and slow, assuming they launch at all. What's the magic that great teams have in common, and what can we learn from them?
A panel with Paul Hammond (flickr), Simon Willison, Dave Shea, Matt Biddulph (dopplr) and Geroge Oates (flickr)
Slack (or Teams) Automation for Bonterra Impact Management (fka Social Soluti...Jeffrey Haguewood
Sidekick Solutions uses Bonterra Impact Management (fka Social Solutions Apricot) and automation solutions to integrate data for business workflows.
We believe integration and automation are essential to user experience and the promise of efficient work through technology. Automation is the critical ingredient to realizing that full vision. We develop integration products and services for Bonterra Case Management software to support the deployment of automations for a variety of use cases.
This video focuses on the notifications, alerts, and approval requests using Slack for Bonterra Impact Management. The solutions covered in this webinar can also be deployed for Microsoft Teams.
Interested in deploying notification automations for Bonterra Impact Management? Contact us at sales@sidekicksolutionsllc.com to discuss next steps.
LF Energy Webinar: Electrical Grid Modelling and Simulation Through PowSyBl -...DanBrown980551
Do you want to learn how to model and simulate an electrical network from scratch in under an hour?
Then welcome to this PowSyBl workshop, hosted by Rte, the French Transmission System Operator (TSO)!
During the webinar, you will discover the PowSyBl ecosystem as well as handle and study an electrical network through an interactive Python notebook.
PowSyBl is an open source project hosted by LF Energy, which offers a comprehensive set of features for electrical grid modelling and simulation. Among other advanced features, PowSyBl provides:
- A fully editable and extendable library for grid component modelling;
- Visualization tools to display your network;
- Grid simulation tools, such as power flows, security analyses (with or without remedial actions) and sensitivity analyses;
The framework is mostly written in Java, with a Python binding so that Python developers can access PowSyBl functionalities as well.
What you will learn during the webinar:
- For beginners: discover PowSyBl's functionalities through a quick general presentation and the notebook, without needing any expert coding skills;
- For advanced developers: master the skills to efficiently apply PowSyBl functionalities to your real-world scenarios.
Epistemic Interaction - tuning interfaces to provide information for AI supportAlan Dix
Paper presented at SYNERGY workshop at AVI 2024, Genoa, Italy. 3rd June 2024
https://alandix.com/academic/papers/synergy2024-epistemic/
As machine learning integrates deeper into human-computer interactions, the concept of epistemic interaction emerges, aiming to refine these interactions to enhance system adaptability. This approach encourages minor, intentional adjustments in user behaviour to enrich the data available for system learning. This paper introduces epistemic interaction within the context of human-system communication, illustrating how deliberate interaction design can improve system understanding and adaptation. Through concrete examples, we demonstrate the potential of epistemic interaction to significantly advance human-computer interaction by leveraging intuitive human communication strategies to inform system design and functionality, offering a novel pathway for enriching user-system engagements.
GDG Cloud Southlake #33: Boule & Rebala: Effective AppSec in SDLC using Deplo...James Anderson
Effective Application Security in Software Delivery lifecycle using Deployment Firewall and DBOM
The modern software delivery process (or the CI/CD process) includes many tools, distributed teams, open-source code, and cloud platforms. Constant focus on speed to release software to market, along with the traditional slow and manual security checks has caused gaps in continuous security as an important piece in the software supply chain. Today organizations feel more susceptible to external and internal cyber threats due to the vast attack surface in their applications supply chain and the lack of end-to-end governance and risk management.
The software team must secure its software delivery process to avoid vulnerability and security breaches. This needs to be achieved with existing tool chains and without extensive rework of the delivery processes. This talk will present strategies and techniques for providing visibility into the true risk of the existing vulnerabilities, preventing the introduction of security issues in the software, resolving vulnerabilities in production environments quickly, and capturing the deployment bill of materials (DBOM).
Speakers:
Bob Boule
Robert Boule is a technology enthusiast with PASSION for technology and making things work along with a knack for helping others understand how things work. He comes with around 20 years of solution engineering experience in application security, software continuous delivery, and SaaS platforms. He is known for his dynamic presentations in CI/CD and application security integrated in software delivery lifecycle.
Gopinath Rebala
Gopinath Rebala is the CTO of OpsMx, where he has overall responsibility for the machine learning and data processing architectures for Secure Software Delivery. Gopi also has a strong connection with our customers, leading design and architecture for strategic implementations. Gopi is a frequent speaker and well-known leader in continuous delivery and integrating security into software delivery.
Neuro-symbolic is not enough, we need neuro-*semantic*Frank van Harmelen
Neuro-symbolic (NeSy) AI is on the rise. However, simply machine learning on just any symbolic structure is not sufficient to really harvest the gains of NeSy. These will only be gained when the symbolic structures have an actual semantics. I give an operational definition of semantics as “predictable inference”.
All of this illustrated with link prediction over knowledge graphs, but the argument is general.
The Art of the Pitch: WordPress Relationships and SalesLaura Byrne
Clients don’t know what they don’t know. What web solutions are right for them? How does WordPress come into the picture? How do you make sure you understand scope and timeline? What do you do if sometime changes?
All these questions and more will be explored as we talk about matching clients’ needs with what your agency offers without pulling teeth or pulling your hair out. Practical tips, and strategies for successful relationship building that leads to closing the deal.
Software Delivery At the Speed of AI: Inflectra Invests In AI-Powered QualityInflectra
In this insightful webinar, Inflectra explores how artificial intelligence (AI) is transforming software development and testing. Discover how AI-powered tools are revolutionizing every stage of the software development lifecycle (SDLC), from design and prototyping to testing, deployment, and monitoring.
Learn about:
• The Future of Testing: How AI is shifting testing towards verification, analysis, and higher-level skills, while reducing repetitive tasks.
• Test Automation: How AI-powered test case generation, optimization, and self-healing tests are making testing more efficient and effective.
• Visual Testing: Explore the emerging capabilities of AI in visual testing and how it's set to revolutionize UI verification.
• Inflectra's AI Solutions: See demonstrations of Inflectra's cutting-edge AI tools like the ChatGPT plugin and Azure Open AI platform, designed to streamline your testing process.
Whether you're a developer, tester, or QA professional, this webinar will give you valuable insights into how AI is shaping the future of software delivery.
Kubernetes & AI - Beauty and the Beast !?! @KCD Istanbul 2024Tobias Schneck
As AI technology is pushing into IT I was wondering myself, as an “infrastructure container kubernetes guy”, how get this fancy AI technology get managed from an infrastructure operational view? Is it possible to apply our lovely cloud native principals as well? What benefit’s both technologies could bring to each other?
Let me take this questions and provide you a short journey through existing deployment models and use cases for AI software. On practical examples, we discuss what cloud/on-premise strategy we may need for applying it to our own infrastructure to get it to work from an enterprise perspective. I want to give an overview about infrastructure requirements and technologies, what could be beneficial or limiting your AI use cases in an enterprise environment. An interactive Demo will give you some insides, what approaches I got already working for real.
DevOps and Testing slides at DASA ConnectKari Kakkonen
My and Rik Marselis slides at 30.5.2024 DASA Connect conference. We discuss about what is testing, then what is agile testing and finally what is Testing in DevOps. Finally we had lovely workshop with the participants trying to find out different ways to think about quality and testing in different parts of the DevOps infinity loop.
2. understanding systems
by making models
We have always tried to understand systems by creating models of them. We create rules that
match reality just closely enough that we can study reality by studying the model. MONIAC is
one such example, created at the London School of Economics in 1949 by Bill Phillips. It uses
fluid dynamics to model an economy, with the flow between water tanks standing in for the
monetary flow between the Treasury, Education and so forth.
3. “The more we learn about biology,
the further we find ourselves from
a model that can explain it.”
Chris Anderson, http://www.wired.com/science/discoveries/magazine/16-07/pb_theory
“All models are wrong, but some are useful.” — George Box, Statistician, quoted in http://
www.wired.com/science/discoveries/magazine/16-07/pb_theory
As our knowledge advances in a field like biology, our inaccurate models give us diminishing
returns. In “The End Of Theory”, Chris Anderson argues that the future of science is transitioning
to analysing empirical data gathered from observation of the world. He calls this The Petabyte
Age, pioneered by companies such as Google who created techniques for large-scale analysis of
data out of the necessity to analyse the whole internet.
Credit: http://www.flickr.com/photos/timo/851027757/
4. people are city biology
We can try to study cities with models. But human behaviour, the biology of the city, makes
cities too complex to model.
5. Recent visualisations of the movement of hire-bikes through London emphasise for me the
organic, biological nature of human city-data.
6. “We can’t see how the
street is immersed in a
twitching, pulsing cloud
of data.”
Dan Hill: http://www.cityofsound.com/blog/2008/02/the-street-as-p.html
Dan Hill continues, “This is over and above the well-established electromagnetic radiation,
crackles of static, radio waves conveying radio and television broadcasts in digital and
analogue forms, police voice traffic. This is a new kind of data, collective and individual,
aggregated and discrete, open and closed, constantly logging impossibly detailed patterns of
behaviour. The behaviour of the street.”
The data that flows through modern cities is not even visible to the human eye. We can’t
gather this data with interviews, surveys and clipboards.
7. city samplers
So at Nokia, we’ve been asking the question, can the phone be the entire source of data that
allows us to know our cities?
8. This is plausible because so many people carry a phone with them 24 hours a day, wherever
they go in the city. It’s also because the modern mobile phone is packed with sensors. Early
phones had a microphone and a radio. Phones today know which way up they are, where they
are in the world, can record images and video, and can sense the presence of many other
devices, networks and signals.
9. This brings the city into the Petabyte Age. What allows us to process the data is a technique
developed by Google and popularised in open-source in the Hadoop project.
Map-Reduce is a system for specifying a data-processing algorithm that allows the work to
be split up and distributed to a network of computers to solve in pieces. It maps raw input
data to processed output data, then reduces the output data into final results.
10. With map-reduce, we can run an algorithm on a rack of servers...
http://www.flickr.com/photos/johnseb/3425464/
11. ... or a corridor full of racks of servers ...
12. ... or data-centre full of corridors full of racks of servers.
We can start small and scale up our processing capability to keep pace with the scale of our
data. It sidesteps the limit we hit with traditional single-machine analytics, when we can no
longer process 24 hours of data in 24 hours of CPU time.
13. learning from search
My first example shows what we can learn by looking at what people search for on a map,
and where they are when they search.
14. Ikea Spandau
Ikea Schoenefeld
Ikea Tempelhof
This map of Berlin (made by Nokia’s Josh Devins) aggregates searches made over the last
Thursday, January 27, 2011
Ikea geo-searches bounded to Berlin
four months for the word “Ikea”. It clearly shows that people all over Berlin look for Ikea, but
can we make any assumptions about whatBerlin Ikea stores.
that there are obvious clusters near the 3 the actual locations are?
kind of, but not much data here
clearly there is a Tempelhof cluster but the others are not very evident
certainly shows the relative popularity of all the locations
Ikea Lichtenberg was not open yet during this time frame
15. Prenzl Berg Yuppies
Ikea Spandau
Ikea Schoenefeld
Ikea Tempelhof
The fourth obvious cluster is a demographic - the young middle-class families who tend to
Thursday, January 27, 2011
Ikeain the Prenzlauer Berg district of Berlin.
live geo-searches bounded to Berlin
can we make any assumptions about what the actual locations are?
kind of, but not muchalso shows that people don’t search for Ikea on a Sunday as much as
Incidentally, the data data here
clearly there is week. This is cluster but the others are not very evident laws and even Ikea is
the rest of the a Tempelhof because Germany still has Sunday-closing
certainly shows the relative popularity of all the locations
not open on Sundays.
Ikea Lichtenberg was not open yet during this time frame
16. learning from maps
We can learn plenty about a city just from looking at its maps, and the places on the map.
17. The “Starbucks Index”, invented by designer Tom Coates, is calculated from the number of
Starbucks cafes per square kilometre of the city. By analysing Nokia’s places registry, we can
show the difference between difference cities, or different parts of a city, by looking at what
companies choose to base themselves there. We could equally well calculate a McDonalds
index, or an Italian food index, or a public parks index.
18. Searches are goal-driven user behaviour - someone typed something into a search box on a
phone. But we can even learn from activity that isn’t so explicit.
When someone views a Nokia Ovi map on the web or phone, the visuals for the map are
served up in square “tiles” from our servers. We can analyse the number of requests made for
each tile and take it as a measure of interest or attention in that part of the world.
19. Searches are goal-driven user behaviour - someone typed something into a search box on a
phone. But we can even learn from activity that isn’t so explicit.
When someone views a Nokia Ovi map on the web or phone, the visuals for the map are
served up in square “tiles” from our servers. We can analyse the number of requests made for
each tile and take it as a measure of interest or attention in that part of the world.
20. LA attention heatmap
This is the attention map of Los Angeles, California. We can clearly see several important
hotspots such as Downtown, Hollywood and LAX airport.
21. LA driving heatmap
If we turn to the navigation logs, we get another map of Los Angeles. This data is recorded
whenever someone requests a car route from one place to another. You can clearly see the
roads, and it heavily emphasises major roads because that’s what is favoured by route-
planning algorithms. It’s also a map made by people who don’t know where they’re going - if
they knew exactly what route to take, they wouldn’t be using navigation on their phones.
22. business perspective
City data also reflects business activity. In Berlin our local coffee shop owner uses pen and
paper to record every sale he makes. He uses this to optimise his pricing and the kinds of
coffee he sells. We can do some of the same analysis on a larger scale.
23. business context
Looking at the check-in and search patterns around coffee shops, we made this map of the
San Francisco Dolores Park area. Red circles are coffee shops, and blue circles are other
businesses. The larger the circle, the more popular the location is to visit.
24. usage patterns
We discovered we could deduce more than just business information from this data. When we
looked at one specific venue, Dolores Park itself, we can tell that San Francisco is cold at
night. No matter the time of year, checkins at the park are much lower in the evening and
night than in daytime.
When we looked at the day of the week that people visit the park, we thought we had a bug in
our data collection. Why would Thursday be different from other days for popularity of parks?
When we cross-referenced the data with weather records, we realised that this particular
Thursday was wet and cold.
Like many other examples in this presentation, we were excited by the fact that we can find
verifiable real-world information in pure data, without any human guidance.
25. “Information is
quickly becoming
a material to
design with.”
Mike Kuniavsky: http://orangecone.com/archives/2010/08/information_is_.html
In his recent book “Smart Things”, Mike Kuniavsky compares information to traditional
materials such as wood and rubber. It has now become a material that we can build with in
the real world, to connect the physical and the digital worlds together.
26. [nod to Matt Jones, for many conversations we had about cities while working together at
Dopplr]
27. Thank you.
Matt Biddulph
@mattb | matthew.biddulph@nokia.com
After the talk, there were questions from the audience...
28. Audience question
What about individual privacy, and the ethics of profiting from
individual user data?
1. We only ever analyse the aggregate, anonymised set of all users’ data. We didn’t track any
individuals in any part of this work.
2. I believe that it could only be unethical to profit from analysing user data if you don’t
return some value by making them a useful, desirable product in return.
29. Audience question
I’m not uncomfortable with services analysing my data, but I am
unhappy if I feel like I don’t own my personal data.
In my personal opinion, individual data belongs to the individual. Putting your data into a
large service gives you access to economies of scale, allowing it to do useful analysis of the
aggregate data that you couldn’t achieve with your data alone. You benefit from this when
their service gets better the more you use it.
A company you deposit data with should act like a bank: hold it in trust, generate some
benefit, give it back when you ask.