Solution Manual for Principles of Corporate Finance 14th Edition by Richard B...
CLX0202SalesGrowth-963963
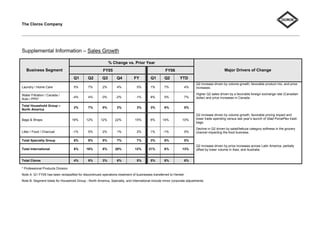
1. The Clorox Company
Supplemental Information – Sales Growth
% Change vs. Prior Year
Business Segment Major Drivers of Change
FY05 FY06
Q1 Q2 Q3 Q4 FY Q1 Q2 YTD
Q2 increase driven by volume growth, favorable product mix, and price
Laundry / Home Care 5% 7% 2% 4% 5% 1% 7% 4% increases.
Higher Q2 sales driven by a favorable foreign exchange rate (Canadian
Water Filtration / Canada /
-4% 4% 0% -2% -1% 8% 5% 7% dollar) and price increases in Canada.
Auto / PPD*
Total Household Group –
2% 7% 0% 2% 3% 3% 6% 5%
North America
Q2 increase driven by volume growth, favorable pricing impact and
lower trade spending versus last year’s launch of Glad ForceFlex trash
Bags & Wraps 16% 12% 12% 22% 15% 6% 14% 10%
bags.
Decline in Q2 driven by salad/lettuce category softness in the grocery
Litter / Food / Charcoal -1% 5% 2% 1% 2% 1% -1% 0% channel impacting the food business.
Total Specialty Group 6% 9% 5% 7% 7% 3% 6% 5%
Q2 increase driven by price increases across Latin America, partially
Total International 6% 16% 8% 20% 12% 21% 6% 13% offset by lower volume in Asia, and Australia.
Total Clorox 4% 9% 3% 6% 5% 5% 6% 6%
* Professional Products Division
Note A: Q1 FY05 has been reclassified for discontinued operations treatment of businesses transferred to Henkel.
Note B: Segment totals for Household Group - North America, Specialty, and International include minor corporate adjustments.