The Clorox Company Supplemental Information - Volume Growth by Business Segment for FY05 and FY06 YTD
1. The Clorox Company
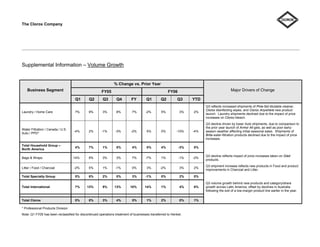
Supplemental Information – Volume Growth
% Change vs. Prior Year
Major Drivers of Change
Business Segment FY05 FY06
Q1 Q2 Q3 Q4 FY Q1 Q2 Q3 YTD
Q3 reflects increased shipments of Pine-Sol dilutable cleaner,
Clorox disinfecting wipes, and Clorox Anywhere new product
Laundry / Home Care 7% 9% 3% 8% 7% -2% 5% 3% 2%
launch. Laundry shipments declined due to the impact of price
increases on Clorox bleach.
Q3 decline driven by lower Auto shipments, due to comparison to
the prior year launch of Armor All gels, as well as poor early-
Water Filtration / Canada / U.S.
-4% 2% -1% -3% -2% 5% 0% -15% -4% season weather affecting initial seasonal sales. Shipments of
Auto / PPD*
Brita water-filtration products declined due to the impact of price
increases.
Total Household Group –
4% 7% 1% 5% 4% 0% 4% -3% 0%
North America
Q3 decline reflects impact of price increases taken on Glad
Bags & Wraps 14% 9% 3% 3% 7% -7% 1% -1% -2%
products.
Q3 shipment increase reflects new products in Food and product
Litter / Food / Charcoal -2% 5% 1% -1% 0% 3% -2% 3% 2%
improvements in Charcoal and Litter.
Total Specialty Group 5% 6% 2% 0% 3% -1% 0% 2% 0%
Q3 volume growth behind new products and category/share
Total International 7% 13% 9% 13% 10% 14% 1% 4% 6% growth across Latin America, offset by declines in Australia
following the exit of a low-margin product line earlier in the year.
Total Clorox 5% 8% 3% 4% 5% 1% 2% 0% 1%
* Professional Products Division
Note: Q1 FY05 has been reclassified for discontinued operations treatment of businesses transferred to Henkel.