More Related Content
Similar to The Clorox Company Sales Growth Report
Similar to The Clorox Company Sales Growth Report (20)
The Clorox Company Sales Growth Report
- 1. The Clorox Company
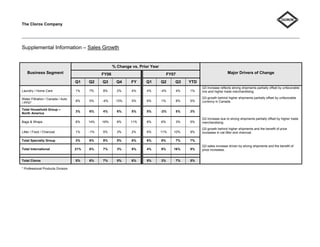
Supplemental Information – Sales Growth
% Change vs. Prior Year
Business Segment Major Drivers of Change
FY06 FY07
Q1 Q2 Q3 Q4 FY Q1 Q2 Q3 YTD
Q3 increase reflects strong shipments partially offset by unfavorable
Laundry / Home Care 1% 7% 8% 2% 4% 4% -4% 4% 1% mix and higher trade merchandising.
Q3 growth behind higher shipments partially offset by unfavorable
Water Filtration / Canada / Auto
8% 5% -4% 13% 5% 6% 1% 8% 5% currency in Canada.
/ PPD*
Total Household Group –
3% 6% 4% 6% 5% 5% -2% 5% 3%
North America
Q3 increase due to strong shipments partially offset by higher trade
Bags & Wraps 6% 14% 16% 6% 11% 6% 6% 3% 5% merchandising.
Q3 growth behind higher shipments and the benefit of price
Litter / Food / Charcoal 1% -1% 5% 3% 2% 6% 11% 10% 9% increases in cat litter and charcoal.
Total Specialty Group 3% 6% 9% 5% 6% 6% 8% 7% 7%
Q3 sales increase driven by strong shipments and the benefit of
Total International 21% 6% 7% 3% 9% 4% 9% 16% 9% price increases.
Total Clorox 5% 6% 7% 5% 6% 5% 3% 7% 5%
* Professional Products Division