Download to read offline
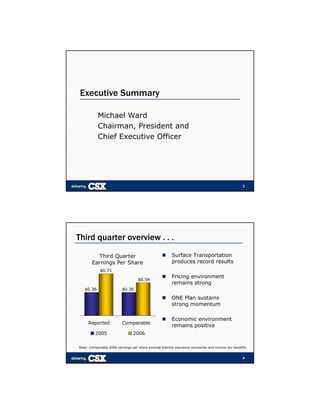
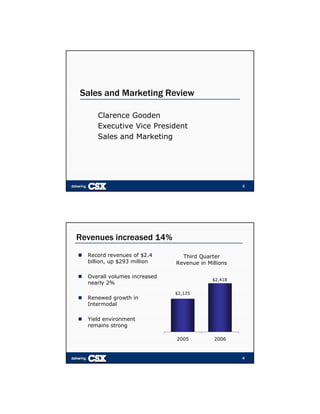
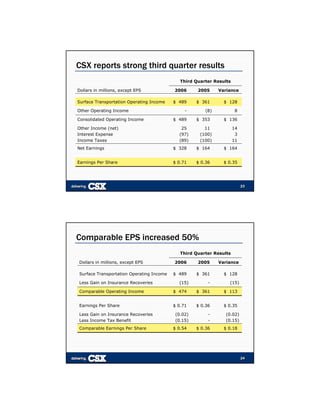
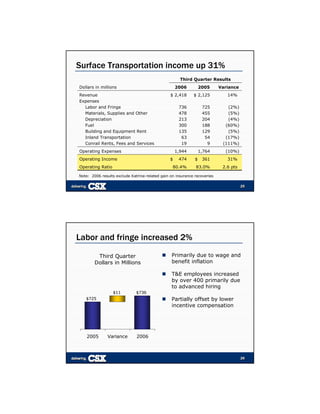
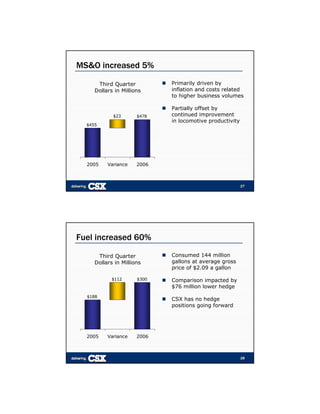
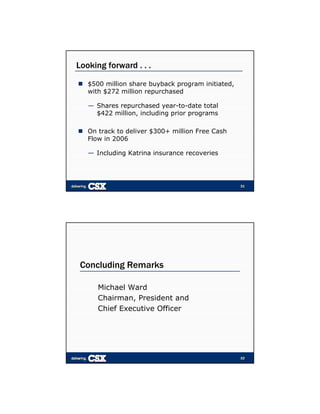
The document summarizes CSX's third quarter 2006 earnings presentation. It reports that CSX had record third quarter revenues of $2.4 billion, up 14% from the previous year. Surface transportation operating income increased 31% to $489 million. Comparable earnings per share increased 50% to $0.54, excluding insurance recoveries and tax benefits. CSX also initiated a $500 million share buyback program and expects to deliver over $300 million in free cash flow for 2006. Overall, CSX's core strategies are sustaining solid momentum and financial performance.