1. The Clorox Company
Supplemental Volume Growth Information
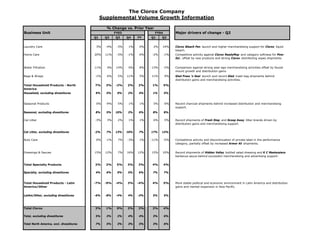
% Change vs. Prior Year
Business Unit Major drivers of change - Q2
FY03 FY04
Q1 Q2 Q3 Q4 FY Q1 Q2
Laundry Care 3% -4% -3% 1% 0% 2% 14% Clorox Bleach Pen launch and higher merchandising support for Clorox liquid
bleach.
Home Care 20% 11% -3% -1% 6% -2% -1% Competitive activity against Clorox ReadyMop and category softness for Pine-
Sol , offset by new products and strong Clorox disinfecting wipes shipments.
Water Filtration 11% 4% 14% 0% 8% -13% -2% Comparison against strong year-ago merchandising activities offset by faucet
mount growth and distribution gains.
Bags & Wraps -1% 6% 5% 11% 5% 11% 9% Glad Press 'n Seal launch and record Glad trash bag shipments behind
distribution gains and merchandising activities.
Total Household Products - North 7% 3% -2% 2% 2% 1% 5%
America
Household, excluding divestitures 9% 5% 0% 2% 4% 1% 5%
Seasonal Products 0% -9% 5% 1% 1% 5% 6% Record charcoal shipments behind increased distribution and merchandising
support.
Seasonal, excluding divestitures 8% 5% 10% 2% 6% 8% 8%
Cat Litter -3% 3% 2% 1% 1% 6% 5% Record shipments of Fresh Step and Scoop Away litter brands driven by
distribution gains and merchandising support.
Cat Litter, excluding divestitures -2% 7% 13% 10% 7% 17% 13%
Auto Care 0% -1% 7% -3% 1% -11% -5% Competitive activity and discontinuation of private label in the performance
category, partially offset by increased Armor All shipments.
Dressings & Sauces 15% 12% 7% 16% 12% 15% 10% Record shipments of Hidden Valley bottled salad dressing and K C Masterpiece
barbecue sauce behind successful merchandising and advertising support.
Total Specialty Products 2% 2% 5% 3% 3% 4% 4%
Specialty, excluding divestitures 4% 6% 9% 5% 6% 7% 7%
Total Household Products - Latin -7% -9% -4% 3% -4% 4% 5% More stable political and economic environment in Latin America and distribution
America/Other gains and market expansion in Asia Pacific.
LatAm/Other, excluding divestitures -6% -8% -4% 4% -3% 5% 5%
Total Clorox 3% 1% 0% 2% 2% 2% 4%
Total, excluding divestitures 5% 3% 2% 4% 4% 3% 6%
Total North America, excl. divestitures 7% 5% 3% 3% 5% 3% 6%
2. The Clorox Company
Supplemental Balance Sheet and Cash Flow Information – Preliminary* (unaudited)
For the quarter ended December 31, 2003
Working Capital (WC) Update
Q2 ’04 Q2 ’03 Change Days Days Change
($ million) ($ million) ($ million) ’04 ’03
Receivables, net 345 327 +18 34 34 0 days
Inventories 305 274 +31 49 47 +2 days
Accounts payable 235 260 -25 41 47 -6 days
Accrued liabilities 522 460 +62
Total WC(1) -77 -91 +14
Avg WC% Net sales(2) -1.9% -2.0% +0.1 pts
• Receivables were higher due to increased volume.
• Inventory was higher due to normalization of charcoal inventory levels.
• Accounts payable decreased due to prior year outstanding invoices associated with
Delta Phase I implementation costs.
• Accrued liabilities increased as a result of higher tax-related and other accruals.
Depreciation and amortization was $48 million
Cash provided by operations
• Preliminary net cash provided by operations was $188 million, 20 percent of net
sales and 6 percent below the year-ago quarter.
Capital expenditures were $44 million
• $32 million related to infrastructure improvements, cost savings and new products.
• $12 million for process and systems implementation (“Project Delta”).
Share repurchases
• This quarter the company repurchased a total of about 1.6 million shares at a cost of
$73 million.
*Preliminary estimates. Final numbers will be published in our Form 10-Q.
(1)
Current assets minus current liabilities excluding cash and short term debt.
(2)
Based on a two points average working capital divided by annualized net sales (current
quarter Net sales x 4).